. 2023 Jan;58(1):41-62.
doi: 10.1111/maps.13933. Epub 2022 Dec 4.

Askival: An altered feldspathic cumulate sample in Gale crater

Affiliations

Askival: An altered feldspathic cumulate sample in Gale crater

Donald Lewis Bowden et al. Meteorit Planet Sci. 2023 Jan.

Abstract

Askival is a light-toned, coarsely crystalline float rock, which was identified near the base of Vera Rubin Ridge in Gale crater. We have studied Askival, principally with the ChemCam instrument but also using APXS compositional data and MAHLI images. Askival and an earlier identified sample, Bindi, represent two rare examples of feldspathic cumulate float rocks in Gale crater with >65% relict plagioclase. Bindi appears unaltered whereas Askival shows textural and compositional signatures of silicification, along with alkali remobilization and hydration. Askival likely experienced multiple stages of alteration, occurring first through acidic hydrolysis of metal cations, followed by deposition of silica and possible phyllosilicates at low T and neutral-alkaline pH. Through laser-induced breakdown spectroscopy compositional analyses and normative calculations, we suggest that an assemblage of Fe-Mg silicates including amphibole and pyroxene, Fe phases, and possibly Mg-rich phyllosilicate are present. Thermodynamic modeling of the more pristine Bindi composition predicts that amphibole and feldspar are stable within an upper crustal setting. This is consistent with the presence of amphibole in the parent igneous rocks of Askival and suggests that the paucity of amphiboles in other known Martian samples reflects the lack of representative samples of the Martian crust rather than their absence on Mars.


Figures

Fig. 1
Fig. 1
Traverse map showing the Bressay site where Askival is located, as well as the location of Bindi. In addition, the Marias Pass, Bridger Basin, and Naukluft Plateau locales, at which evidence of diagenetic silica enrichment was encountered (Frydenvang et al., 2017), are marked. Parentheses indicate mission sols covering each area. (Color figure can be viewed at wileyonlinelibrary.com.)
Fig. 2
Fig. 2
MastCam mosaic CX02016MR0691552 of Bressay workspace with labeled scientific targets. The Askival sample is ~20 cm in length. Source images: NASA/JPL‐Caltech/MSSS, DOI 10.17189/1520328. Context mosaic produced by Mars Analyst's Notebook. (Color figure can be viewed at wileyonlinelibrary.com.)
Fig. 3
Fig. 3
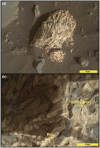
MAHLI images of Askival. a) Context image from ~25 cm standoff (sequence ID 000706). b) Close‐up image showing surface texture (sequence ID 00656). Examples of pitting in dark material and of triclinic crystal termination are labeled. (Color figure can be viewed at wileyonlinelibrary.com.)
Fig. 4
Fig. 4
MAHLI images of Askival with differing illumination. a) Daytime illumination (sequence ID 000458). b) Nighttime with LED illumination (sequence ID 000739). Red markers indicate examples of phases 1–4 (see the section Askival and Table 1). (Color figure can be viewed at wileyonlinelibrary.com.)
Fig. 5
Fig. 5
a) ChemCam RMI image of Bindi, with markers showing location of ChemCam target points. Yellow arrow indicates characteristic plagioclase lathe forms in phase 1. Blue arrow indicates darker interstitial phase 2. b–d) Colorized RMI images from Mastcam color merge (Le Mouélic et al., 2015) of Askival, with markers showing location of ChemCam target points in sequences Askival (b), Askival_2 (c), and Askival_3 (d). (Color figure can be viewed at wileyonlinelibrary.com.)
Fig. 6
Fig. 6
Major oxide plots for Askival, Bindi ChemCam, and Askival APXS data. Igneous contours represent bulk ChemCam data (Edwards et al., 2017). Askival's light‐toned phase 1 shows an enrichment of silica correlating with a decrease in other elements, representing an alteration trend away from Bindi's composition. This is shown in more detail in Fig. 8. Adirondack basalt composition from McSween et al. (2004). Error bars show ChemCam precision and accuracy from Bedford et al. (2019). (Color figure can be viewed at wileyonlinelibrary.com.)
Fig. 7
Fig. 7
Scatter plot showing normalized hydrogen peak area against SiO2 content. Data are plotted for all ChemCam points in Askival as well as other igneous material from the Bressay locality and across the Bradbury sedimentary group. Data point annotations indicate raster (first number) and point number (second number). The vertical arrow illustrates the bias from random enhancement in hydrogen signal related to the roughness of the target surface (Rapin, Bousquet, et al., 2017). The black cross to the lower right of the plot represents ChemCam limit of detection for water for anhydrous silica (about 0.2 wt%), and black squares show endmembers for chalcedony, microcrystalline quartz which may contain 1 wt% water (Flörke et al., 1982), and example of opals with various possible water contents. The dotted line represents calibration to opaline silica, with 1‐sigma uncertainty related to the laboratory calibration and instrument response function correction factor (Rapin et al., ; Rapin, Meslin, et al., 2017). *Igneous float rocks from Bradbury described in Cousin et al. (2017). (Color figure can be viewed at wileyonlinelibrary.com.)
Fig. 8
Fig. 8
Scatter plots of total alkali, Al2O3, and MgO versus silica showing linear projections of stoichiometric plagioclase feldspar (Or05, blue line) as well as chemical trends due to modeled linear dissolution of feldspar (loss of alkali and aluminum) and enrichment in Mg (red arrow) from a Bindi‐like plagioclase starting composition. It then shows the silicification trend highlighting the enrichment in silica of the altered feldspar (dashed line). Nakhlite serpentine composition as reported (Hicks et al., ; Piercy et al., 2022). *Igneous float rocks from Bradbury described in Cousin et al. (2017). (Color figure can be viewed at wileyonlinelibrary.com.)
Fig. 9
Fig. 9
Shot‐to‐shot analysis of FeOT and SiO2 content at target point Askival #1. Number labels indicate shot order, first five shots are excluded due to dust cover. Linear regression indicates a negative correlation between FeOT and SiO2, with earlier points (6–13) having higher FeOT and lower SiO2. (Color figure can be viewed at wileyonlinelibrary.com.)
Fig. 10
Fig. 10
Independent component analysis dendrogram displaying hierarchical clustering of Askival target points from all three rasters, based on major oxide composition. Elemental labels on each branch show the components which are higher in that cluster, with parentheses indicating that there is significant overlap in an element between the two clusters at that dividing step. Blue text phase classification based on RMI images (see Fig. 3). A clear compositional distinction between texturally identified phases 1–3 is present. The light‐toned phase is divided into two halves, primarily differing in SiO2 content (see the section Askival). (Color figure can be viewed at wileyonlinelibrary.com.)
Fig. 11
Fig. 11
Scatter plots of Al2O3 and MgO versus silica focusing on Askival phase 1. Shot‐to‐shot composition data (light‐blue dots and lines) are displayed along with shot‐to‐shot linear regression (dark blue lines) for each phase 1 point. *Igneous float rocks from Bradbury described in Cousin et al. (2017). (Color figure can be viewed at wileyonlinelibrary.com.)
Fig. 12
Fig. 12
Calculated phase stabilities for the Bindi composition at a fixed H2O content of 0.5 wt%. Mineral abbreviations: Amp = amphibole; Cpx = clinopyroxene; Fsp = feldspar; Ilm = ilmenite; Ol = olivine; qz = quartz; Spl = spinel. (Color figure can be viewed at wileyonlinelibrary.com.)
Fig. 13
Fig. 13
Modeled molar proportions of Fe3+ in amphibole for the Bindi composition. Amphibole with the highest Fe3+ content coexists with melt at pressures above ~1400 bars. (Color figure can be viewed at wileyonlinelibrary.com.)

References

    1. Anderson, R. B. , Clegg, S. M. , Frydenvang, J. , Wiens, R. C. , McLennan, S. , Morris, R. V. , Ehlmann, B. , and Dyar, M. D. 2017. Improved Accuracy in Quantitative Laser‐Induced Breakdown Spectroscopy Using Sub‐Models. Spectrochimica Acta Part B: Atomic Spectroscopy 129: 49–57.
    1. Bandfield, J. L. 2002. Global Mineral Distributions on Mars. Journal of Geophysical Research: Planets 107: 9‐1–9‐20.
    1. Bedford, C. , Schwenzer, S. P. , Bridges, J. C. , Banham, S. , Wiens, R. C. , Gasnault, O. , Rampe, E. , Frydenvang, J. , and Gasda, P. J. 2020. Geochemical Variation in the Stimson Formation of Gale Crater: Provenance, Mineral Sorting, and a Comparison with Modern Martian Dunes. Icarus 341: 113622.
    1. Bedford, C. C. , Bridges, J. C. , Schwenzer, S. P. , Wiens, R. C. , Rampe, E. B. , Frydenvang, J. , and Gasda, P. J. 2019. Alteration Trends and Geochemical Source Region Characteristics Preserved in the Fluviolacustrine Sedimentary Record of Gale Crater, Mars. Geochimica et Cosmochimica Acta 246: 234–66.
    1. Berger, G. , Toplis, M. J. , Treguier, E. , d'Uston, C. , and Pinet, P. 2009. Evidence in Favor of Small Amounts of Ephemeral and Transient Water During Alteration at Meridiani Planum, Mars. American Mineralogist 94: 1279–82.

LinkOut - more resources