. 2023 Apr 18;3(4):621-639.
doi: 10.1158/2767-9764.CRC-22-0389. eCollection 2023 Apr.

African American Prostate Cancer Displays Quantitatively Distinct Vitamin D Receptor Cistrome-transcriptome Relationships Regulated by BAZ1A

Affiliations

African American Prostate Cancer Displays Quantitatively Distinct Vitamin D Receptor Cistrome-transcriptome Relationships Regulated by BAZ1A

Manjunath Siddappa et al. Cancer Res Commun. .

Abstract

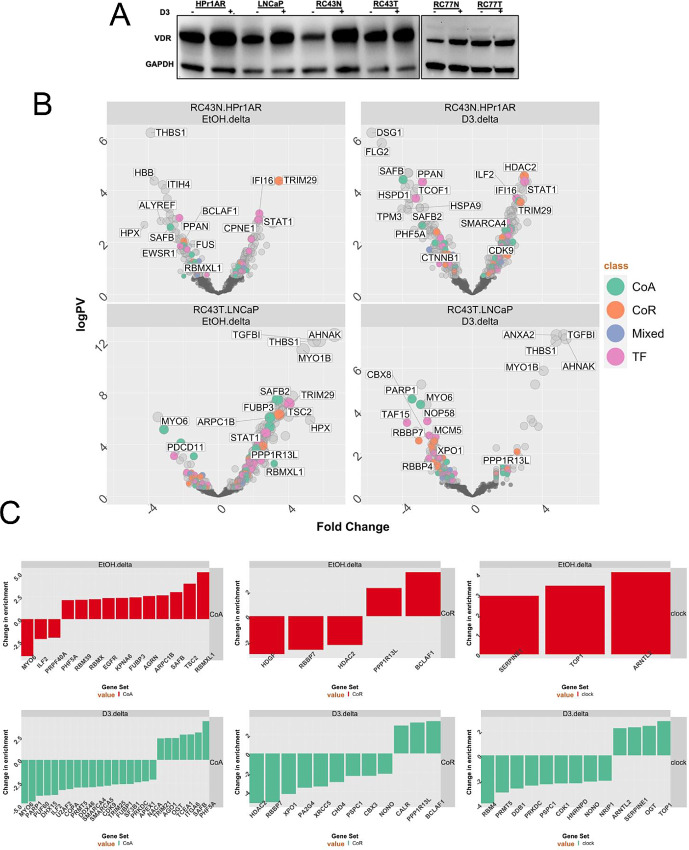
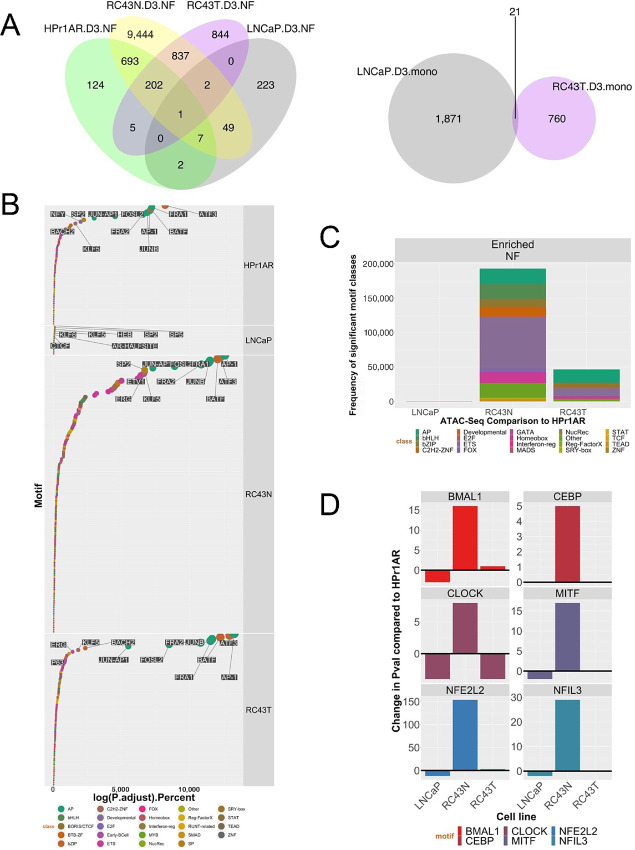
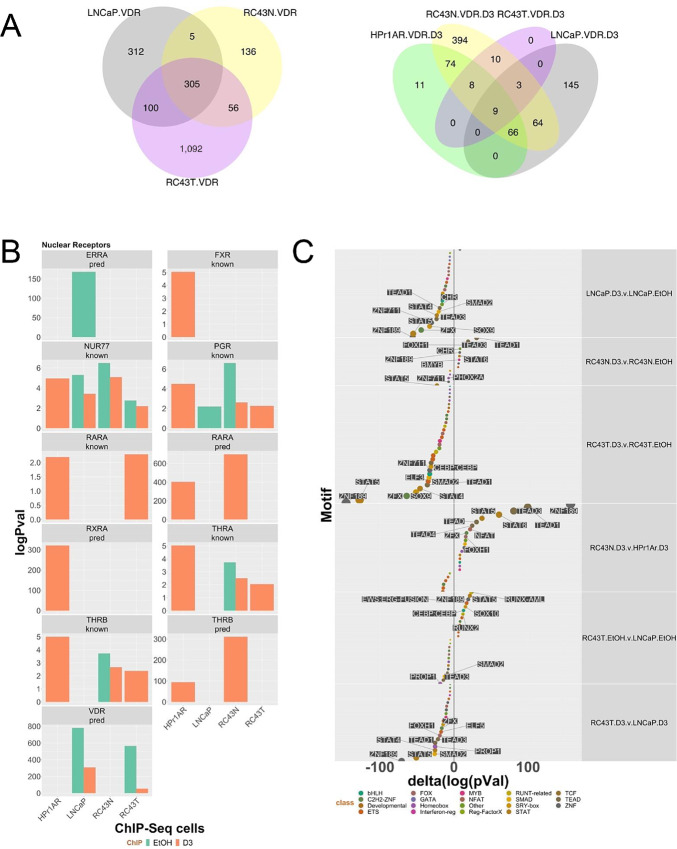
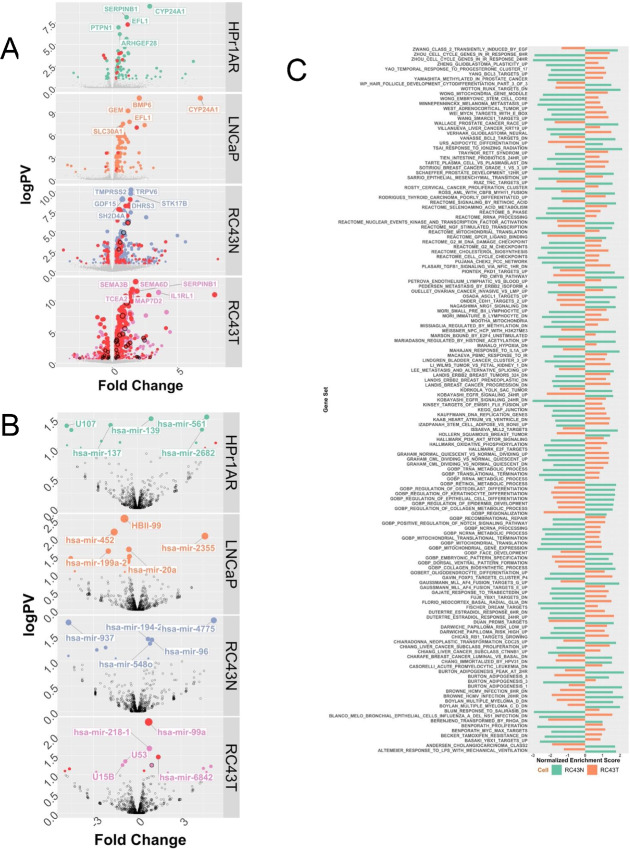
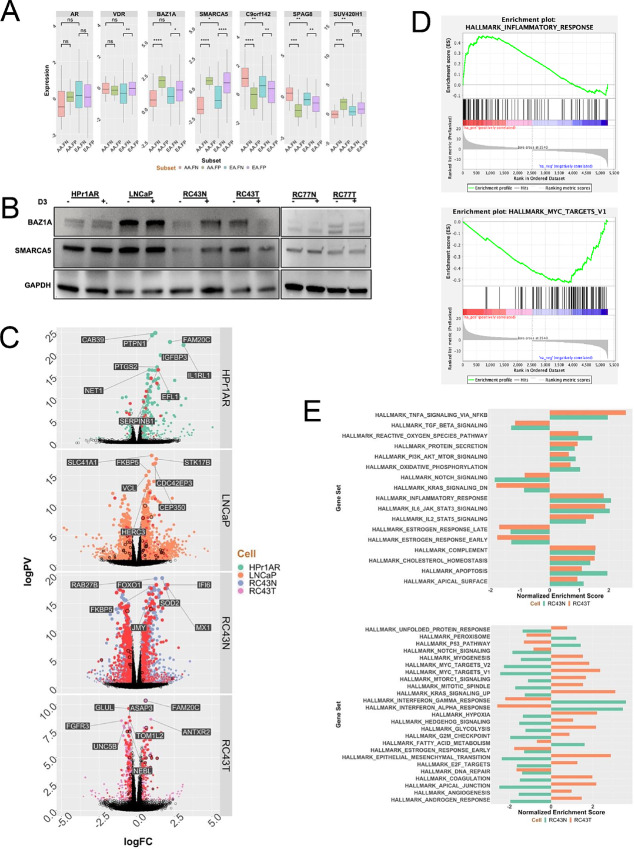
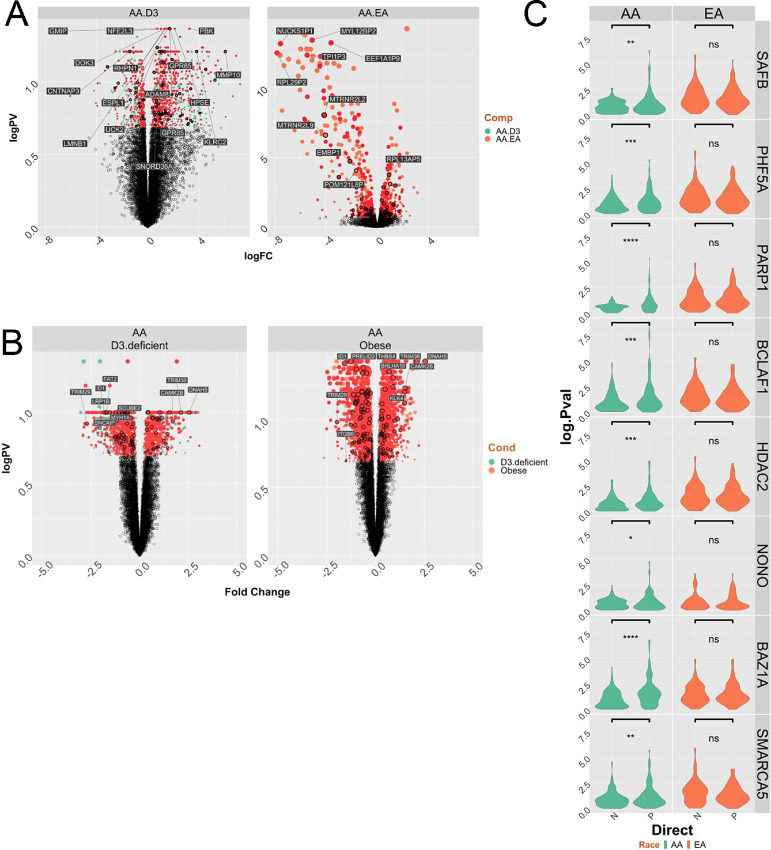
African American (AA) prostate cancer associates with vitamin D3 deficiency, but vitamin D receptor (VDR) genomic actions have not been investigated in this context. We undertook VDR proteogenomic analyses in European American (EA) and AA prostate cell lines and four clinical cohorts. Rapid immunoprecipitation mass spectrometry of endogenous protein (RIME) analyses revealed that nonmalignant AA RC43N prostate cells displayed the greatest dynamic protein content in the VDR complex. Likewise, in AA cells, Assay for Transposase-Accessible Chromatin using sequencing established greater 1α,25(OH)2D3-regulated chromatin accessibility, chromatin immunoprecipitation sequencing revealed significant enhancer-enriched VDR cistrome, and RNA sequencing identified the largest 1α,25(OH)2D3-dependent transcriptome. These VDR functions were significantly corrupted in the isogenic AA RC43T prostate cancer cells, and significantly distinct from EA cell models. We identified reduced expression of the chromatin remodeler, BAZ1A, in three AA prostate cancer cohorts as well as RC43T compared with RC43N. Restored BAZ1A expression significantly increased 1α,25(OH)2D3-regulated VDR-dependent gene expression in RC43T, but not HPr1AR or LNCaP cells. The clinical impact of VDR cistrome-transcriptome relationships were tested in three different clinical prostate cancer cohorts. Strikingly, only in AA patients with prostate cancer, the genes bound by VDR and/or associated with 1α,25(OH)2D3-dependent open chromatin (i) predicted progression from high-grade prostatic intraepithelial neoplasia to prostate cancer; (ii) responded to vitamin D3 supplementation in prostate cancer tumors; (iii) differentially responded to 25(OH)D3 serum levels. Finally, partial correlation analyses established that BAZ1A and components of the VDR complex identified by RIME significantly strengthened the correlation between VDR and target genes in AA prostate cancer only. Therefore, VDR transcriptional control is most potent in AA prostate cells and distorted through a BAZ1A-dependent control of VDR function.

Significance: Our study identified that genomic ancestry drives the VDR complex composition, genomic distribution, and transcriptional function, and is disrupted by BAZ1A and illustrates a novel driver for AA prostate cancer.


Figures

FIGURE 1
FIGURE 1
Expression of VDR and responses to 1α,25(OH)2D3 in AA and EA cell lines. A, Western immunoblot measurements of VDR levels after 1α,25(OH)2D3 treatment (100 nmol/L, 24 hours) or vehicle control. B, RIME analyses of VDR in the indicated cells (in quadriplicates) and significantly different proteins were identified using an edgeR workflow. Volcano plots depicting enrichment levels, compared with IgG controls, between the indicated cells in basal or 1α,25(OH)2D3-stimulated conditions (100 nmol/L, 4 hours). Significant (Padj < 0.1) differentially and uniquely enriched proteins in each cell and treatment condition were classified either as a CoA, CoR, Mixed, or TF. C, The most altered components of the VDR complex were established in RC43T compared with LNCaP, and RC43N with HPr1AR, and then the delta between these comparisons were identified and ranked.
FIGURE 2
FIGURE 2
VDR ATAC-seq in AA and EA cell lines. A, ATAC-seq was undertaken in triplicate in HPr1AR, LNCaP, RC43N, and RC43T following 1α,25(OH)2D3 treatment (100 nmol/L, 4 hours) or vehicle control. FASTQ files were QC processed, aligned to hg38 (Rsubread), sorted and duplicates removed before further processing with ATACseqQC to generate nucleosome free and mononucleosome regions. Differential enrichment of regions was measured with csaw and the significantly different regions (Padj < 0.1) were then intersected to generate the Venn diagrams of overlapping regions by a minimum of 1 bp (ChIPpeakAnno). B, Motif enrichment in NF regions was undertaken with Homer and ranked by significance to visualize in descending significance. C, Frequency of enriched motifs by TF families’ class. D, Enrichment of circadian rhythm TFs.
FIGURE 3
FIGURE 3
VDR ChIP-seq in AA and EA cell lines. A, Basal and 1α,25(OH)2D3-stimulated (100 nmol/L, 6 hours) VDR ChIP-seq was undertaken in triplicate in HPr1AR, LNCaP, RC43N, and RC43T. FASTQ files were QC processed, aligned to hg38 (Rsubread), sorted and duplicates removed before differential enrichment of regions was measured with csaw and the significantly different regions compared with IgG controls (Padj < 0.1) were then intersected to generate the Venn diagrams of overlapping regions by a minimum of 1 bp (ChIPpeakAnno). B, Significantly differentially enriched motifs were identified by Homer and nuclear receptors are illustrated. C, Changes in motif enrichment were calculated (delta) and ranked by significance for visualization.
FIGURE 4
FIGURE 4
1α,25(OH)2D3-dependent RNA- and small RNA-Seq in AA and EA cell lines. A and B, Basal and 1α,25(OH)2D3-stimulated (100 nmol/L, 8 hours) RNA-seq was undertaken in triplicate in HPr1AR, LNCaP, RC43N, and RC43T. FASTQ files were QC processed, aligned to hg38 (Rsubread), and processed with limma-voom and edgeR workflow to identify significant DEGs (logPV > 1 and absFC > 0.37) are illustrated on Volcano plots with top DEGs illustrated. C, GSEAs (Chemical Perturbations in GSEA) was undertaken and the terms identified and visualized where the NES was in the opposite direction are visualized in RC43N and RC43T.
FIGURE 5
FIGURE 5
The impact of BAZ1A on expression of VDR-dependent gene networks. A, Altered BAZ1A and SMARCA5 expression in AA prostate cancer was identified in TCGA prostate cancer cohort by comparing EA and AA tumors and considering status of TMPRSS2 translocations. B, The blot used for Fig. 1A (cells treated with 1α,25(OH)2D3 (100 nmol/L, 24 hours) or vehicle control and total protein isolated) was stripped and reprobed with antibodies toward BAZ1A and SMARCA5. C, Unique DEGs in cells with restored expression of BAZ1A. D, BAZ1A-dependent DEGs enhanced inflammatory responses and repressed MYC networks. E, Comparable and divergent GSEA enrichment in BAZ1A-dependent DEGS in RC43N and RC43T that were different from the direction of enrichment in the parental cells.
FIGURE 6
FIGURE 6
VDR cistrome-transciptome relationships in prostate cancer. A, A cohort of 7 AA patients with prostate cancer with conserved African genomic ancestry and 16 EA patients with prostate cancer were treated with vitamin D3 (4,000 IU daily), and RNA-seq undertaken on the tumors following radical prostatectomy, as we reported previously (6). Significantly differentially regulated genes in the AA prostate cancer group (there were no DEGs in the EA prostate cancer group) were overlapped with genes annotated to ATAC-seq or ChIP-seq regions within 100 kb. The Volcano plot of the DEGs for the response in AA men (left), or comparing basal AA to EA prostate cancer (right) and annotated with genes that are VDR bound and/or 1α,25(OH)2D3-dependent NF region annotated genes. B, RNA-seq was undertaken in tumors from a cohort of 57 AA and 18 EA patients who underwent radical prostatectomy at Northwestern Medical Center. Tumor-specific significant DEGs were identified for deficient serum 25(OH)D3 (serum 25(OH)D3 levels < 12 ng/mL; low; left) or obesity (BMI > 30; O; right). In each case BMI or 25(OH)D3 levels were kept as a continuous variable, respectively. The DEGs for 25(OH)D3 deficiency (left) of obesity (right) in the AA prostate cancer group (there were no DEGs in the EA prostate cancer group) were overlapped with genes annotated to ATAC-seq or ChIP-seq regions within 100 kb. C, Partial correlation analyses in equal numbers of AA or EA tumors (n = 36) from Northwestern cohort was undertaken between VDR and either AA or EA ChIP-seq annotated genes in AA and EA tumors respectively considering the impact of the indicated coregulators. The change in the correlation (delta.corr) was calculated as the difference between the Pearson correlation and Pearson partial correlations between VDR and these target genes and each of the indicated coregulators.

References

    1. Patel HD, Doshi CP, Koehne EL, Hart S, Van Kuiken M, Quek ML, et al. African American men have increased risk of prostate cancer detection despite similar rates of anterior prostatic lesions and PI-RADS grade on multiparametric magnetic resonance imaging. Urology 2022;163:132–7. - PubMed
    1. Hoffmann TJ, Van Den Eeden SK, Sakoda LC, Jorgenson E, Habel LA, Graff RE, et al. A large multiethnic genome-wide association study of prostate cancer identifies novel risk variants and substantial ethnic differences. Cancer Discov 2015;5:878–91. - PMC - PubMed
    1. Helfand BT, Roehl KA, Cooper PR, McGuire BB, Fitzgerald LM, Cancel-Tassin G, et al. Associations of prostate cancer risk variants with disease aggressiveness: results of the NCI-SPORE Genetics Working Group analysis of 18,343 cases. Hum Genet 2015;134:439–50. - PMC - PubMed
    1. Awasthi S, Berglund A, Abraham-Miranda J, Rounbehler RJ, Kensler K, Serna A, et al. Comparative genomics reveals distinct immune-oncologic pathways in African American men with prostate cancer. Clin Cancer Res 2021;27:320–9. - PMC - PubMed
    1. Yuan J, Kensler KH, Hu Z, Zhang Y, Zhang T, Jiang J, et al. Integrative comparison of the genomic and transcriptomic landscape between prostate cancer patients of predominantly African or European genetic ancestry. PLoS Genet 2020;16:e1008641. - PMC - PubMed

Publication types