. 2021 Dec 21:2:100035.
doi: 10.1016/j.bbadva.2021.100035. eCollection 2022.

APP deficiency and HTRA2 modulates PrPc proteostasis in human cancer cells

Affiliations

APP deficiency and HTRA2 modulates PrPc proteostasis in human cancer cells

Denis S F Biard et al. BBA Adv. .

Abstract

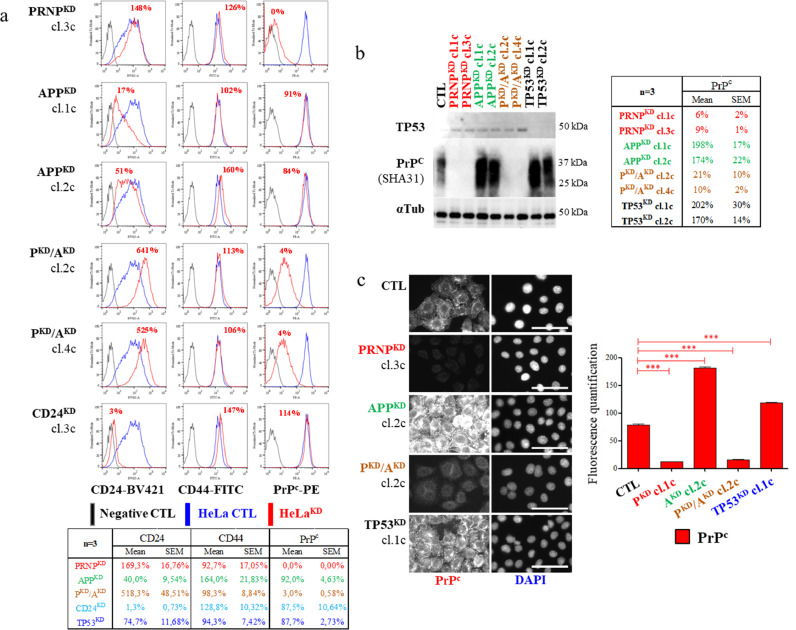
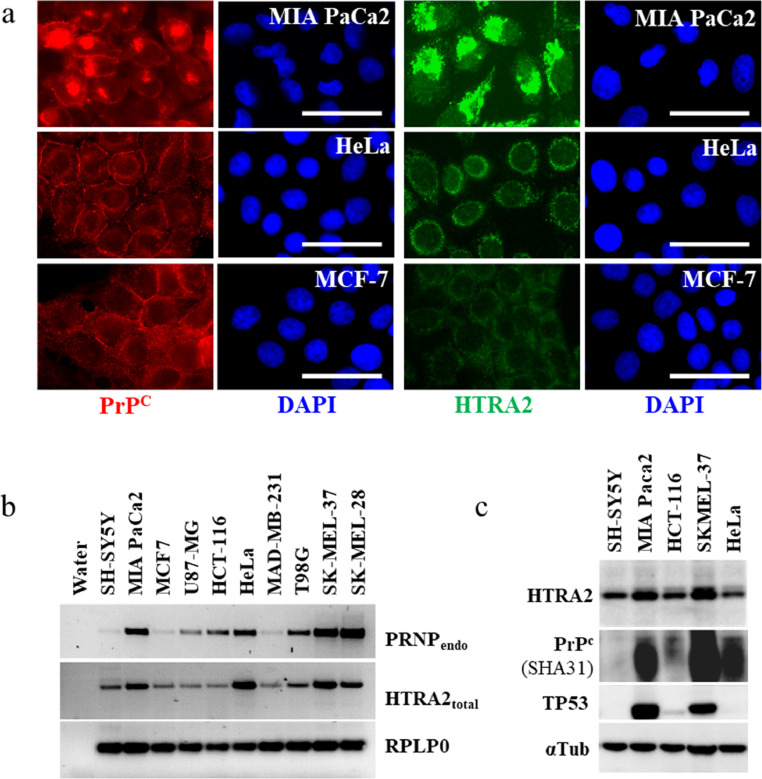
Cellular protein homeostasis (proteostasis) requires an accurate balance between protein biosynthesis, folding, and degradation, and its instability is causally related to human diseases and cancers. Here, we created numerous engineered cancer cell lines targeting APP (amyloid ß precursor protein) and/or PRNP (cellular prion) genes and we showed that APP knocking-down impaired PRNP mRNA level and vice versa, suggesting a link between their gene regulation. PRNPKD, APPKD and PRNPKD/APPKD HeLa cells encountered major difficulties to grow in a 3D tissue-like environment. Unexpectedly, we found a cytoplasmic accumulation of the PrPc protein without PRNP gene up regulation, in both APPKD and APPKO HeLa cells. Interestingly, APP and/or PRNP gene ablation enhanced the chaperone/serine protease HTRA2 gene expression, which is a protein processing quality factor involved in Alzheimer's disease. Importantly, HTRA2 gene silencing decreased PRNP mRNA level and lowered PrPc protein amounts, and conversely, HTRA2 overexpression increased PRNP gene regulation and enhanced membrane-anchored and cytoplasmic PrPc fractions. PrPc, APP and HTRA2 destabilized membrane-associated CD24 protein, suggesting changes in the lipid raft structure. Our data show for the first time that APP and the dual chaperone/serine protease HTRA2 protein could modulate PrPc proteostasis hampering cancer cell behavior.

Keywords: APP; CD24; CRISPR-Cas9; HTRA2; PRNP; PrPc; RNA interference; cancer cells; pEBVsiRNA; proteostasis.


Conflict of interest statement

The authors declare no competing interests.

Figures

Fig. 1:
Fig. 1
Quantitative and qualitative diversity for PrPc and APP protein content. Cells were plated (9.105 cells per 6 cm diameter dishes) and cultivated at the same time. Cells were recovered 2 days later for protein analyses. (a) ICC stainings were performed with a pool of 2 antibodies against PrPc, SAF32 (epitope amino acids 79–92) and SHA31 (aa 148–159), this allows detection of all putative PrPc fragments. Antibodies epitope location is depicted in Fig. S1c. Cells were counterstained with DAPI to visualize nuclei (scale bar 25 µm). (b) Western blot analysis of PrPc was performed with 5 µg of protein per slot or (c) 105 cell equivalents. Proteins were loaded and separated on a 12% SDS-polyacrylamide gel. Western blots b) and c) represented two independent culture experiments. Western blot were quantified in using ImageJ. Color code corresponds to the TP53 genotype of each cell lines: green = wild-type, blue = null, red = mutated, black = wild-type with viral protein or transcription-inactive p53β variant. (d) ICC staining against APP using the monoclonal 22C11 antibody and counterstained with DAPI (scale bar 25 µm). Relationship between endogenous PRNP and APP gene expressions in parental cell lines. (e) In parallel to protein analyses, mRNA was quantified by RT qPCR, and ordered in function of their relative quantification. Experiments were reproduced twice.
Fig. 2:
Fig. 2
Relationship between PRNP and APP gene expression. RT qPCR analysis of PRNP and APP in stable (a) MDA-MB-231 or (b) HCT-116 cells. Reversion experiment in HeLaKD cells. Stable HeLaKD clones were maintained in culture for 20 and 40 additional days with (c) or without (d) hygromycin B to revert gene silencing. At indicated time, PRNP and APP mRNA were analysed by RT qPCR. REVP means reversed PRNPKD, REVA means reversed APPKD, REVP/A means reversed PRNPKD/APPKD. Primers used are indicated in Table S4.
Fig. 3:
Fig. 3
PRNP and/or APP gene silencing impairs 3D cell growth. (a) Characterization of stable HeLaKD cells by RT PCR; primers used are indicated in Table S4. (b) PRNPKD and CD24KD cells acquired a fibroblastic-like appearance. Illustrative bright field observations of HeLaKD cells 14 days after transfection are shown (scale bar: 50 µm). At least 3 fields corresponding to 300 cells per cell line were quantified with ImageJ for shape indicators (circularity and roundness, mean +/- SEM), and statistical analysis was performed using GraphPad Prism v5 right), n = 2. (c) Culture in soft agar. HeLaKD cells were cultivated in presence or not of hygromycin B for 2 weeks and thereafter 5000 HeLa cells were seeded in soft agar (+/- hygromycin B) for 18 additional days. Each point represents the mean of 3 wells +/- SD. (d) Culture in a tissue-like environment. 3000 stable HeLaKD clones were embedded into collagen matrices (three wells per point) and cultivated for 17 days. Collagen gels were analysed with a binocular microscope or an indirect microscope, as indicated in M&M. Growing colonies were counted. Indicated values correspond to mean +/-SD. Experiments have been reproduced four times.
Fig. 4:
Fig. 4
Altered membrane-anchored CD24 content in PRNP and APP deficient stable HeLa cells. (a) Membrane-associated CD24, CD44, and PrPc proteins were analysed by flow cytometry in living stable HeLaKD clones 57 days after transfection. 200,000 cells were plated in 6 cm diameter dishes and analyzed 6 days later at about 95% of confluence. Percentages correspond to the mean fluorescence intensity as compared to control HeLa cells carrying the pBD650 plasmid. The Table underneath the panel (a) represents the mean +/-SEM of three independent flow cytometry experiments performed with different clones and/or different culture conditions. Cytoplasmic accumulation of PrPc in APPKD HeLa clones (b) Representative Western blot were quantified with ImageJ (mean +/- SEM, n = 3). (c) Illustrative PrPc stainings in HeLaKD cells (scale bar = 25 µm). 1237 individual cells in 4 to 7 fields per sample were analysed with ImageJ and GraphPad Prism (mean+/- SEM, n = 3).
Fig. 5:
Fig. 5
HTRA2 and PrPc co-expression. (a) ICC detection of HTRA2 in three tumor-derived cells cultivated at the same time. Cells were cultivated as indicated in legend of Fig. 1, and stained for PrPc (SHA31 + SAF32 antibodies) or HTRA2. They were counterstained with DAPI to visualize nuclei (scale bar 25 µm). (b) RT PCR analysis of PRNP and HTRA2 expression in 10 cell lines cultivated in parallel (n = 2). Primer used are described in Table S4. (c) Western blot analysis of HTRA2 in 5 cell lines.
Fig. 6:
Fig. 6
HTRA2 down regulation lowers PRNP gene expression. (a) Representative PrPc (SHA31 + SAF32 antibodies), APP or HTRA2 stainings 14 days after transfection of HeLa cells. Cells were counterstained with DAPI to visualize nuclei (scale bar 25 µm). 1637 individual cells in 4 to 5 fields per sample were analysed with ImageJ and GraphPad Prism (mean+/- SEM, n = 3). (b) RT qPCR analysis of HTRA2 and PRNP gene expression in 26 days old HTRA2KD HeLa cell populations. Reactions were carried out in triplicate and values were normalized with control BD650 HeLa cells (mean +/- SEM). Cells were transfected with pEBVsiHTRA2 plasmids displaying a high (HTRA2KD1, pBD3115 vector) or moderate (HTRAKD2, pBD3116 vector) gene silencing efficiency. For HTRA2 mRNA quantification, 2 sets of primers were used: primers 1 (pr1) detecting either total HTRA2 (short and long HTRA2 mRNA chains) and primers 2 (pr2) detecting only long chain. Primers are described in Table S4. (c) Western blot analysis of the HTRA2 protein content in stable knock down (HTRA2KD1) and knock out (HTRA2KO) HeLa clones. Protein equivalent to 105 cells were loaded onto a 10% PAGE. PrPc was revealed with both SHA31 and SAF32 antibodies. (d) Flow cytometry analysis of membrane-associated CD24, CD44, and PrPc in living HeLaKD cells 9 or 11 days after transfection in 2 independent culture experiments. Percentages correspond to the mean fluorescence intensity as compared to control. On the right of the panel d the loss of membrane-anchored PrPc was revealed after PrPc stainings in HTRA2KD1 cells as compared to CTL (scale bar 25 µm).
Fig. 7:
Fig. 7
Intracellular accumulation of PrPc in APPKD and APPKO HeLa cells. Characterization of different HeLaKD clones by: (a) Representative ICC stainings of HeLaKD clones stained for PrPc (SHA31 + SAF32 antibodies), or HTRA2, and counterstained with DAPI to visualize nuclei (scale bar 25 µm). 1632 individual cells in 4 to 7 fields per sample were analysed with ImageJ and GraphPad Prism (mean+/- SEM, n = 3). (b) Western blot was performed with protein extracted from 105 cells and were loaded onto a 10% PAGE. (c) For RT PCR, the used primers are indicated in Table S4. (d) CRISPR-Cas9-engineered HeLaKO cells were analysed by ICC stainings. Cells were stained and analysed as mentioned in panel a (scale bar 25 µm).
Fig. 8:
Fig. 8
Overexpression of HTRA2 enhances PrPc protein content. (a) Representative stainings of PrPc (SHA31 + SAF32 antibodies), HTRA2 and CD44 performed 10 days after transfection of PRNP or HTRA2 CDS in HeLa cells. Cells were counterstained with DAPI to visualize nuclei (scale bar 25 µm). 1399 individual cells in 5 to 8 fields per sample were analysed with ImageJ and GraphPad Prism (mean+/- SEM). (b) RT PCR analysis of HeLa cells, 52 days after transfection with either PRNP, APP695, HTRA2 or HTRA3 CDS. Primers used are indicated in Table S4. (c) Western blot analysis of HTRA2 and PrPc (SHA31 antibody) in HeLa cells silenced for HTRA2 (KD1 and KO) and overexpressing HTRA2 (HTRA2+). Cells were transfected with two different pEBVCAG-HTRA2 plasmids (1 means pBD3357; 2 means pBD3696). Proteins extracted from 105 cells were loaded onto a 10% PAGE. *: unspecific band. Plasmids were described in Table S3. Altered expression of membrane-associated CD24, CD44 and PrPc in living HTRA2+ HeLa cells. (d) 11 and (e) 14 days after transfection, living HeLa cells were stained for CD24, CD44 and PrPc and analysed by flow cytometry as indicated in M&M. PRNP+ and CD24+ cells are used as controls. Panels d and e represent two independent transfection experiments. Percentages correspond to the ΔΔMFI as compared to control.

References

    1. Lim S., Yoo B.K., Kim H.-.S., Gilmore H.L., Lee Y., Lee H., Kim S.-.J., Letterio J., Lee H. Amyloid-β precursor protein promotes cell proliferation and motility of advanced breast cancer. BMC Cancer. 2014;14:928. doi: 10.1186/1471-2407-14-928. - DOI - PMC - PubMed
    1. Wu X., Chen S., Lu C. Amyloid precursor protein promotes the migration and invasion of breast cancer cells by regulating the MAPK signaling pathway. Int. J. Mol. Med. 2020;45:162–174. doi: 10.3892/ijmm.2019.4404. - DOI - PMC - PubMed
    1. Mehrpour M., Codogno P. Prion protein: from physiology to cancer biology. Cancer Lett. 2010;290:1–23. doi: 10.1016/j.canlet.2009.07.009. - DOI - PubMed
    1. Prado M.B., Melo Escobar M.I., Alves R.N., Coelho B.P., de L. Fernandes C.F., Boccacino J.M., Iglesia R.P., Lopes M.H. Prion Protein at the Leading Edge: its Role in Cell Motility. Int. J. Mol. Sci. 2020;21 doi: 10.3390/ijms21186677. - DOI - PMC - PubMed
    1. Ryskalin L., Biagioni F., Busceti C.L., Giambelluca M.A., Morelli L., Frati A., Fornai F. The Role of Cellular Prion Protein in Promoting Stemness and Differentiation in Cancer. Cancers (Basel) 2021;13 doi: 10.3390/cancers13020170. - DOI - PMC - PubMed