

Molecular and functional properties of human Plasmodium falciparum CSP C-terminus antibodies
- PMID: 37082831
- PMCID: PMC10245032
- DOI: 10.15252/emmm.202317454
Molecular and functional properties of human Plasmodium falciparum CSP C-terminus antibodies
Abstract
Human monoclonal antibodies (mAbs) against the central repeat and junction domain of Plasmodium falciparum circumsporozoite protein (PfCSP) have been studied extensively to guide malaria vaccine design compared to antibodies against the PfCSP C terminus. Here, we describe the molecular characteristics and protective potential of 73 germline and mutated human mAbs against the highly immunogenic PfCSP C-terminal domain. Two mAbs recognized linear epitopes in the C-terminal linker with sequence similarity to repeat and junction motifs, whereas all others targeted conformational epitopes in the α-thrombospondin repeat (α-TSR) domain. Specificity for the polymorphic Th2R/Th3R but not the conserved RII+/CS.T3 region in the α-TSR was associated with IGHV3-21/IGVL3-21 or IGLV3-1 gene usage. Although the C terminus specific mAbs showed signs of more efficient affinity maturation and class-switching compared to anti-repeat mAbs, live sporozoite binding and inhibitory activity was limited to a single C-linker reactive mAb with cross-reactivity to the central repeat and junction. The data provide novel insights in the human anti-C-linker and anti-α-TSR antibody response that support exclusion of the PfCSP C terminus from malaria vaccine designs.
Keywords: Affinity maturation; Antibodies; Malaria; PfCSP; Plasmodium.
© 2023 The Authors. Published under the terms of the CC BY 4.0 license.
Conflict of interest statement
The authors declare the following competing interests: S.L.H is a salaried employee of Sanaria Inc. and has a financial interest in Sanaria Inc. All other authors declare no financial or commercial conflict of interest.
Figures
- A
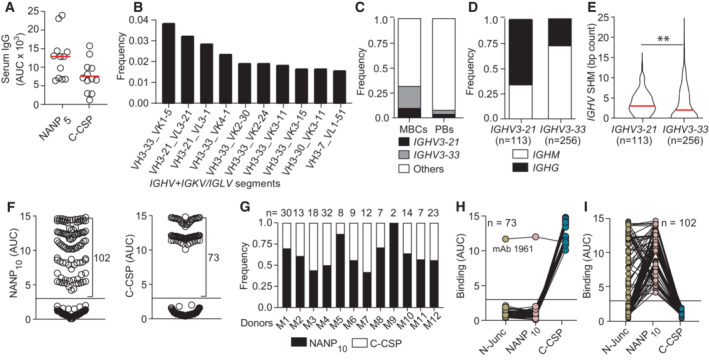
Anti‐NANP5 and anti‐C‐CSP serum IgG. Circles represent ELISA area under the curve (AUC) values for individual donors (n = 12).
- B
Ten most frequent Ig heavy and light chain V gene pairs in PfCSP‐reactive memory B cells (MBCs; n = 1,172).
- C
Usage frequency of IGHV3‐21, IGHV3‐33 and other IGHV genes in PfCSP‐reactive MBCs (n = 1,172) and plasmablasts (PBs; n = 2,380).
- D, E
Isotype distribution (D) and somatic hypermutation (SHM) count (E) in IGHV3‐21 and IGHV3‐33 genes from MBCs in (B, C).
- F
NANP10 (left) and C‐CSP (right) binding of FL‐CSP‐reactive mAbs (n = 177). Circles represent ELISA AUC values for each mAb.
- G
Frequency of NANP10 and C‐CSP reactive mAbs per donor. The number of tested mAbs is indicated.
- H, I
Cross‐reactivity of C‐CSP (H) and NANP10 (I) reactive mAbs with the PfCSP N‐junc, NANP10 and C‐CSP; n indicates the number of mAbs tested.
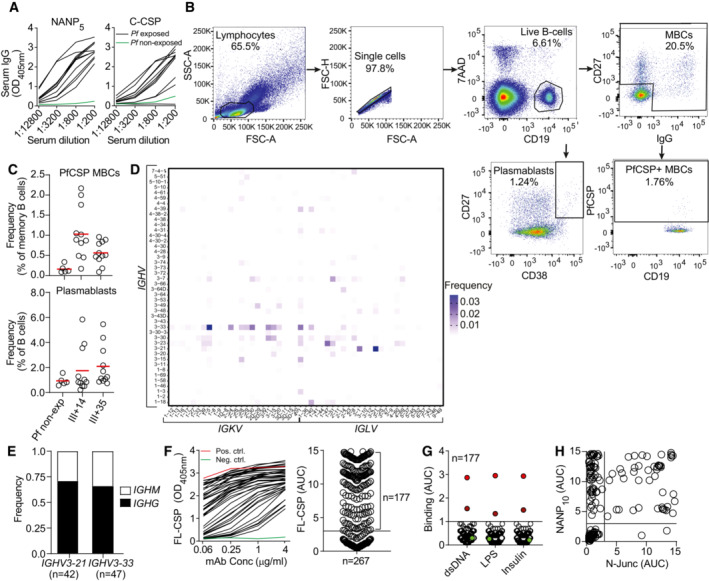
Representative ELISA curves of serum IgG reactivity against PfCSP‐derived NANP5 peptide and C‐CSP domain.
Flow‐cytometric single‐cell isolation strategy for PfCSP‐reactive memory B cells and plasmablasts from a representative immunized donor.
Frequency of PfCSP‐reactive memory B cells (upper panel) and plasmablasts (lower panel) in PBMCs of immunized donors at the indicated time points (III + 14 and III + 35) and non‐immunized donors (Pf non‐exp).
Paired Ig heavy and light chain V gene usage in PfCSP‐reactive memory B cells (n = 1,172).
Isotype distribution of IGHV3‐21‐ and IGHV3‐33‐encoded mAbs.
Representative ELISA curves of mAbs from PfCSP‐reactive memory B cells (black) or positive (red) and negative (green) control mAbs 2A10 (Triller et al, 2017) and mGO53 (Wardemann et al, 2003), respectively, binding to FL‐CSP (left) with corresponding AUC values (right; n = 267).
ELISA binding strength of FL‐CSP‐reactive mAbs to LPS, dsDNA or insulin compared to the highly polyreactive mAb ED38 (bright red; Meffre et al, 2004), weakly polyreactive mAb JB40 (dark red; Meffre et al, 2004), and the non‐polyreactive mAb mGO53 (green; Wardemann et al, 2003).
ELISA binding strength of FL‐CSP‐reactive mAbs to N‐Junc peptide vs NANP10.
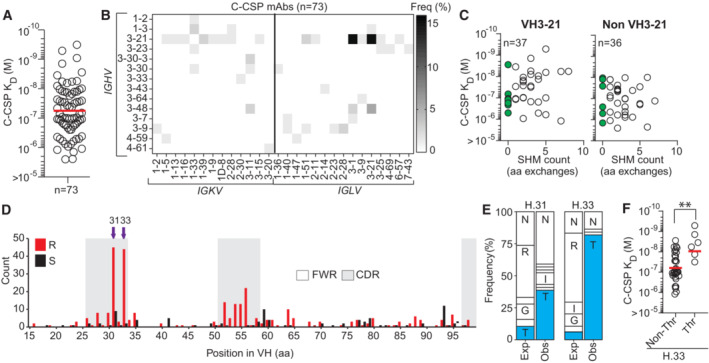
SPR affinity of C‐CSP reactive mAbs.
Frequency of mAbs encoded by the indicated IGHV and IGKV or IGLV pairs.
VH SHM load of VH3‐21 and non‐VH3‐21 mAbs. mAbs with unmutated VH are highlighted in green; n indicates the number of mAbs tested.
Amino acid (aa) VH replacement (red bars) and silent (black bars) SHM in VH3‐21 mAbs (n = 113). FWR, framework region; CDR, complementarity‐determining region.
Observed (Obs) aa usage frequency at position H.31 and H.33 in VH3‐21 mAbs carrying a replacement mutation at these positions compared to the expected (Exp) neutral mutation model (Yaari et al, ; Gupta et al, 2015). Single‐letters indicate aa residues: G, Gly; I, Ile; N, Asn; R, Arg; T, Thr.
C‐CSP affinity for selected VH3‐21 mAbs with or without Thr mutation at position H.33.
- A
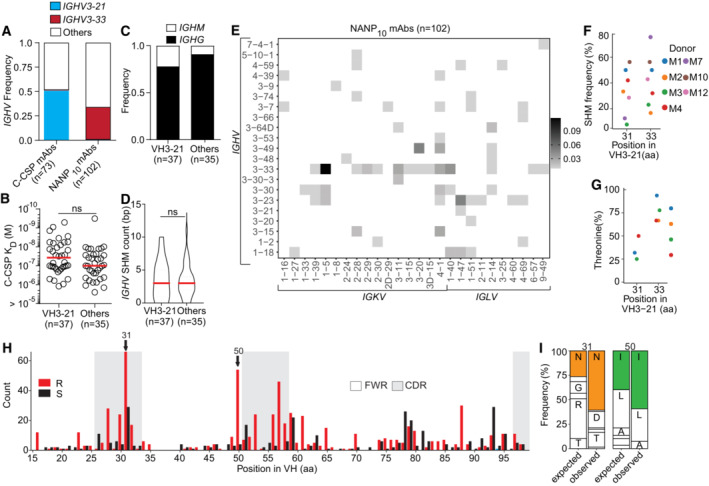
IGHV3‐21 or IGHV3‐33 gene frequency in C‐CSP‐ and NANP10‐reactive mAbs.
- B–D
Comparison of C‐CSP specific mAbs encoded by IGHV3‐21 and other IGHV genes. Anti‐C‐CSP SPR affinity (B), isotype distribution (C) and IGHV SHM count (D).
- E
Frequency of NANP10‐reactive mAbs encoded by the indicated IGHV + IGKV and IGHV + IGLV combinations (n = 102).
- F, G
Percentage of VH aa replacement SHM (F) and frequency of Thr at position H.31 and H.33 (G) in VH3‐21 mAbs at donor level.
- H
Amino acid (aa) VH replacement (red bars) and silent (black bars) SHM in VH3‐33 mAbs (n = 256). FWR, framework region; CDR, complementarity‐determining region.
- I
Observed (Obs) aa usage frequency at position H.31 and H.50 in VH3‐33 mAbs carrying a replacement mutation at these positions compared to the expected (Exp) neutral mutation model (Yaari et al, ; Gupta et al, 2015). Single‐letters indicate aa residues: A, Ala; D, Asp; G, Gly; I, Ile; L, Leu; N, Asn; R, Arg; T, Thr.
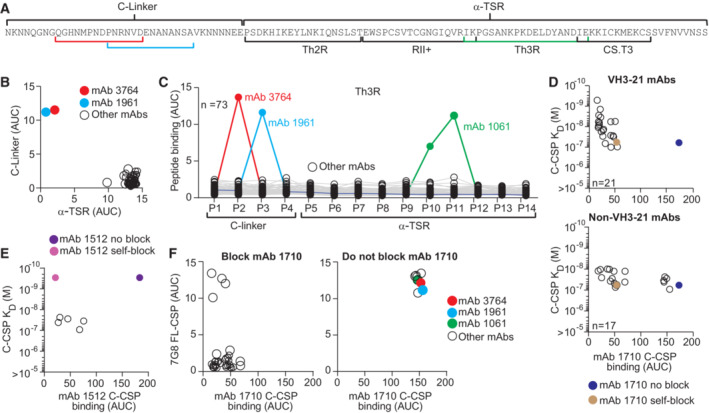
- A
NF54 PfCSP C‐CSP aa sequence. The C‐linker and α‐TSR domain with Th2R, RII+, Th3R and CS.T3 are indicated.
- B, C
ELISA reactivity of C‐CSP‐reactive mAbs (n = 73) with the C‐linker and α‐TSR domain (B) and overlapping C‐CSP peptides (P1‐P14; Appendix Table S1 for sequences) (C).
- D
C‐CSP reactivity of the α‐TSR‐specific mAb 1710 (Scally et al, 2018) in a blocking ELISA with C‐CSP specific VH3‐21 (n = 21; upper panel) or non‐VH3‐21 (n = 17; lower panel) mAbs with the indicated SPR affinities. mAb 1710 binding without blocking (blue) and after self‐blocking (gold) is shown for comparison.
- E
C‐CSP reactivity of mAb 1512 (Beutler et al, 2022) in a blocking ELISA with mAbs (with the indicated SPR affinities; open circles) that do not block C‐CSP binding of mAb 1710 (from D lower panel). mAb 1512 binding without blocking (purple) and after self‐blocking (magenta) is shown for comparison.
- F
ELISA cross‐reactivity with Pf‐7G8 FL‐CSP of CSP‐specific mAbs that block (left) or do not block (right) mAb 1710 binding to NF54 C‐CSP (D).
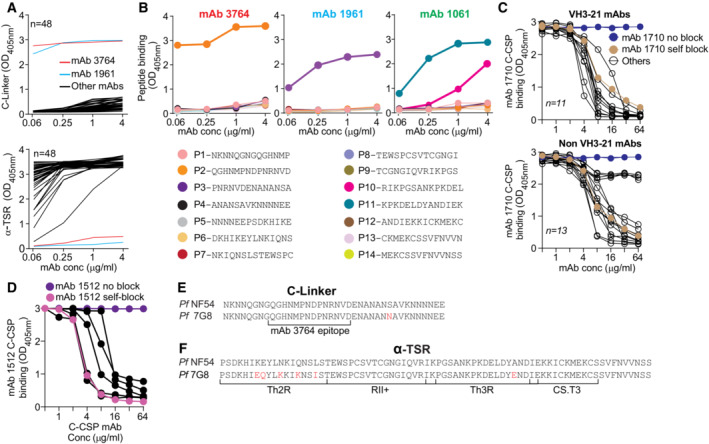
- A
Representative ELISA binding curves for all C‐CSP specific mAbs (black lines) to the C‐linker (upper panel) and α‐TSR (lower panel). The C‐linker specific mAb 3764 (red line) and C‐linker cross‐reactive mAb 1961 (light blue line) are highlighted.
- B
Representative ELISA binding curves to overlapping peptides (P1‐P14) covering the complete C‐CSP for mAb 3764 (left), mAb 1961 (middle) and mAb 1061 (right). Amino acid sequences of the peptides are indicated.
- C
Representative ELISA curves illustrating the ability of individual VH3‐21 (upper panel) and non‐VH3‐21 (lower panel) C‐CSP specific mAbs (black lines) to block binding of mAb 1710 (Scally et al, 2018) to C‐CSP. mAb 1710 C‐CSP binding without blocking (blue) and after self‐blocking (golden) is shown for comparison.
- D
ELISA curves showing C‐CSP reactivity of mAb 1512 (Beutler et al, 2022) in a blocking ELISA with mAbs that do not block C‐CSP binding of mAb 1710 (black). mAb 1512 binding without blocking (purple) and after self‐blocking (magenta) is shown for comparison.
- E, F
Alignment of the PfCSP NF54 and 7G8 C‐linker (E) and α‐TSR (F) aa sequences. Amino acids that differ are highlighted in red.
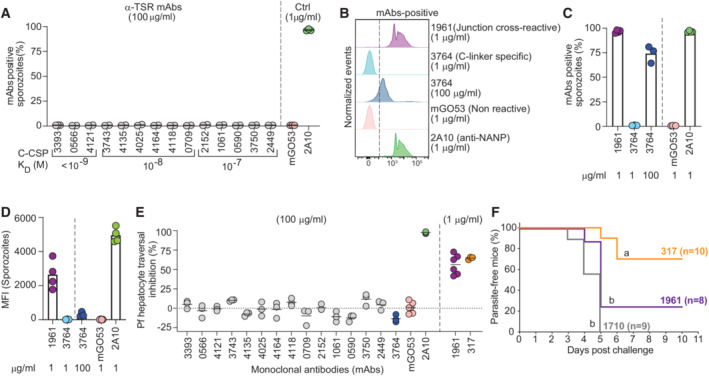
- A
Percent of live PbPfCSP(mCherry) sporozoites recognized by α‐TSR‐specific mAbs (100 μg/ml) as determined by flow cytometry, with the respective affinities measured by SPR. The positive control anti‐NANP mAb 2A10 (1 μg/ml; Triller et al, 2017) and negative control non‐PfCSP reactive mAb mGO53 (1 μg/ml; Wardemann et al, 2003) are shown for comparison (n = 2–3).
- B–D
Representative flow cytometry profiles (B), percentage of mAb‐positive live PbPfCSP(mCherry) sporozoites (C), and mean fluorescence intensity (MFI) (D) for the junction cross‐reactive mAb 1961, C‐linker‐specific mAb 3764 and the control mAbs 2A10 and mGO53 at the indicated concentrations (n = 3–4).
- E
Pf sporozoite hepatocyte traversal inhibitory capacity of the indicated C‐CSP reactive, C‐CSP cross‐reactive (1961), and control (2A10, mGO53 and anti‐NANP 317; Oyen et al, 2017) mAbs at the indicated concentrations (n = 3–6).
- F
Capacity of the indicated passively‐transferred antibodies (100 μg) to protect mice from parasitemia after the bite of three PbPfCSP(mCherry)‐infected mosquitoes (n = 10 for mAb 317; Oyen et al, , n = 8 for mAb 1961, and n = 9 for mAb 1710; Scally et al, 2018). Data show the percentage of parasite‐free mice in two independent experiments (only mice with detectable serum IgG concentrations of the indicated mAbs at the time of the challenge are shown; Fig EV4C). Groups marked with the same letter were not statistically significantly different (Mantel–Cox log‐rank test, see also Appendix Table S5).
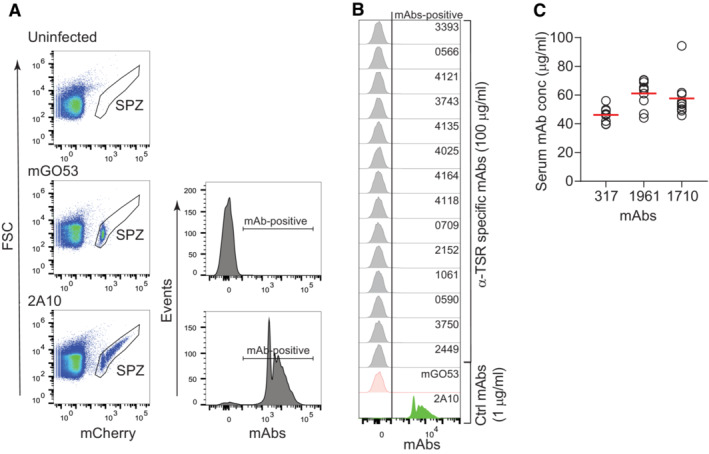
Flow cytometric gating strategy to analyze the proportion of mAb‐positive PbPfCSP(mCherry) live sporozoites. Live mCherry‐positive sporozoites (SPZ) were gated. Salivary gland extracts from uninfected mosquitoes were used as sporozoite gating control. The sporozoite binding profile of the negative control mAb mGO53 (Wardemann et al, 2003) and the positive control anti‐NANP mAb 2A10 (Triller et al, 2017) are shown for comparison.
Representative flow‐cytometric profiles of live PbPfCSP(mCherry) sporozoites recognized by α‐TSR‐specific mAbs (100 μg/ml) as determined by flow cytometry. The positive control anti‐NANP mAb 2A10 (1 μg/ml; Triller et al, 2017) and negative control non‐PfCSP reactive mAb mGO53 (1 μg/ml; Wardemann et al, 2003) are shown for comparison.
mAb serum concentrations in individual mice (n = 10 for mAb 317, n = 8 for mAb 1961, and n = 9 for mAb 1710) after passive transfer of the indicated monoclonal antibodies. The data in C only included mice that had detectable serum IgG concentrations of the indicated mAbs at the time of the challenge.
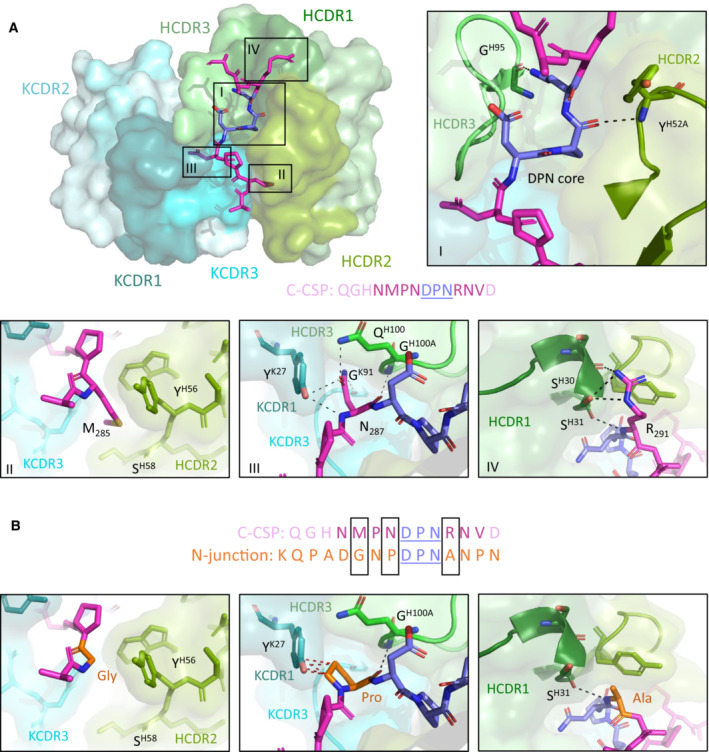
Crystal structure showing the variable regions of the C‐linker specific mAb 3764 and P2, with the mAb 3764 heavy chain illustrated in green and the kappa chain in blue. HCDR1, 2 and 3 (dark, pea and light green, respectively) as well as KCDR1 and 3 (dark teal and aqua, respectively) contribute to epitope recognition, but KCDR2 (teal) does not. The central DPN core (deep blue) of the C‐CSP peptide (magenta) interacts with HCDR2 and 3 similarly to other VH3‐33 antibodies (inset I), forming hydrogen bonds (H‐bonds, shown with black dotted lines) with HCDR2 and 3. C‐CSP residues M285 (inset II), N287 (inset III) and R291 (inset IV) contribute substantial buried surface area (BSA) to the complex. (II) M285 does not contribute any H‐bonds, but does contribute to BSA. N287 (III) and R291 (IV) are responsible for hydrogen bonding with HCDR3, KCDR1 and KCDR3, and with HCDR1, respectively.
Despite significant sequence similarity in the region of the DPN core between the C‐CSP peptide and the N‐junction peptide (sequence shown in orange), mAb 3764 does not bind to the N‐junction peptide. Molecular modeling replacing M285, N287 and R291 with Gly, Pro and Ala, respectively, reveals these alternate residues would result in a loss of hydrogen bonds, and reduced BSA and introduction of steric clashes (shown with red dotted lines).
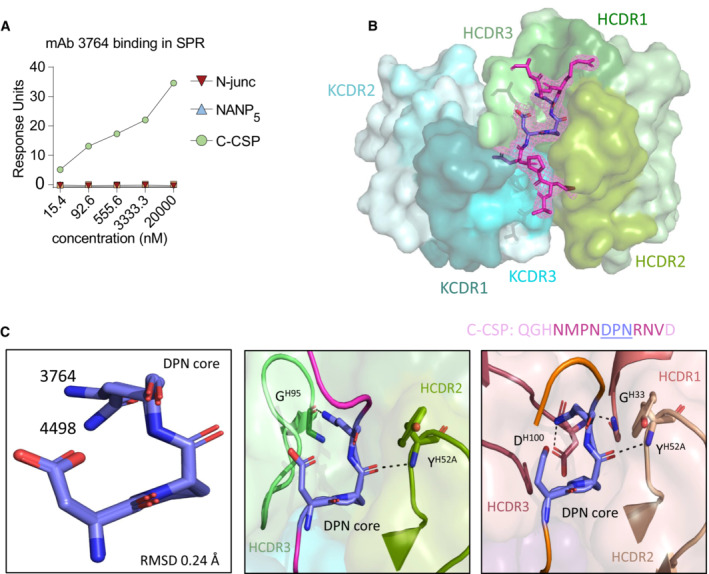
mAb 3764 SPR affinity measurement against peptides covering the N‐term junction (N‐Junc), NANP5 or C‐CSP at various concentrations.
Composite omit map electron density contoured at 1 σ (light magenta mesh) around the C‐CSP peptide (magenta).
(Left) Superposition of the DPN core (deep blue) in crystal structures of mAb 3764 bound to the indicated C‐CSP peptide (magenta) and mAb 4498 (Murugan et al, 2020) bound to the NDN3 peptide (orange) (PDB ID: 6ULF). (Middle) mAb 3764 HCDR2 and 3 (pea and light green, respectively) are shown interacting with the C‐CSP peptide. (Right) mAb 4498 HCDR1, 2, and 3 (dark salmon, raspberry and wheat, respectively) are shown interacting with NDN3.
Comment in
-
A sting in the tail-are antibodies against the C-terminus of Plasmodium falciparum circumsporozoite protein protective?EMBO Mol Med. 2023 Jun 7;15(6):e17556. doi: 10.15252/emmm.202317556. Epub 2023 Apr 21. EMBO Mol Med. 2023. PMID: 37082835 Free PMC article.
References
-
- Agnandji ST, Lell B, Soulanoudjingar SS, Fernandes JF, Abossolo BP, Conzelmann C, Methogo BG, Doucka Y, Flamen A, Mordmuller B et al (2011) First results of phase 3 trial of RTS,S/AS01 malaria vaccine in African children. N Engl J Med 365: 1863–1875 - PubMed
-
- Asante KP, Abdulla S, Agnandji S, Lyimo J, Vekemans J, Soulanoudjingar S, Owusu R, Shomari M, Leach A, Jongert E et al (2011) Safety and efficacy of the RTS,S/AS01E candidate malaria vaccine given with expanded‐programme‐on‐immunisation vaccines: 19 month follow‐up of a randomised, open‐label, phase 2 trial. Lancet Infect Dis 11: 741–749 - PubMed
Publication types
MeSH terms
Substances
Associated data
- Actions
- Actions
Grants and funding
LinkOut - more resources
Full Text Sources
Research Materials
