. 2023 Jul;114(7):3003-3013.
doi: 10.1111/cas.15817. Epub 2023 Apr 21.

Association of frequent hypermethylation with high grade histological subtype in lung adenocarcinoma

Affiliations

Association of frequent hypermethylation with high grade histological subtype in lung adenocarcinoma

Yuki Ito et al. Cancer Sci. 2023 Jul.

Abstract

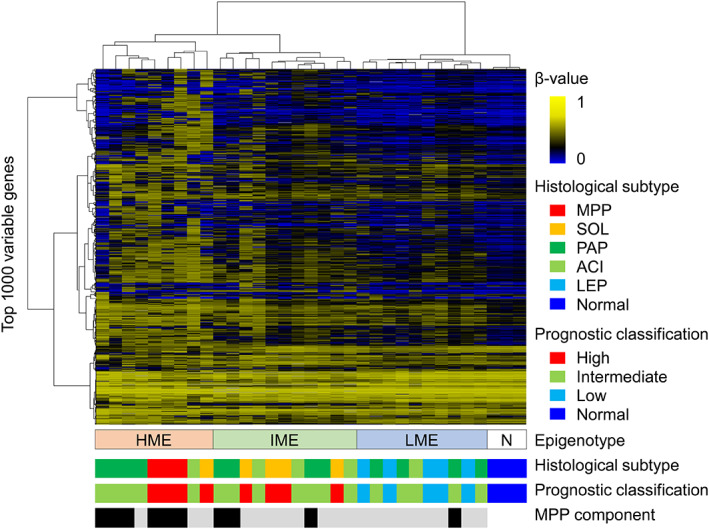
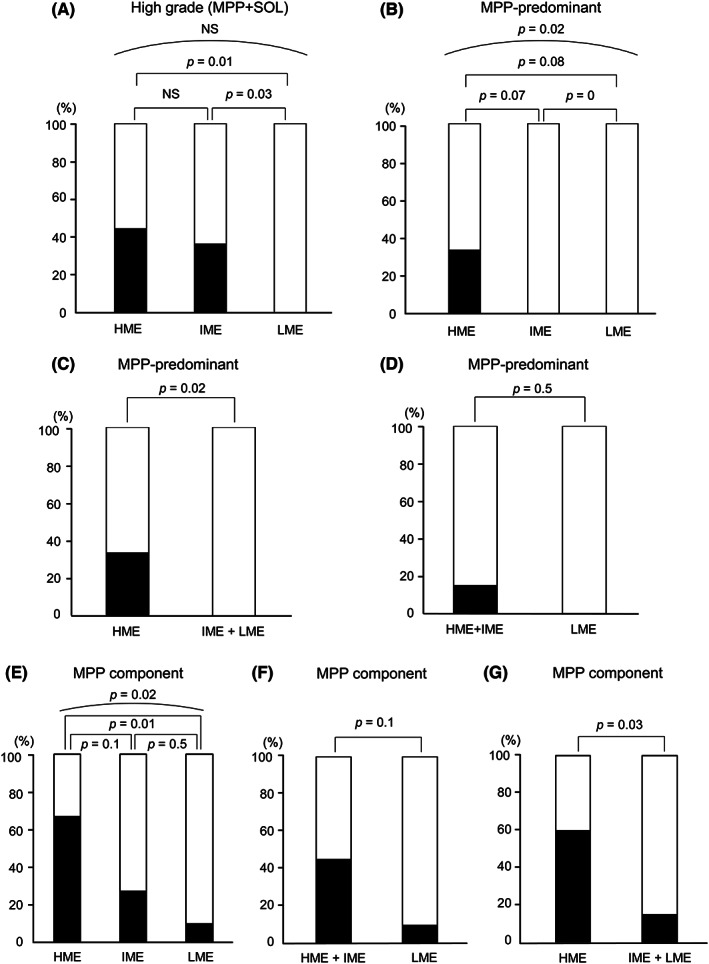
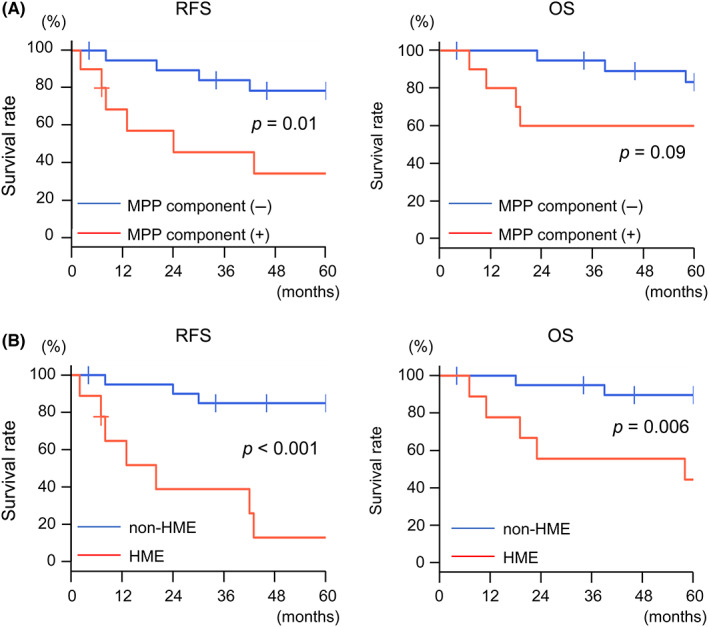
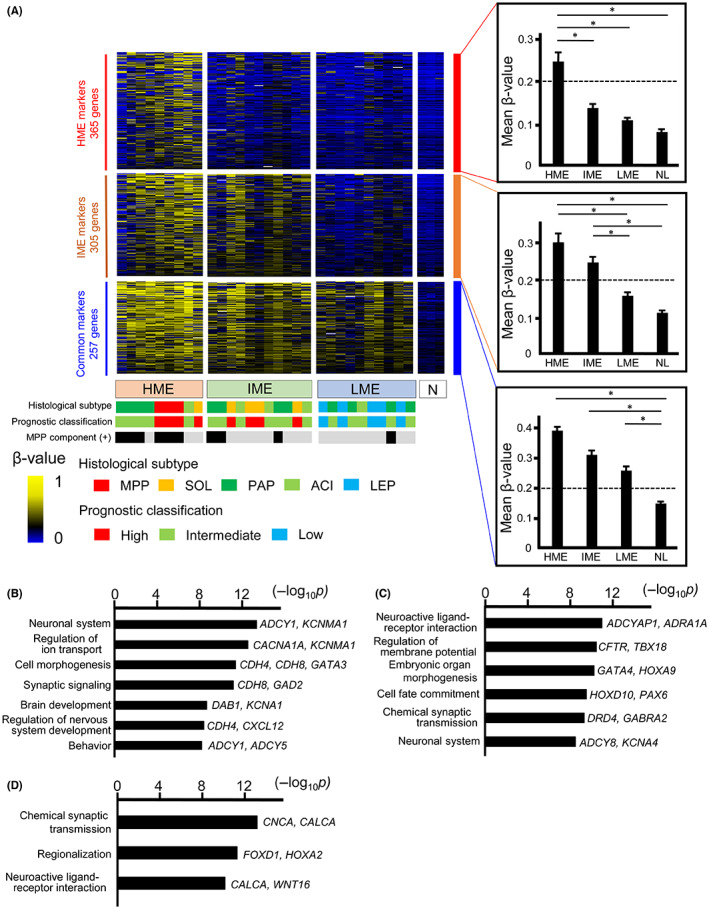
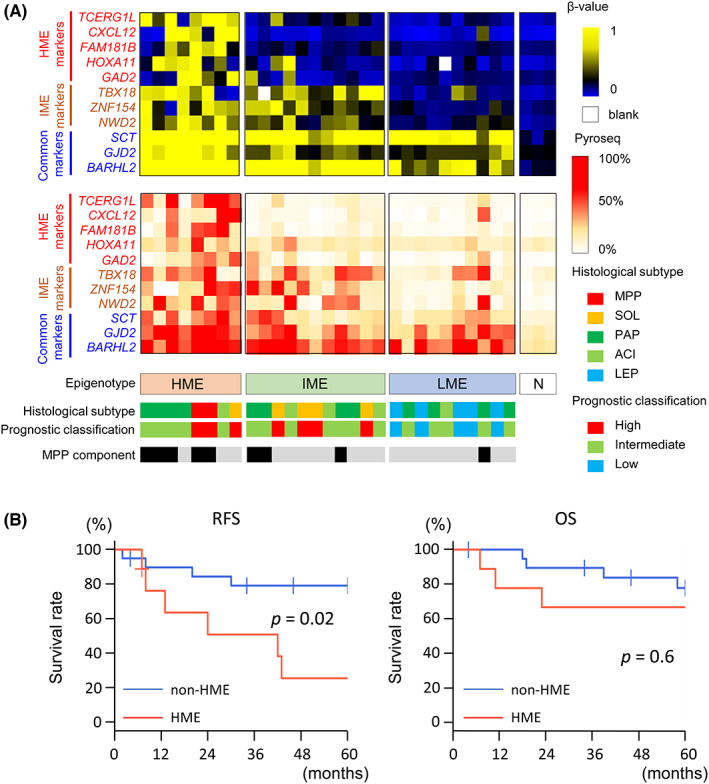
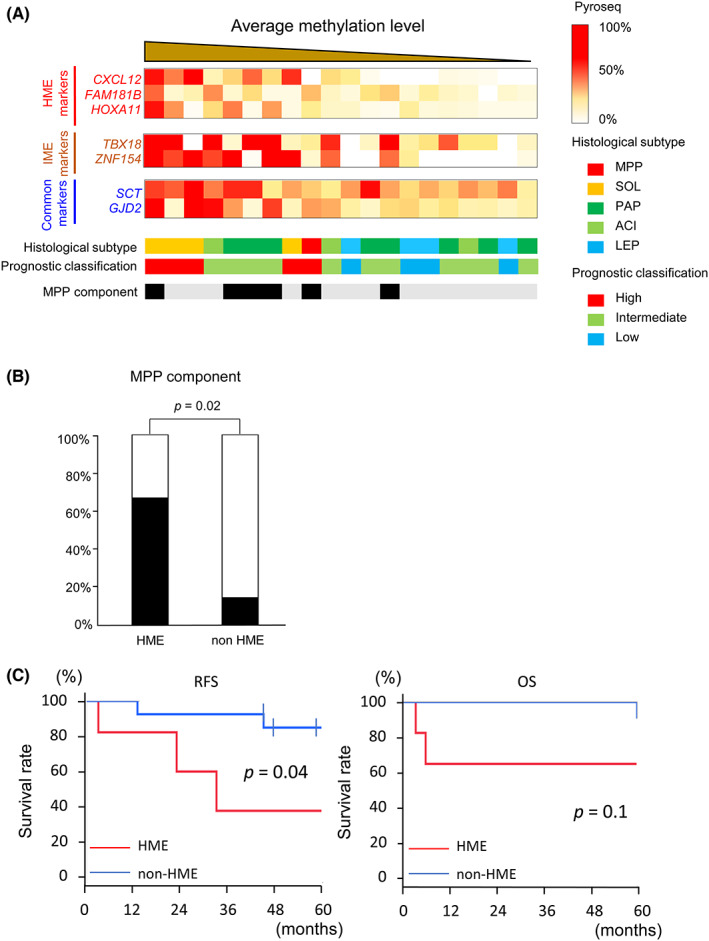
Lung adenocarcinoma is classified morphologically into five histological subtypes according to the WHO classification. While each histological subtype correlates with a distinct prognosis, the molecular basis has not been fully elucidated. Here we conducted DNA methylation analysis of 30 lung adenocarcinoma cases annotated with the predominant histological subtypes and three normal lung cases using the Infinium BeadChip. Unsupervised hierarchical clustering analysis revealed three subgroups with different methylation levels: high-, intermediate-, and low-methylation epigenotypes (HME, IME, and LME). Micropapillary pattern (MPP)-predominant cases and those with MPP components were significantly enriched in HME (p = 0.02 and p = 0.03, respectively). HME cases showed a significantly poor prognosis for recurrence-free survival (p < 0.001) and overall survival (p = 0.006). We identified 365 HME marker genes specifically hypermethylated in HME cases with enrichment of "cell morphogenesis" related genes; 305 IME marker genes hypermethylated in HME and IME, but not in LME, with enrichment "embryonic organ morphogenesis"-related genes; 257 Common marker genes hypermethylated commonly in all cancer cases, with enrichment of "regionalization"-related genes. We extracted surrogate markers for each epigenotype and designed pyrosequencing primers for five HME markers (TCERG1L, CXCL12, FAM181B, HOXA11, GAD2), three IME markers (TBX18, ZNF154, NWD2) and three Common markers (SCT, GJD2, BARHL2). DNA methylation profiling using Infinium data was validated by pyrosequencing, and HME cases defined by pyrosequencing results also showed the worse recurrence-free survival. In conclusion, lung adenocarcinomas are stratified into subtypes with distinct DNA methylation levels, and the high-methylation subtype correlated with MPP-predominant cases and those with MPP components and showed a poor prognosis.

Keywords: DNA methylation; high-grade subtype; histological subtype; lung adenocarcinoma; micropapillary component.


Conflict of interest statement

A.K. is an Associate Editor of Cancer Science, and all other authors have no conflict of interest.

Figures

FIGURE 1
FIGURE 1
Infinium analysis of lung adenocarcinoma samples and normal lung tissues. Unsupervised two‐way hierarchical clustering was performed based on Infinium methylation data using the β‐values of the top 1000 genes with the largest difference in standard deviation in 30 LUAD samples and three control normal lung tissues (top). Histological subtypes annotated with predominant subtype, prognostic classification (MPP + SOL; High‐grade, PAP + ACI; Intermediate grade, LEP; Low grade) and cases containing MPP component (black bar) are shown (bottom). LUAD samples are suggested to be classified into three major clusters as high‐methylation epigenotype (HME), intermediate methylation epigenotype (IME) and low‐methylation epigenotype (LME).
FIGURE 2
FIGURE 2
Correlation between histological subtypes and epigenotypes. (A) Proportion of high‐grade tumors of prognostic classification (MPP and SOL) in HME, IME, and LME, respectively. The p‐values comparing the three epigenotypes by Kruskal–Wallis test (top) or each two of three epigenotypes by Student's t‐test (middle) are also shown. (B–D) Proportion of MPP‐predominant cases (n = 3) in each epigenotype. (E–G) Proportion of cases with MPP components in each epigenotype.
FIGURE 3
FIGURE 3
Correlation of clinicopathologic features and epigenotypes with prognosis. Kaplan–Meier curves of recurrence‐free survival (RFS) and overall survival (OS). p‐values were calculated using Fisher's exact test. (A) Cases containing MPP component significantly correlated with worse prognosis in RFS (left, p = 0.02), while a significant difference was not detected in OS (right, p = 0.09). (B) HME cases significantly correlated worse outcome compared with non‐HME cases both in RFS (p < 0.001) and in OS (p = 0.006).
FIGURE 4
FIGURE 4
Genes with different methylation levels between samples of each epigenotype and normal lung tissues. (A) Mean β‐values were calculated for each epigenotype. Mean β‐value >0.2 was considered hypermethylation, and DNA methylation marker genes that characterized each epigenotype were extracted. Genes hypermethylated specifically in HME (n = 365) were defined as HME markers. The mean β‐value of HME markers in HME was significantly higher than in the non‐HME subgroup (right top). Genes hypermethylated specifically in HME and IME (n = 305) were defined as IME markers. The mean β‐value of IME markers in HME and IME was significantly higher than in the LME and normal lung tissues (right middle). Genes hypermethylated specifically in LUAD (n = 257) were defined as Common markers. The mean β‐value of Common markers in LUAD was significantly higher than in normal lung tissues (right bottom). *p < 0.01, NL; normal lung tissues. (B–D) GO analysis in HME (B), IME (C), and LME markers (D). GO terms for significantly enriched categories are indicated on the left, and representative genes in each category are indicated on the right.
FIGURE 5
FIGURE 5
Validation of DNA methylation by pyrosequencing. (A) The methylation status of surrogate marker genes (five HME markers, three IME markers and three Common markers) analyzed by Infinium for LUAD samples and normal lung tissues are shown on the color scale (top). The methylation levels of the CpG cite targeted by Infinium probe and several surrounding CpG cites analyzed quantitatively by pyrosequencing are shown on color scale (bottom). Infinium methylation data for each surrogate marker genes were well validated by pyrosequencing. (B) Kaplan–Meier curves of recurrence‐free survival (RFS) and overall survival (OS). p‐values were calculated using Fisher's exact test. HME cases defined using pyrosequencing results showed significantly worse outcomes compared with non‐HME cases in RFS (p = 0.02), but were not significant in OS (p = 0.6).
FIGURE 6
FIGURE 6
Validation by pyrosequencing with additional LUAD samples. (A) The methylation status of marker genes by pyrosequencing for the additional 20 LUAD samples. Cases with a MPP component showed higher methylation levels. (B) Proportion of cases with MPP components in each epigenotype. HME was defined as DNA methylation levels ≥20% in ≥2 of the three HME markers, and p‐values were calculated by Student's t‐test. Cases with MPP components were observed to be significant frequently in HME (p = 0.02). (C) Kaplan–Meier curves of recurrence‐free survival (RFS) and overall survival (OS). p‐values were calculated using Fisher's exact test. HME cases showed significantly worse outcome compared with non‐HME cases in RFS (p = 0.04), but not in OS (p = 0.1).

Similar articles

Cited by

References

    1. Ferlay J, Colombet M, Soerjomataram I, et al. Estimating the global cancer incidence and mortality in 2018: GLOBCAN sources and methods. Int J Cancer. 2019;144:1941‐1953. - PubMed
    1. Travis WD, Brambilla E, Noguchi M, et al. International association for the study of lung cancer/american thoracic society/european respiratory society international multidisciplinary classification of lung adenocarcinoma. J Thorac Oncol. 2011;6:244‐285. - PMC - PubMed
    1. Travis WD, Brambilla E, Burke A. WHO Classification of the Tumours of the Lung, Pleura, Thymus and Heart (eds 4). IARC Press; 2015. - PubMed
    1. Warth A, Muley T, Meister M, et al. The novel histologic International Association for the Study of Lung Cancer/American Thoracic Society/European Respiratory Society classification system of lung adenocarcinoma is a stage‐independent predictor of survival. J Clin Oncol. 2012;3013:1438‐1446. - PubMed
    1. Tsao MS, Marguet S, Le Teuff G, et al. Subtype classification of lung adenocarcinoma predicts benefit from adjuvant chemotherapy in patients undergoing complete resection. J Clin Oncol. 2015;33:3439‐3446. - PMC - PubMed