Review
. 2023 Jun 6;52(11):3741-3777.
doi: 10.1039/d3cs00147d.

Carbon monoxide separation: past, present and future

Affiliations
Review

Carbon monoxide separation: past, present and future

Xiaozhou Ma et al. Chem Soc Rev. .

Abstract

Large amounts of carbon monoxide are produced by industrial processes such as biomass gasification and steel manufacturing. The CO present in vent streams is often burnt, this produces a large amount of CO2, e.g., oxidation of CO from metallurgic flue gasses is solely responsible for 2.7% of manmade CO2 emissions. The separation of N2 from CO due to their very similar physical properties is very challenging, meaning that numerous energy-intensive steps are required for CO separation, making the CO separation from many process streams uneconomical in spite of CO being a valuable building block in the production of major chemicals through C1 chemistry and the production of linear hydrocarbons by the Fischer-Tropsch process. The development of suitable processes for the separation of carbon monoxide has both industrial and environmental significance. Especially since CO is a main product of electrocatalytic CO2 reduction, an emerging sustainable technology to enable carbon neutrality. This technology also requires an energy-efficient separation process. Therefore, there is a great need to develop energy efficient CO separation processes adequate for these different process streams. As such the urgency of separating carbon monoxide is gaining greater recognition, with research in the field becoming more and more crucial. This review details the principles on which CO separation is based and provides an overview of currently commercialised CO separation processes and their limitations. Adsorption is identified as a technology with the potential for CO separation with high selectivity and energy efficiency. We review the research efforts, mainly seen in the last decades, in developing new materials for CO separation via ad/bsorption and membrane technology. We have geared our review to both traditional CO sources and emerging CO sources, including CO production from CO2 conversion. To that end, a variety of emerging processes as potential CO2-to-CO technologies are discussed and, specifically, the need for CO capture after electrochemical CO2 reduction is highlighted, which is still underexposed in the available literature. Altogether, we aim to highlight the knowledge gaps that could guide future research to improve CO separation performance for industrial implementation.


Conflict of interest statement

There are no conflicts to declare.

Figures

Fig. 1
Fig. 1. The utilisation of CO in chemical industry.
Fig. 2
Fig. 2. Electronic structure of CO and its binding scheme with transition metals. The π-backbonding occurs due to the donation of d-orbital electrons to the π*-orbitals of CO, πx* and πy*. Reprinted from ref. , Copyright (2019) with permission from Elsevier.
Fig. 3
Fig. 3. Schematic of the spin crossover effect caused by the adsorption of CO onto unsaturated octahedral d6 metal sites. Figure reprinted from ref. with modifications with permission from Springer Nature, copyright 2015.
Fig. 4
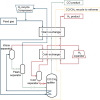
Fig. 4. Low-temperature partial condensation process. Figure based on process scheme from Dutta et al.
Fig. 5
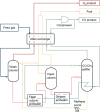
Fig. 5. The liquid methane wash process. Figure based on process scheme from Dutta et al.
Fig. 6
Fig. 6. The basic COSORB process. Figure based on process scheme presented in Keller et al.
Fig. 7
Fig. 7. General overview of the COPISA process.
Fig. 8
Fig. 8. Structures of M-MOF-74 determined by neutron diffraction. Top left: View along the c-axis of Fe-MOF-74·1.5 CO, corresponding with 75% loading. Top right: Coordination environment of Fe-MOF-74·1.5 CO Bottom: First coordination sphere of the M2+-ions in M-MOF-74·1.5 CO. M–CO distance and M–C–O angles are indicated. Reprinted with permission from ref. . Copyright 2014 American Chemical Society.
Fig. 9
Fig. 9. General structure of an M2+–M2+ paddlewheel. Reprinted with permission from ref. . Copyright 2008 American Chemical Society.
Fig. 10
Fig. 10. N2 and CO adsorption isotherms and coinciding PXRD measurements. (A) N2 adsorption isotherm at 120 K. (B) PXRD patterns of the measurement points indicated in A (a–d), with the simulated pattern of dried Cu-aip on the bottom. (C) CO adsorption (•) and desorption (°) isotherms at 120 K. (D) PXRD patterns of the measurement points indicated in A (a–j), with the simulated pattern of dried Cu-aip on the bottom and CO adsorbed Cu-aip at the top. From ref. . Reprinted with permission from AAAS.
Fig. 11
Fig. 11. (a and b) Schematic of how working capacity is increased due to the sigmoidal adsorption curve caused by the spin crossover; (c) schematic view of the mechanism of the spin crossover in Fe2Cl2(bbta) due to the adsorption of CO. Colour code of the atoms in the structures shown: Fe (yellow), Cl (green), N (blue), C (grey), O (red). Reprinted by permission from Springer Nature, copyright 2017.
Fig. 12
Fig. 12. Plot of CO/N2 selectivity versus CO permeance for various membranes. Star symbols (*) represent ref. . The blue triangle represents ref. , the other symbols represent ref. , , and . Reprinted from ref. , Copyright (2021) with permission from Elsevier.
Fig. 13
Fig. 13. Schematic of emerging processes utilising renewable energy for the conversion of carbon dioxide enabling the development of carbon-neutral cycles.
Fig. 14
Fig. 14. Direct CO2 to CO conversion (left), in this case in a reactor with a liquid anode (zero-gap) and CO2 reduction at the vapour-fed cathode, and indirect CO2 conversion (right), via water electrolysis and Reverse Gas–Water Shift Reaction (RGWSR). For simplicity, reaction stoichiometry is ignored.
Fig. 15
Fig. 15. Faradaic efficiency of products for various inlet flow rates performed at a current density of 200 mA cm−2. (b) CO2 utilisation and CO2 consumption for different inlet flow rates at 200 mA cm−2. Greyed regions represent trade-offs between utilisation and selectivity. CO2 consumption is always higher than CO2 utilisation because CO2 is crossing over to the analyte. Reproduced from ref. with permission from the Royal Society of Chemistry, copyright 2021.
None
Top to bottom, left to right: Rens Horst, Casper Snoeks, Hüseyin Burak Eral, Bastian Mei; Xiaozhou Ma, Jelco Albertsma, Sissi de Beer, Monique Ann van der Veen; Dieke Gabriels, Sevgi Polat, Freek Kapteijn, David Vermaas

References

    1. Wall D. Kepplinger W. Millner R. Steel Res. Int. 2011;82:926–933. doi: 10.1002/srin.201100030. - DOI
    1. Djenane D. and Roncalés P., Carbon monoxide in meat and fish packaging: advantages and limits, 2018 - PMC - PubMed
    1. Romão C. C. Blättler W. A. Seixas J. D. Bernardes G. J. Chem. Soc. Rev. 2012;41:3571–3583. doi: 10.1039/C2CS15317C. - DOI - PubMed
    1. Siracusa R., Schaufler A., Calabrese V., Fuller P. M. and Otterbein L. E., Carbon Monoxide: from Poison to Clinical Trials, 2021 - PMC - PubMed
    1. Bierhals J., Ullmann's Encyclopedia of Industrial Chemistry, Wiley-VCH Verlag GmbH & Co. KGaA, Weinheim, Germany, 2001