

Autophagy-Activated Self-reporting Photosensitizer Promoting Cell Mortality in Cancer Starvation Therapy
- PMID: 37083241
- PMCID: PMC10288242
- DOI: 10.1002/advs.202301295
Autophagy-Activated Self-reporting Photosensitizer Promoting Cell Mortality in Cancer Starvation Therapy
Abstract
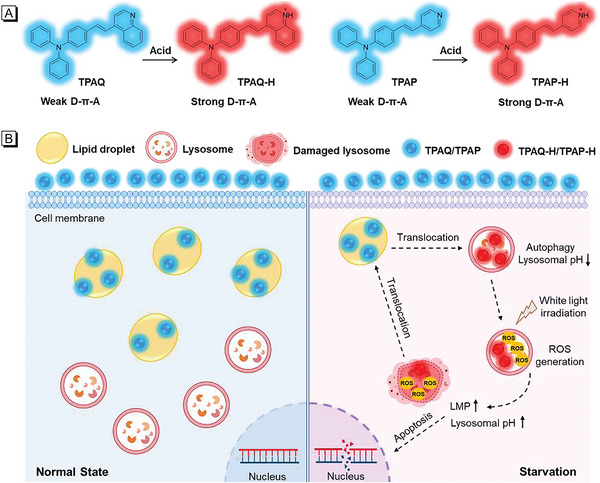
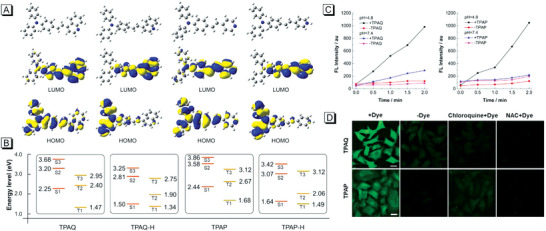
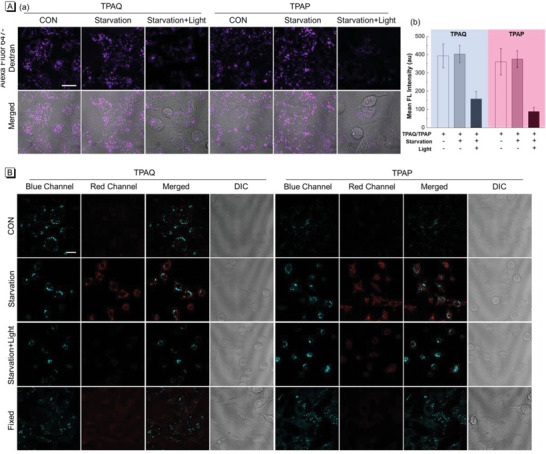
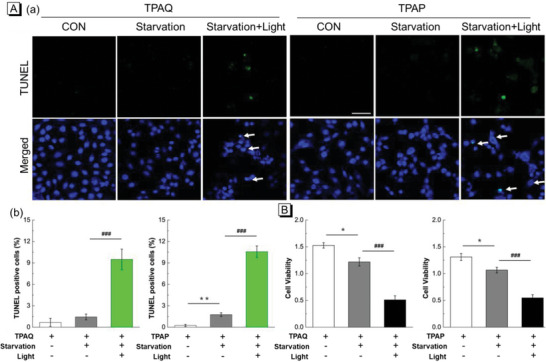
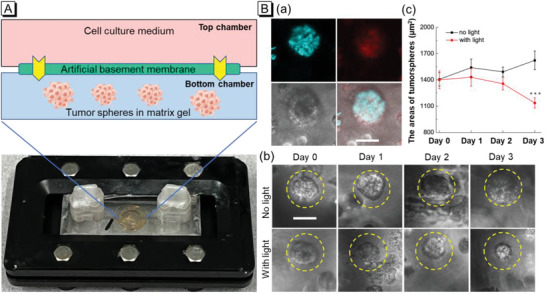
Cancer starvation therapy have received continuous attention as an efficient method to fight against wide-spectrum cancer. However, during cancer starvation therapy, the protective autophagy promotes cancer cells survival, compromising the therapeutic effect. Herein, a novel strategy by combination of autophagy-activated fluorescent photosensitizers (PSs) and cancer starvation therapy to realize the controllable and efficient ablation of tumor is conceived. Two dual-emissive self-reporting aggregation-induced emission luminogens (AIEgens), TPAQ and TPAP, with autophagy-activated reactive oxygen species (ROS) generation are prepared to fight against the protective autophagy in cancer starvation therapy. When protective autophagy occurs, a portion of TPAQ and TPAP will translocate from lipid droplets to acidic lysosomes with significant redshift in fluorescence emission and enhanced ROS generation ability. The accumulation of ROS induced by TPAQ-H and TPAP-H causes lysosomal membrane permeabilization (LMP), which further results in cell apoptosis and promotes cell death. In addition, TPAQ and TPAP can enable the real-time self-reporting to cell autophagy and cell death process by observing the change of red-emissive fluorescence signals. Particularly, the efficient ablation of tumor via the combination of cancer starvation therapy and photodynamic therapy (PDT) induced by TPAQ has been successfully confirmed in 3D tumor spheroid chip, suggesting the validation of this strategy.
Keywords: 3D tumor spheroid chip; autophagy-activated photosensitizer; cancer starvation therapy; dual-emissive self-reporting AIEgen; photodynamic therapy.
© 2023 The Authors. Advanced Science published by Wiley-VCH GmbH.
Conflict of interest statement
The authors declare no conflict of interest.
Figures
Similar articles
-
Cancer-cell-specific Self-Reporting Photosensitizer for Precise Identification and Ablation of Cancer Cells.Anal Chem. 2024 Jan 30;96(4):1659-1667. doi: 10.1021/acs.analchem.3c04578. Epub 2024 Jan 18. Anal Chem. 2024. PMID: 38238102
-
Dual-Functional AIE Fluorescent Probe for Visualization of Lipid Droplets and Photodynamic Therapy of Cancer.Anal Chem. 2024 Apr 9;96(14):5615-5624. doi: 10.1021/acs.analchem.4c00227. Epub 2024 Mar 27. Anal Chem. 2024. PMID: 38544396
-
Red/NIR emissive aggregation-induced emission-active photosensitizers with strong donor-acceptor strength for image-guided photodynamic therapy of cancer.Luminescence. 2023 Dec;38(12):2086-2094. doi: 10.1002/bio.4599. Epub 2023 Oct 13. Luminescence. 2023. PMID: 37740529
-
Anion-π+ AIEgens for Fluorescence Imaging and Photodynamic Therapy.Chemistry. 2024 May 14;30(27):e202400378. doi: 10.1002/chem.202400378. Epub 2024 Mar 14. Chemistry. 2024. PMID: 38418406 Review.
-
Aggregation-Induced Emission Luminogens for Enhanced Photodynamic Therapy: From Organelle Targeting to Tumor Targeting.Biosensors (Basel). 2022 Nov 16;12(11):1027. doi: 10.3390/bios12111027. Biosensors (Basel). 2022. PMID: 36421144 Free PMC article. Review.
Cited by
-
Advanced materials for cancer treatment and beyond.Front Pharmacol. 2025 Mar 5;16:1557155. doi: 10.3389/fphar.2025.1557155. eCollection 2025. Front Pharmacol. 2025. PMID: 40110134 Free PMC article. Review.
-
A singular plasmonic-thermoelectric hollow nanostructure inducing apoptosis and cuproptosis for catalytic cancer therapy.Nat Commun. 2024 Aug 29;15(1):7499. doi: 10.1038/s41467-024-51772-1. Nat Commun. 2024. PMID: 39209877 Free PMC article.
-
Glucose dysregulation promotes oncogenesis in human bladder cancer by regulating autophagy and YAP1/TAZ expression.J Cell Mol Med. 2023 Dec;27(23):3744-3759. doi: 10.1111/jcmm.17943. Epub 2023 Sep 4. J Cell Mol Med. 2023. PMID: 37665055 Free PMC article.
-
Activity-Based Dicyanoisophorone Derivatives: Fluorogenic Toolbox Enables Direct Visualization and Monitoring of Esterase Activity in Tumor Models.Anal Chem. 2024 Nov 12;96(45):18278-18286. doi: 10.1021/acs.analchem.4c04721. Epub 2024 Nov 1. Anal Chem. 2024. PMID: 39483052 Free PMC article.
-
Rational Design of Biocompatible Ir(III) Photosensitizer to Overcome Drug-Resistant Cancer via Oxidative Autophagy Inhibition.Adv Sci (Weinh). 2025 Jan;12(2):e2407236. doi: 10.1002/advs.202407236. Epub 2024 Nov 14. Adv Sci (Weinh). 2025. PMID: 39540573 Free PMC article.
References
Publication types
MeSH terms
Substances
Grants and funding
- 22105020/National Natural Science Foundation of China
- 22005028/National Natural Science Foundation of China
- XSQD-202123005/Beijing Institute of Technology Research Fund Program for Young Scholars
- XSQD-202023002/Beijing Institute of Technology Research Fund Program for Young Scholars
- ZDSYS20211021111400001/Shenzhen Key Laboratory of Functional Aggregate Materials
LinkOut - more resources
Full Text Sources
Medical