. 2023 Apr 21;8(82):eadd8454.
doi: 10.1126/sciimmunol.add8454. Epub 2023 Apr 21.

Tissue-resident memory T cell maintenance during antigen persistence requires both cognate antigen and interleukin-15

Affiliations

Tissue-resident memory T cell maintenance during antigen persistence requires both cognate antigen and interleukin-15

Roger Tieu et al. Sci Immunol. .

Abstract

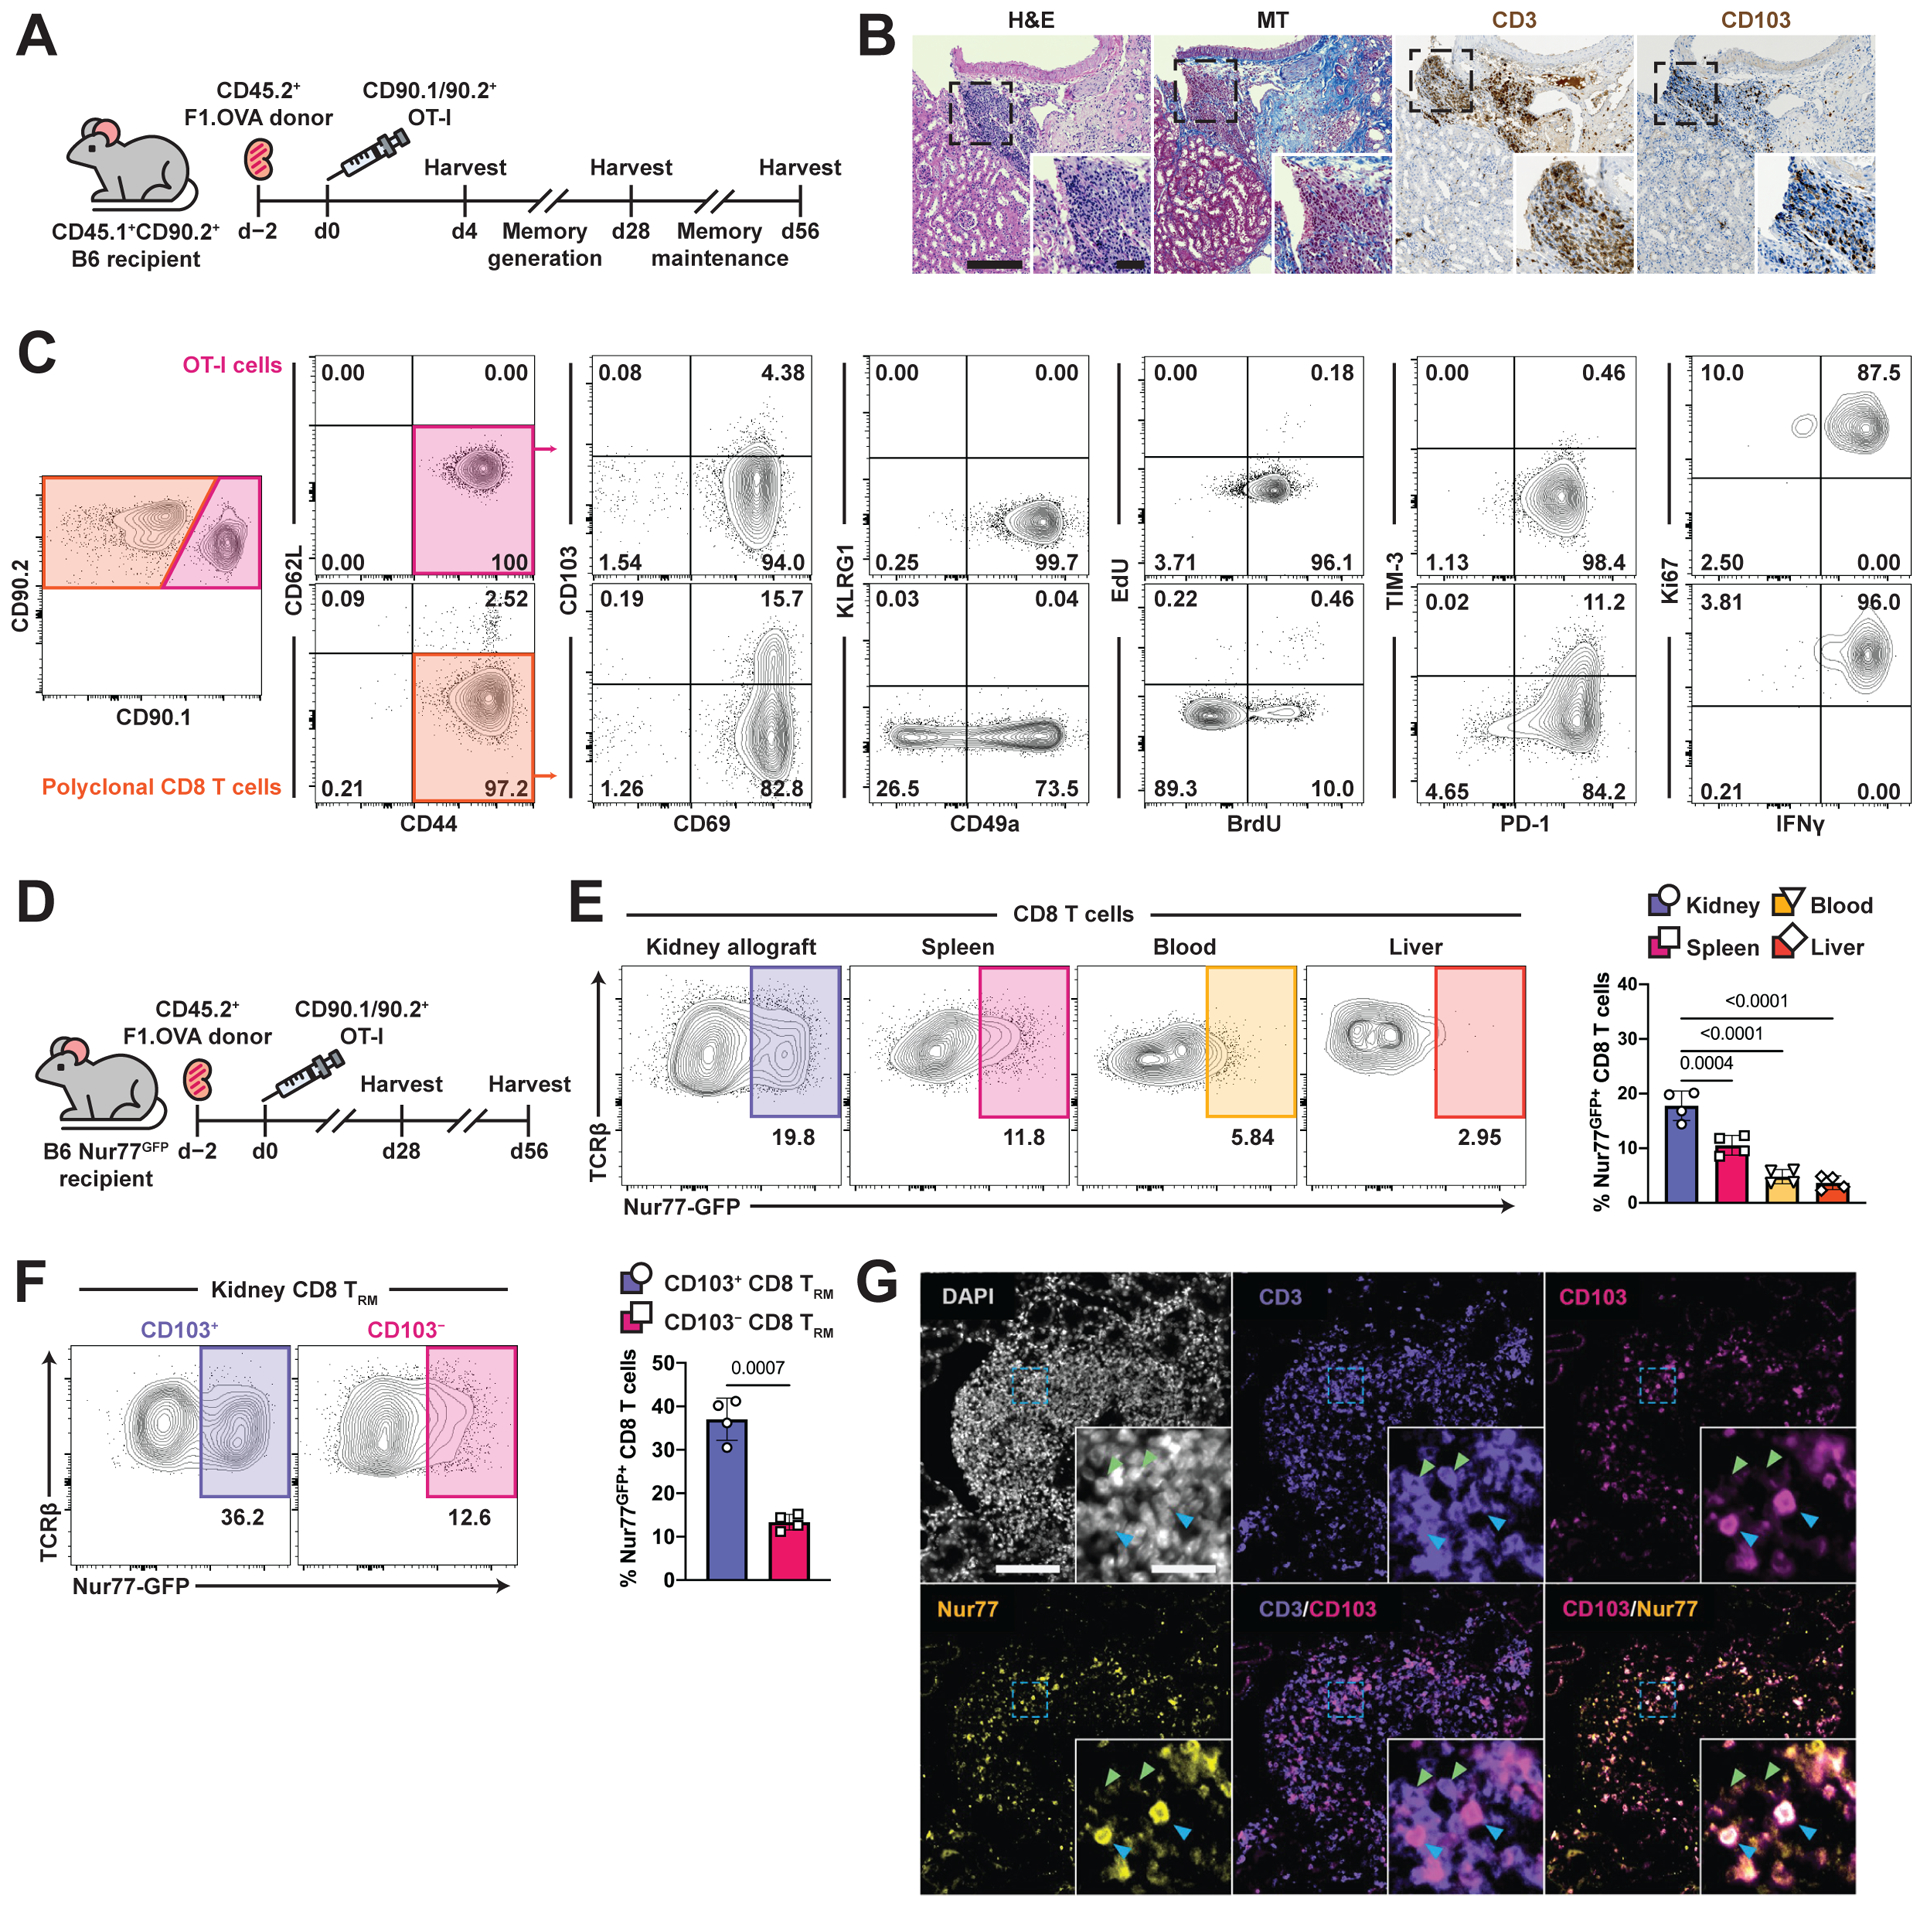
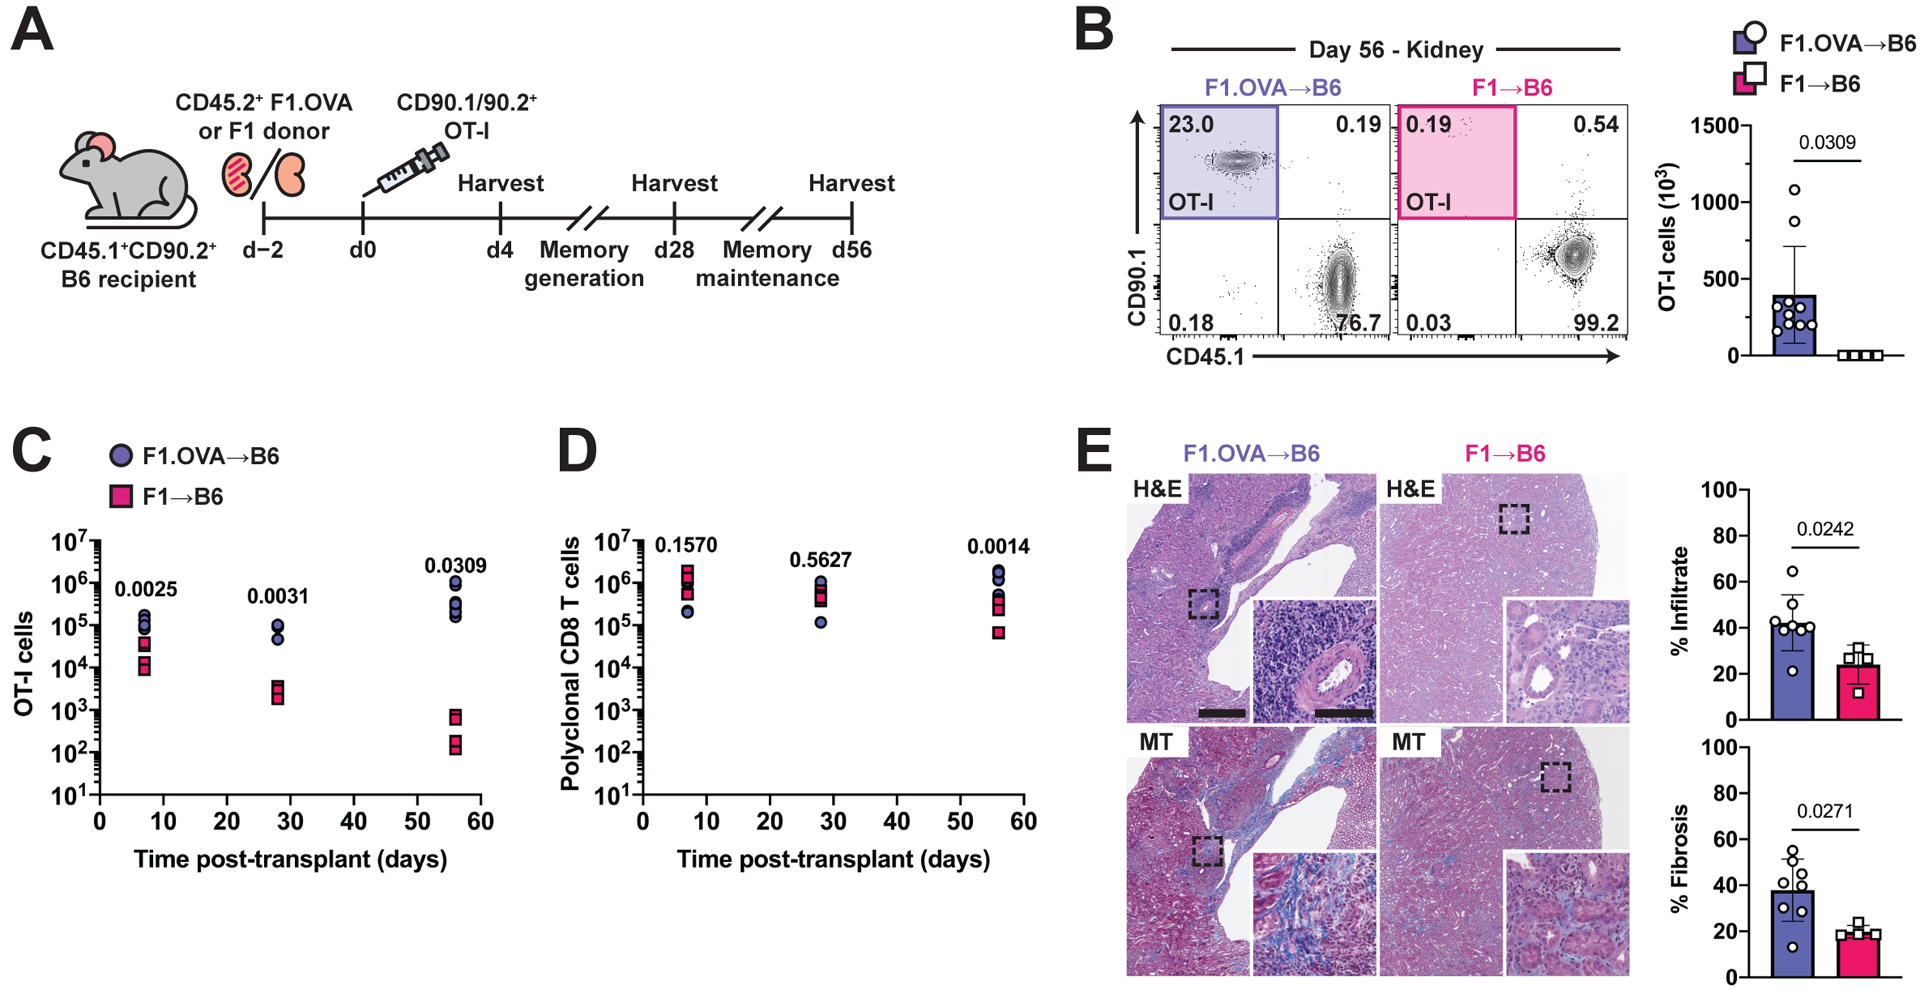
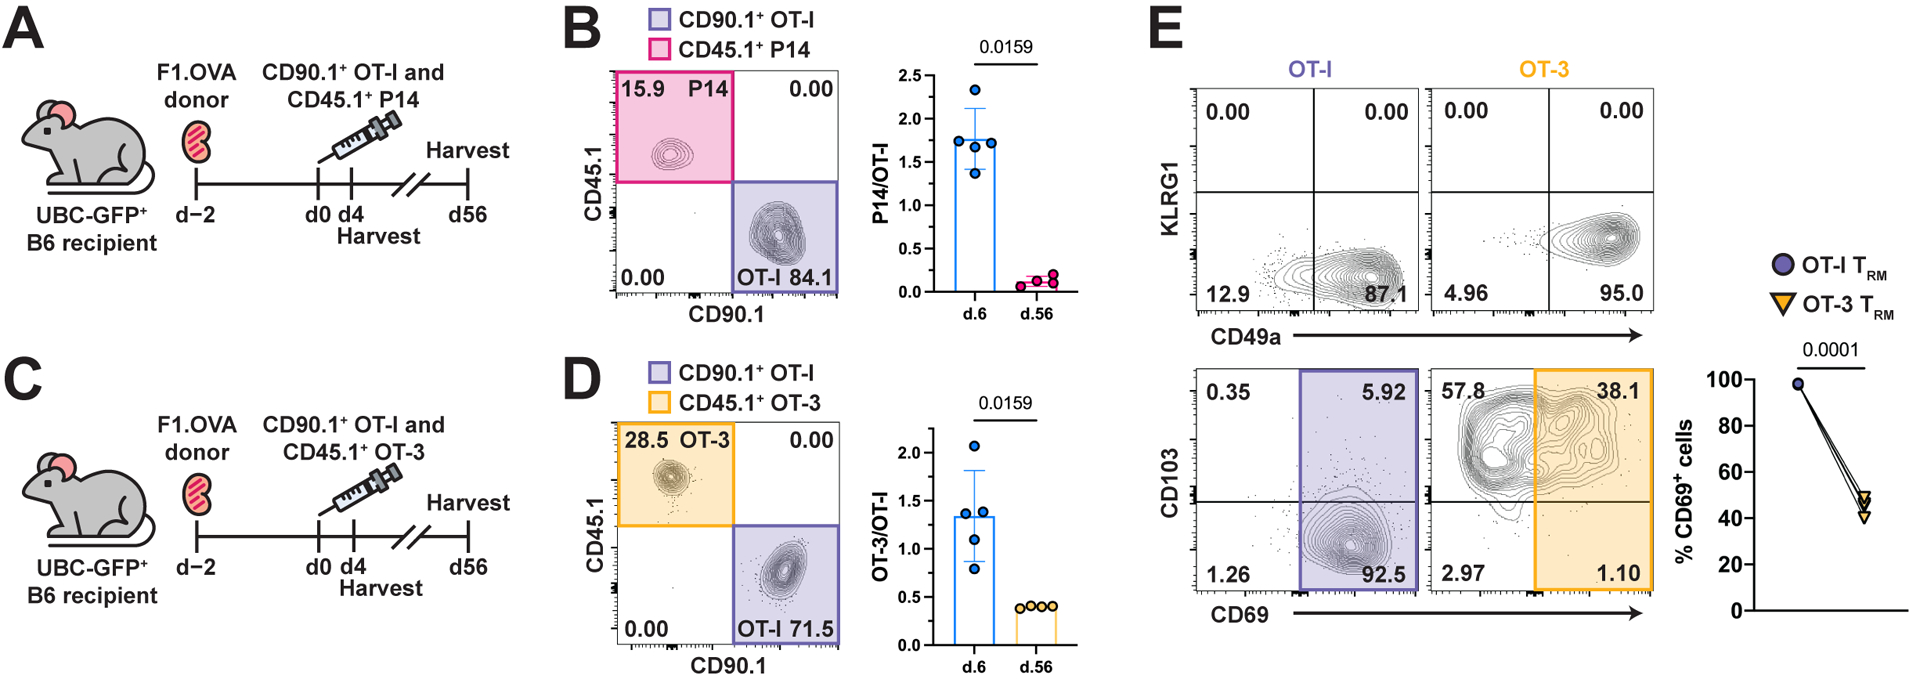
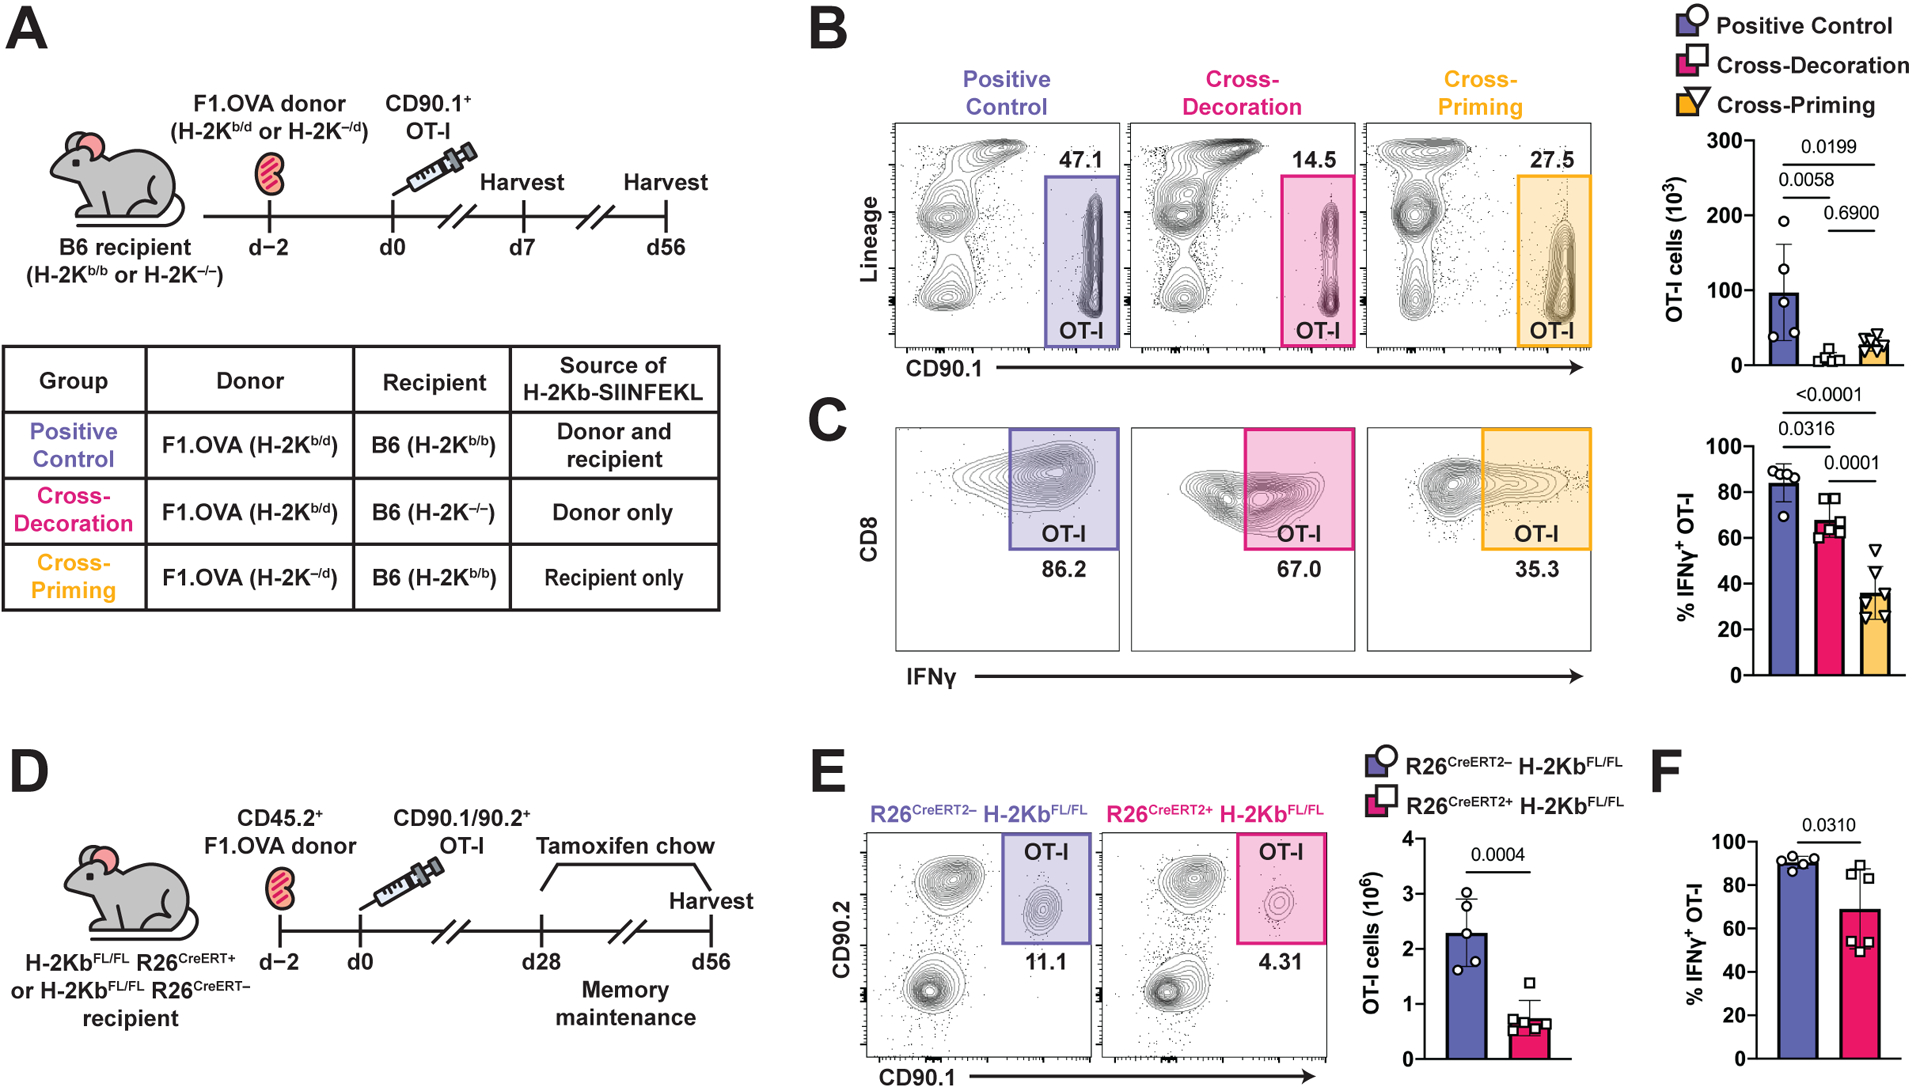
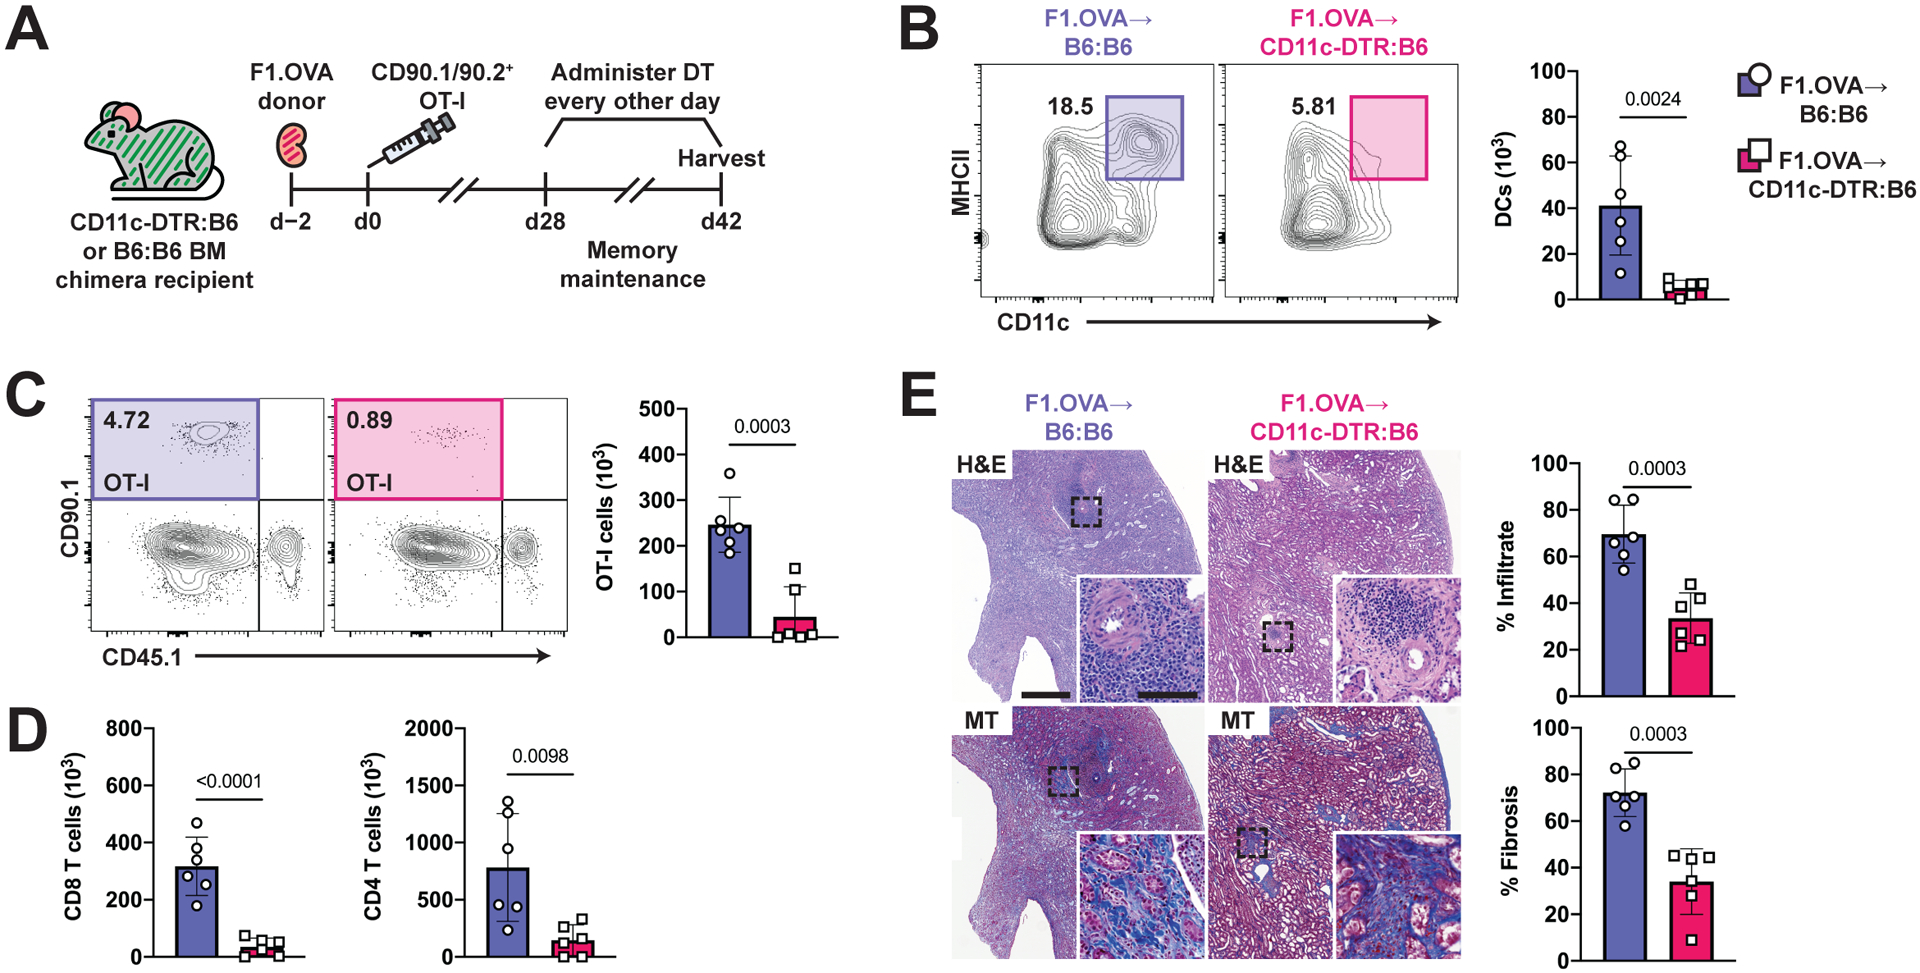
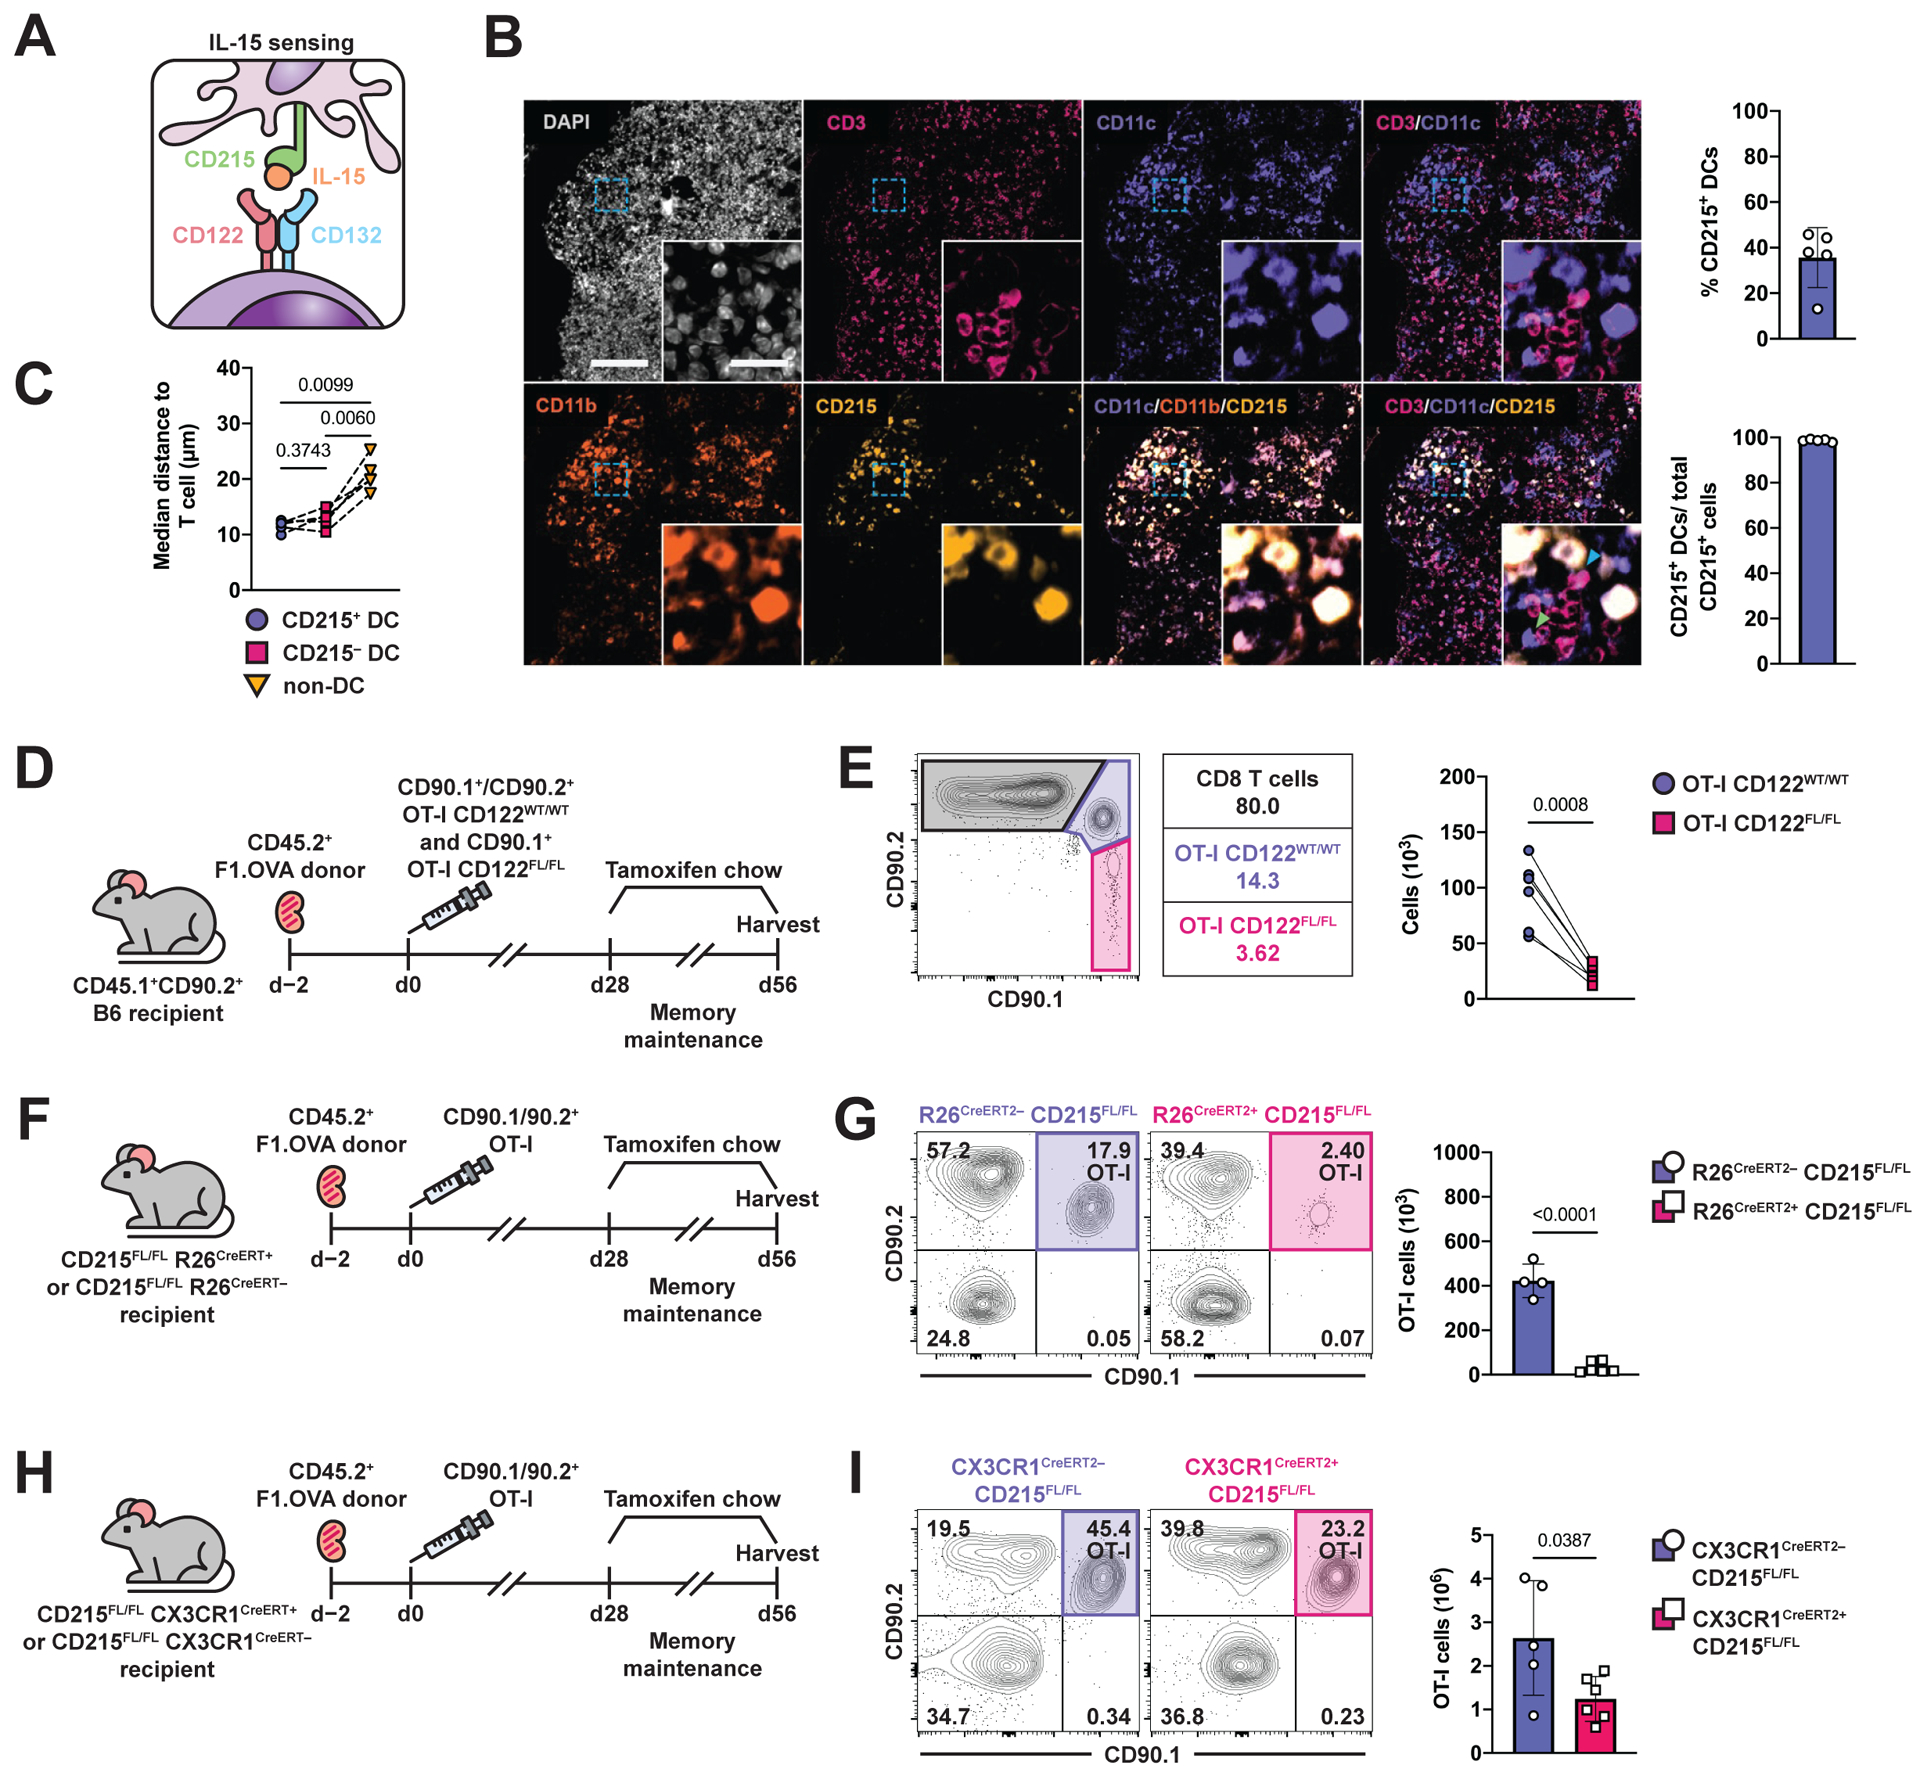
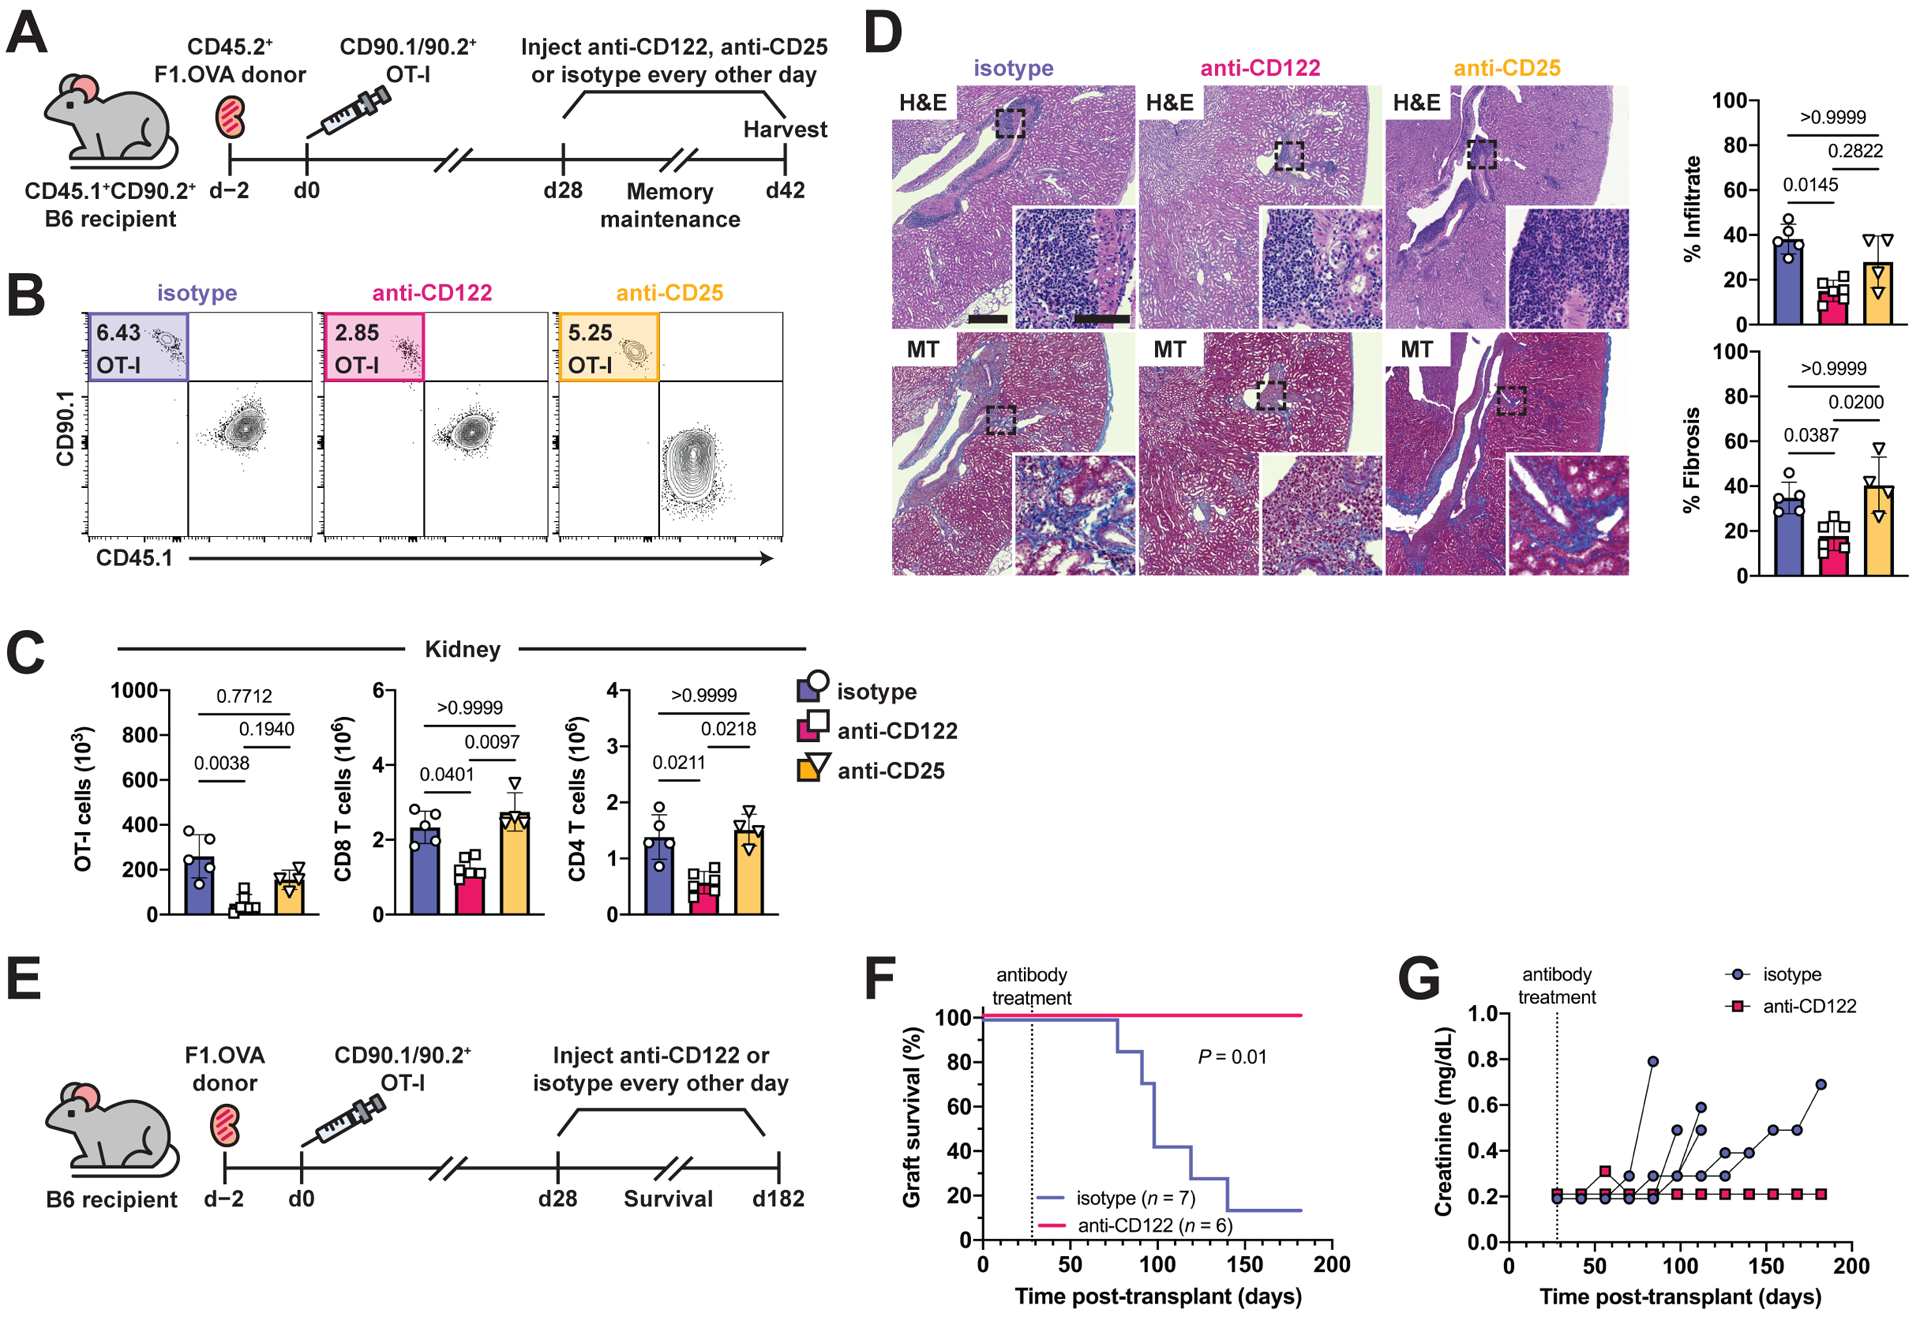
Our understanding of tissue-resident memory T (TRM) cell biology has been largely developed from acute infection models in which antigen is cleared and sterilizing immunity is achieved. Less is known about TRM cells in the context of chronic antigen persistence and inflammation. We investigated factors that underlie TRM maintenance in a kidney transplantation model in which TRM cells drive rejection. In contrast to acute infection, we found that TRM cells declined markedly in the absence of cognate antigen, antigen presentation, or antigen sensing by the T cells. Depletion of graft-infiltrating dendritic cells or interruption of antigen presentation after TRM cells were established was sufficient to disrupt TRM maintenance and reduce allograft pathology. Likewise, removal of IL-15 transpresentation or of the IL-15 receptor on T cells during TRM maintenance led to a decline in TRM cells, and IL-15 receptor blockade prevented chronic rejection. Therefore, antigen and IL-15 presented by dendritic cells play nonredundant key roles in CD8 TRM cell maintenance in settings of antigen persistence and inflammation. These findings provide insights that could lead to improved treatment of chronic transplant rejection and autoimmunity.


Conflict of interest statement

Competing interests: Dr. J. Yun Tso is a cofounder and managing partner of JN Biosciences LLC.

Figures

Fig.1.
Fig.1.. TRM cells form in renal allografts and encounter local cognate antigen.
(A) (Balb/c × B6.OVA) F1 (F1.OVA) kidney allografts were transplanted into B6 recipients followed by adoptive transfer of 1 × 10⁶ effector OT-I cells 2 days post-transplantation. Transplant recipients were harvested at indicated times. (B) H&E, Masson’s trichrome (MT), and anti-CD3 and anti-CD103 stained sections of renal allograft tissue 56 days post-transplantation. Insets highlight areas of T cell infiltration. Blue in MT staining indicates fibrosis. Whole image scale bar: 200 μm. Inset scale bar: 50 μm. n = 6 mice. (C) Transferred CD90.1/90.2+ OT-I and recipient-derived polyclonal CD90.2+ CD8 T cells from 28-day post-transplant kidney allografts were analyzed for TRM markers after gating on extravascular graft CD8+ T cells as shown in Fig. S1B. BrdU water was administered 7 days before and EdU injected 1 hour prior to harvest. n = 8 mice. (D) F1.OVA kidney allografts were transplanted into Nur77-GFP B6 recipients followed by adoptive transfer of 1 × 10⁶ effector OT-I cells 2 days post-transplantation. Transplant recipients were harvested on days 28 and 56. n = 4 mice per time point. (E) Representative plots (left) and percentage (graph, right) of Nur77-GFP expression by CD8 T cells in various tissues on day 56. (F) Representative plots (left) and percentage (graph, right) of Nur77-GFP expression based on CD103 expression. (G) Immunofluorescence staining of renal allograft tissue on day 56 for DAPI (white), CD3 (purple), CD103 (magenta), and Nur77 (yellow). Blue arrows point to cells co-expressing CD3, CD103 and Nur77. Green arrows point to cells expressing only CD3. Whole image scale bar: 100 μm. Inset scale bar: 20 μm. n = 5 mice. P values were determined by (E, F) two-tailed unpaired t test.
Fig. 2.
Fig. 2.. Reduced number of intragraft TRM cells in the absence of cognate antigen.
(A) F1.OVA or (Balb/c × B6) F1 kidney allografts were transplanted into B6 recipients followed by adoptive transfer of 1 × 10⁶ effector OT-I cells 2 days post-transplantation. Transplant recipients were harvested on day 4 to study effector CD8 T cell graft infiltration, and on days 28 and 56 to study maintenance of CD8 TRM cells. Flow analysis was performed after gating on extravascular graft CD8+ T cells as shown in Fig. S1B. n = 4–8 mice per group. (B) Percentage (representative plots, left) and absolute number (graphs, right) of CD90.1+ OT-I cells on day 56. (C, D) Enumeration of CD90.1+ OT-I cells (C) and polyclonal CD45.1+CD90.1 CD8 T cells (D) in renal allograft tissue on days 4, 28, and 56. n = 4–8 mice per group per time point. (E) H&E and Masson’s trichrome-stained sections of F1.OVA renal allograft tissue (representative images, left) and quantification of infiltrate and fibrosis (graphs, right) day 56. Whole image scale bar: 500 μm. Inset scale bar: 100 μm. P values were determined by (B-E) two-tailed unpaired t test.
Fig. 3.
Fig. 3.. TCR affinity of CD8 T cells is positively associated with TRM maintenance and phenotype.
(A) F1.OVA kidney allografts were transplanted into GFP+ B6 recipients followed by co-adoptive transfer of 1 × 10⁶ effector OT-I and P14 cells 2 days post-transplantation. Transplant recipients were harvested on days 6 (n = 5) and 56 (n = 4) to quantify CD8 TRM after gating on extravascular graft CD8+ T cells as shown in Fig. S1B. (B) Percentage (representative d.56 plot, left) and ratio (graph, right) of CD45.1+ P14 to CD90.1+ OT-I cells on days 6 and 56. (C) (Balb/c × B6.OVA) F1.OVA kidney allografts were transplanted into GFP+ B6 recipients followed by co-adoptive transfer of 1 × 10⁶ CD90.1/90.2+ effector OT-I cells and CD45.1+ effector OT-3 cells 2 days post-transplantation. Transplant recipients were harvested on days 6 (n = 5) and 56 (n = 4) to quantify CD8 TRM after gating on extravascular graft CD8+ T cells as shown in Fig. S1B. (D) Percentage (representative d.56 plot, left) and ratio (graph, right) of OT-3 to OT-I cells on days 6 and 56. (E) Percentage (representative plots, left) of OT-I and OT-3 cells expressing TRM cell markers and percentage (graph, right) of OT-I and OT-3 cells that were CD69+ in the renal allograft on day 56. P values were determined by (B, D, E) two-tailed paired t test.
Fig. 4.
Fig. 4.. MHC-I presentation of cognate antigen via cross-priming and cross-decoration are required for TRM cell maintenance.
(A) F1.OVA H-2Kb-sufficient (H-2Kb/d) or F1.OVA H-2Kb-deficient (H-2K–/d) kidney allografts were transplanted into B6 H-2Kb-sufficient (H-2Kb/b) or B6 H-2Kb-deficient (H-2Kb–/–) recipients followed by co-adoptive transfer of 1 × 10⁶ effector OT-I cells 2 days post-transplantation. Transplant recipients were harvested on days 7 and 56 to study maintenance of CD8 TRM cells. Flow analysis was performed after gating on extravascular graft CD8+ T cells as shown in Fig. S1B. n = 5–6 mice per group. (B) Representative flow plots and absolute number (graph) of OT-I cells from positive control mice (intact cross-priming and cross-decoration), cross-decoration only mice (deficient cross-priming), and cross-priming only mice (deficient cross-decoration) on day 56. (C) Representative flow plots and frequency (graph) of IFNγ+ OT-I cells from positive control mice, cross-decoration only mice, and cross-priming only mice on day 56. (D) F1.OVA kidney allografts were transplanted into either H-2KbFL/FL R26CreERT2– or H-2KbFL/FL R26CreERT2+ B6 recipients followed by adoptive transfer of 1 × 10⁶ effector OT-I cells 2 days post-transplantation. Tamoxifen chow was introduced from days 28–56, then recipients were subsequently harvested. n = 5–6 mice per group. (E) Representative flow plots (left) and absolute number (graph) of TRM OT-I cells after tamoxifen treatment at 56 days post-transplantation. (F) Frequency of IFNγ+ OT-I cells after restimulation with F1.OVA donor splenocytes. P values were determined by (B, C) one-way ANOVA with Tukey’s correction, and (E, F) two-tailed unpaired t test.
Fig. 5.
Fig. 5.. Graft-infiltrating DCs are required for TRM cell maintenance and graft pathology.
(A) F1.OVA kidney allografts were transplanted into CD11c-DTR:B6 chimeras (B6 mice reconstituted with CD11c-DTR bone marrow) or control B6:B6 chimeras (B6 mice reconstituted B6 bone marrow) followed by adoptive transfer of 1 × 10⁶ effector OT-I cells 2 days post-transplantation. Diphtheria toxin was administered to both groups every other day from days 28–42. Flow analysis was performed after gating on extravascular graft CD8+ T cells as shown in Fig. S1B. n = 6 mice per group. (B) Representative flow plots and absolute number (graph) of intragraft CD11c+MHCII+ DCs after DT treatment. (C) Representative flow plots and absolute number (graphs) of TRM OT-I cells after DT treatment. (D) Absolute number of recipient-derived polyclonal CD8 and CD4 TRM cells after DT treatment. (E) H&E and MT-stained sections of F1.OVA renal allograft tissue (representative images) and quantification of infiltrate and fibrosis (graphs) from bone marrow chimera recipients on day 42 following DT treatment . Whole image scale bar: 500 μm. Inset scale bar: 100 μm. P values were determined by (B-E) two-tailed unpaired t test.
Fig. 6.
Fig. 6.. TRM cell maintenance and function depends on local IL-15 signaling in renal allograft tissue.
(A) Schematic of IL-15 signaling. (B) Multiplex immunofluorescence staining of F1.OVA renal allograft on day 56 post-transplantation for nuclei (DAPI, white), T cells (CD3, magenta), dendritic cells (CD11b/CD11c, purple/orange), and CD215 expression (yellow). Close proximity of CD3+ cell with CD11c+CD215+cell indicated by blue arrow. Close proximity of CD3+ cell with CD11c+CD215cell indicated by green arrow. Percentage of APCs expressing CD215 and percentage of CD215-expressing APCs out of total CD215+ cells shown in graphs. Whole image scale bar: 200 μm. Cropped inset scale bar: 20 μm. n = 5 mice. (C) Median distance of T cells from CD215+ APCs, CD215 APCs, and non-APCs. (D) F1.OVA kidney allografts were transplanted into CD45.1+ B6 recipients followed by co-adoptive transfer of 1 × 10⁶ effector OT-I CD122WT/WT and effector OT-I CD122FL/FL R26CreERT2+ cells 2 days post-transplantation. Tamoxifen chow was introduced from days 28–56 post-transplantation, then recipients were subsequently harvested. Flow analysis was performed after gating on extravascular graft CD8+ T cells as shown in Fig. S1B. n = 6 mice. (E) Representative flow plots and absolute number (graph) of TRM OT-I on d.56 following tamoxifen treatment. (F) F1.OVA kidney allografts were transplanted into either CD215FL/FL R26CreERT2– or CD215FL/FL R26CreERT2+ B6 recipients followed by adoptive transfer of 1 × 10⁶ effector OT-I cells 2 days post-transplantation. Tamoxifen chow was introduced from days 28–56. n = 4–6 mice per group. (G) Representative flow plots and absolute number (graph) of TRM OT-I cells on day 56 following tamoxifen treatment. (H) F1.OVA kidney allografts were transplanted into either CD215FL/FL CX3CR1CreERT2– or CD215FL/FL CX3CR1CreERT2+ B6 recipients followed by adoptive transfer of 1 × 10⁶ effector OT-I cells 2 days post-transplantation. Tamoxifen chow was introduced from days 28–56. n = 5–6 mice per group. (I) Representative flow plots and absolute number (graph) of TRM OT-I cells on day 56 following tamoxifen treatment. P values were determined by (C) mixed-effects model with Tukey’s correction, (E) two-tailed paired t test, and (G, I) two-tailed unpaired t test.
Fig. 7.
Fig. 7.. Antibody blockade of IL-15 signaling disrupts TRM cell maintenance in renal allograft tissue and prevents chronic rejection.
(A) F1.OVA kidney allografts were transplanted into CD45.1+ B6 recipients followed by adoptive transfer of 1 × 10⁶ effector OT-I cells 2 days post-transplantation. Isotype, anti-CD122, or anti-CD25 antibodies were administered three times weekly from days 28–42 post-transplantation. Flow analysis was performed after gating on extravascular graft CD8+ T cells as shown in Fig. S1B. n = 4–6 mice per group. (B) Percentage of TRM OT-I cells after antibody treatment. (C) Absolute numbers of TRM OT-I and CD8 and CD4 recipient-derived polyclonal TRM cells after antibody treatment. (D) H&E and MT-stained sections of F1.OVA renal allograft tissue and quantification of infiltrate and fibrosis (graphs) from antibody-treated recipients on day 42. Whole image scale bar: 400 μm. Inset scale bar: 100 μm. (E) F1.OVA kidney allografts were transplanted into CD45.1+ B6 recipients followed by adoptive transfer of 1 × 10⁶ effector OT-I cells 2 days post-transplantation. Isotype or anti-CD122 antibody were administered three times weekly beginning on day 28 post-transplantation. n = 6–7 mice per group. (F) Kaplan-Meier curve of graft survival after antibody treatment. (G) Serum creatinine measurements throughout the course of antibody treatment. P values were determined by (C, D) Kruskal–Wallis one-way ANOVA with Dunn’s correction, and (F) log-rank (Mantel–Cox) test.

Similar articles

Cited by

References

    1. Ibrahim S, Dawson DV, Sanfilippo F, Predominant infiltration of rejecting human renal allografts with T cells expressing CD8 and CD45RO. Transplantation 59, 724–728 (1995). - PubMed
    1. Loupy A, Haas M, Roufosse C, Naesens M, Adam B, Afrouzian M, Akalin E, Alachkar N, Bagnasco S, Becker JU, Cornell LD, Clahsen-van Groningen MC, Demetris AJ, Dragun D, Duong van Huyen JP, Farris AB, Fogo AB, Gibson IW, Glotz D, Gueguen J, Kikic Z, Kozakowski N, Kraus E, Lefaucheur C, Liapis H, Mannon RB, Montgomery RA, Nankivell BJ, Nickeleit V, Nickerson P, Rabant M, Racusen L, Randhawa P, Robin B, Rosales IA, Sapir-Pichhadze R, Schinstock CA, Seron D, Singh HK, Smith RN, Stegall MD, Zeevi A, Solez K, Colvin RB, Mengel M, The Banff 2019 Kidney Meeting Report (I): Updates on and clarification of criteria for T cell- and antibody-mediated rejection. American Journal of Transplantation 20, 2318–2331 (2020). - PMC - PubMed
    1. Abou-Daya KI, Tieu R, Zhao D, Rammal R, Sacirbegovic F, Williams AL, Shlomchik WD, Oberbarnscheidt MH, Lakkis FG, Resident memory T cells form during persistent antigen exposure leading to allograft rejection. Science immunology 6, (2021). - PMC - PubMed
    1. Rosenberg AS, Singer A, Cellular Basis of Skin Allograft Rejection: An In Vivo Model of Immune-Mediated Tissue Destruction. Annual review of immunology 10, 333–358 (1992). - PubMed
    1. Hancock WW, Gao W, Faia KL, Csizmadia V, Chemokines and their receptors in allograft rejection. Current opinion in immunology 12, 511–516 (2000). - PubMed

Publication types