

Simvastatin Attenuates Glucocorticoid-Induced Human Trabecular Meshwork Cell Dysfunction via YAP/TAZ Inactivation
- PMID: 37083467
- PMCID: PMC10524554
- DOI: 10.1080/02713683.2023.2206067
Simvastatin Attenuates Glucocorticoid-Induced Human Trabecular Meshwork Cell Dysfunction via YAP/TAZ Inactivation
Abstract
Purpose: Impairment of the trabecular meshwork (TM) is the principal cause of increased outflow resistance in the glaucomatous eye. Yes-associated protein (YAP) and transcriptional coactivator with PDZ binding motif (TAZ) are emerging as potential mediators of TM cell/tissue dysfunction. Furthermore, YAP/TAZ activity was recently found to be controlled by the mevalonate pathway in non-ocular cells. Clinically used statins block the mevalonate cascade and were shown to improve TM cell pathobiology; yet, the link to YAP/TAZ signaling was not investigated. In this study, we hypothesized that simvastatin attenuates glucocorticoid-induced human TM (HTM) cell dysfunction via YAP/TAZ inactivation.
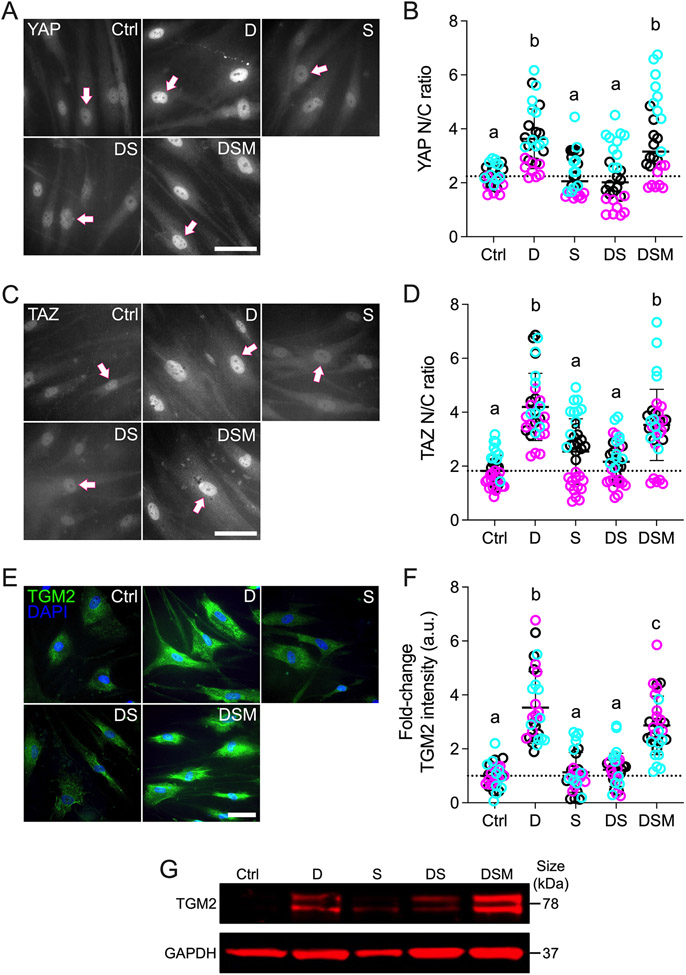
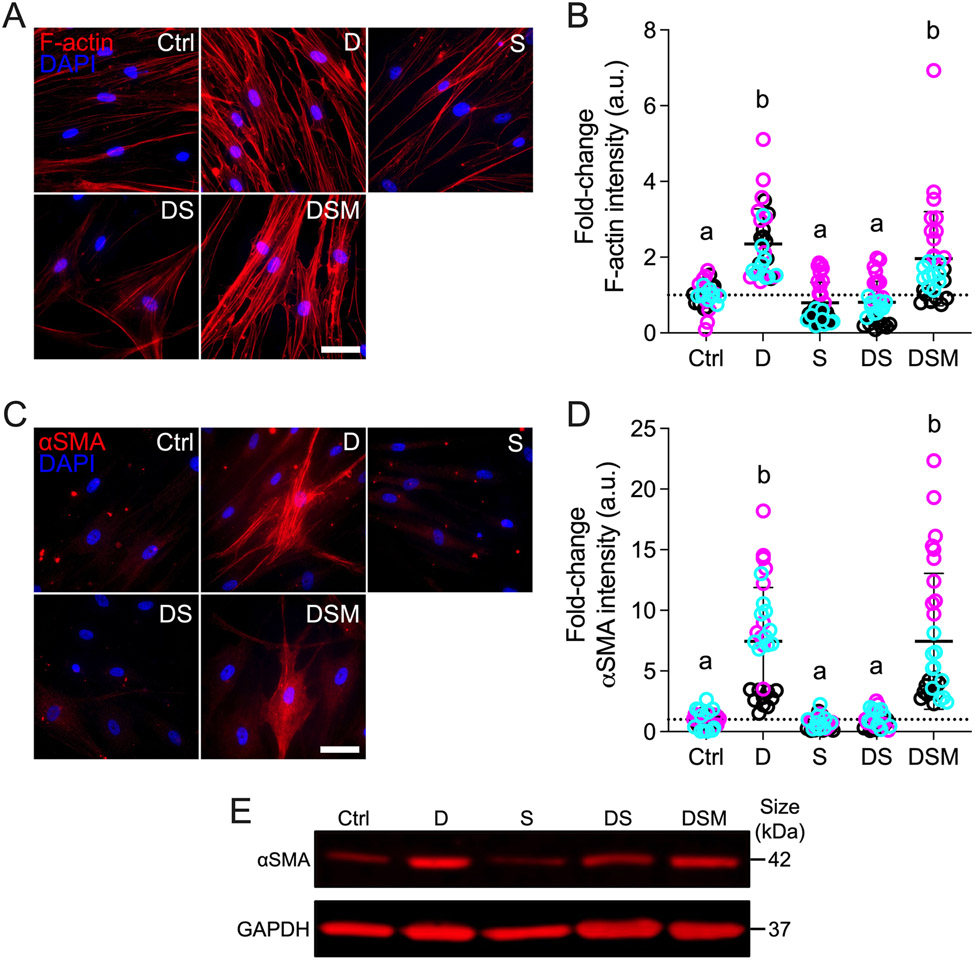
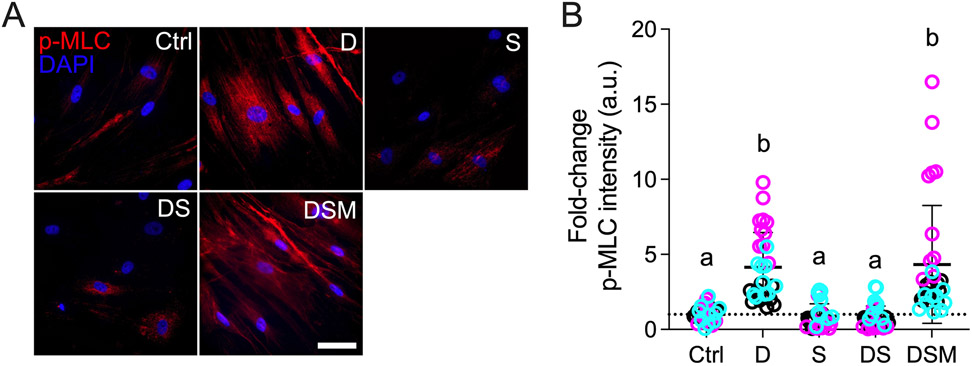
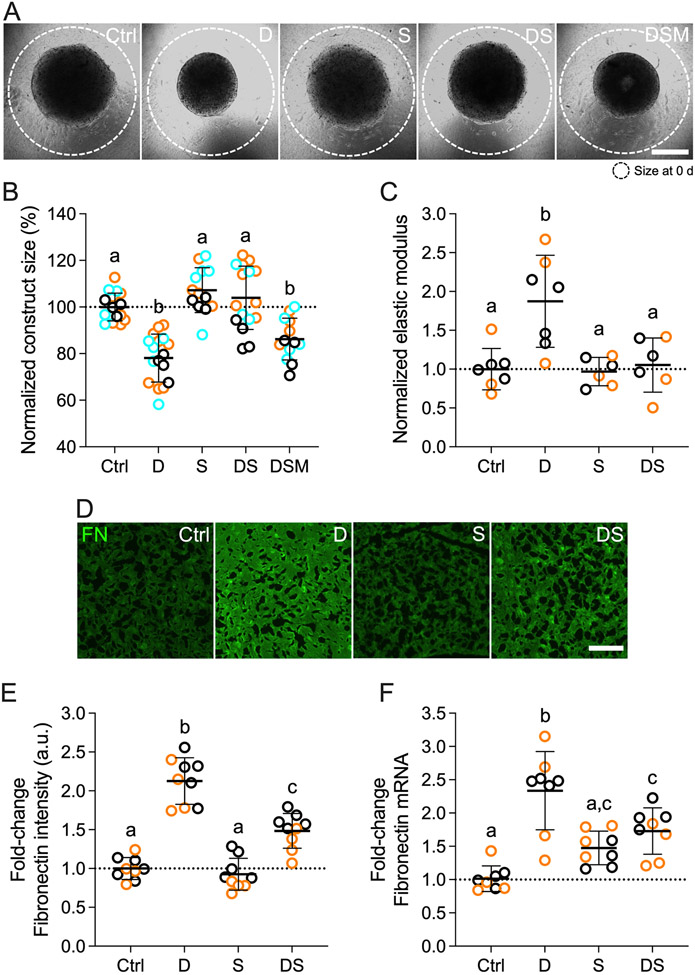
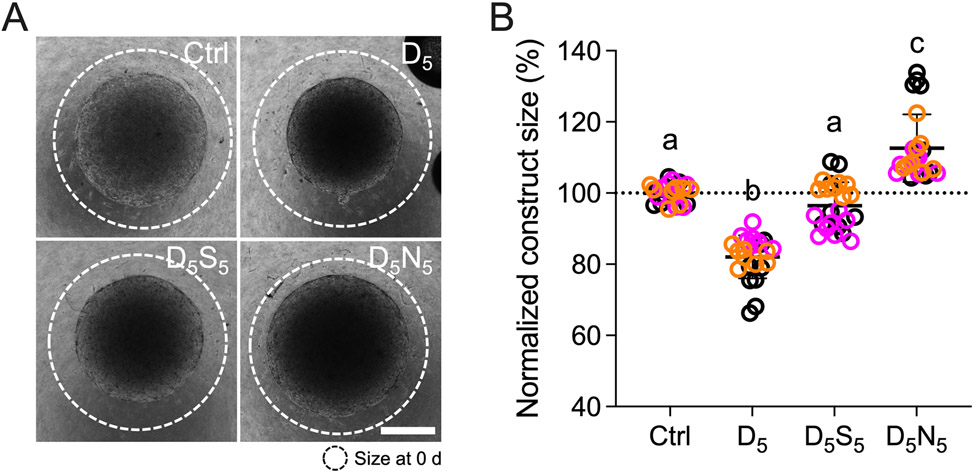
Methods: Primary HTM cells were seeded atop or encapsulated within bioengineered extracellular matrix (ECM) hydrogels. Dexamethasone was used to induce a pathologic phenotype in HTM cells in the absence or presence of simvastatin. Changes in YAP/TAZ activity, actin cytoskeletal organization, phospho-myosin light chain levels, hydrogel contraction/stiffness, and fibronectin deposition were assessed.
Results: Simvastatin potently blocked pathologic YAP/TAZ nuclear localization/activity, actin stress fiber formation, and myosin light chain phosphorylation in HTM cells. Importantly, simvastatin co-treatment significantly attenuated dexamethasone-induced ECM contraction/stiffening and fibronectin mRNA and protein levels. Sequential treatment was similarly effective but did not match clinically-used Rho kinase inhibition.
Conclusions: YAP/TAZ inactivation with simvastatin attenuates HTM cell pathobiology in a tissue-mimetic ECM microenvironment. Our data may help explain the association of statin use with a reduced risk of developing glaucoma via indirect YAP/TAZ inhibition as a proposed regulatory mechanism.
Keywords: Mechanotransduction; TM cell pathobiology; cell-ECM interaction; cholesterol; steroid-induced glaucoma.
Conflict of interest statement
Disclosure
The authors report no conflicts of interest.
Figures
Similar articles
-
Substratum stiffness and latrunculin B modulate the gene expression of the mechanotransducers YAP and TAZ in human trabecular meshwork cells.Exp Eye Res. 2013 Aug;113:66-73. doi: 10.1016/j.exer.2013.05.014. Epub 2013 May 29. Exp Eye Res. 2013. PMID: 23727052 Free PMC article.
-
Lysophosphatidic Acid Induces ECM Production via Activation of the Mechanosensitive YAP/TAZ Transcriptional Pathway in Trabecular Meshwork Cells.Invest Ophthalmol Vis Sci. 2018 Apr 1;59(5):1969-1984. doi: 10.1167/iovs.17-23702. Invest Ophthalmol Vis Sci. 2018. PMID: 29677358 Free PMC article.
-
Targeting YAP/TAZ mechanosignaling to ameliorate stiffness-induced Schlemm's canal cell pathobiology.Am J Physiol Cell Physiol. 2024 Feb 1;326(2):C513-C528. doi: 10.1152/ajpcell.00438.2023. Epub 2023 Dec 18. Am J Physiol Cell Physiol. 2024. PMID: 38105758 Free PMC article.
-
The role of YAP/TAZ mechanosignaling in trabecular meshwork and Schlemm's canal cell dysfunction.Vision Res. 2024 Nov;224:108477. doi: 10.1016/j.visres.2024.108477. Epub 2024 Aug 28. Vision Res. 2024. PMID: 39208753 Review.
-
Reciprocal regulation of YAP/TAZ by the Hippo pathway and the Small GTPase pathway.Small GTPases. 2020 Jul;11(4):280-288. doi: 10.1080/21541248.2018.1435986. Epub 2018 Apr 20. Small GTPases. 2020. PMID: 29457552 Free PMC article. Review.
Cited by
-
Engineered sensor actuator modulator as aqueous humor outflow actuator for gene therapy of primary open-angle glaucoma.J Transl Med. 2024 Aug 28;22(1):791. doi: 10.1186/s12967-024-05581-1. J Transl Med. 2024. PMID: 39198903 Free PMC article.
-
To be or not to be - Decoding the Trabecular Meshwork Cell Identity.bioRxiv [Preprint]. 2024 Apr 29:2024.04.26.591346. doi: 10.1101/2024.04.26.591346. bioRxiv. 2024. PMID: 38746421 Free PMC article. Preprint.
-
ECM biomaterials for modeling of outflow cell biology in health and disease.Biomater Biosyst. 2024 Mar 5;13:100091. doi: 10.1016/j.bbiosy.2024.100091. eCollection 2024 Mar. Biomater Biosyst. 2024. PMID: 38528909 Free PMC article.
-
Protective Effect of Nicotinamide Riboside on Glucocorticoid-Induced Glaucoma: Mitigating Mitochondrial Damage and Extracellular Matrix Deposition.Invest Ophthalmol Vis Sci. 2024 Jul 1;65(8):1. doi: 10.1167/iovs.65.8.1. Invest Ophthalmol Vis Sci. 2024. PMID: 38949632 Free PMC article.
-
The Hippo signalling pathway and its impact on eye diseases.J Cell Mol Med. 2024 Apr;28(8):e18300. doi: 10.1111/jcmm.18300. J Cell Mol Med. 2024. PMID: 38613348 Free PMC article.
References
-
- Brubaker RF. Flow of aqueous humor in humans [The Friedenwald Lecture]. Invest Ophthalmol Vis Sci 1991;32(13):3145–66. - PubMed
Publication types
MeSH terms
Substances
Grants and funding
LinkOut - more resources
Full Text Sources
Other Literature Sources
Medical