. 2023 Apr 21;9(16):eabq0651.
doi: 10.1126/sciadv.abq0651. Epub 2023 Apr 21.

Cell-autonomous immune dysfunction driven by disrupted autophagy in C9orf72-ALS iPSC-derived microglia contributes to neurodegeneration

Affiliations

Cell-autonomous immune dysfunction driven by disrupted autophagy in C9orf72-ALS iPSC-derived microglia contributes to neurodegeneration

Poulomi Banerjee et al. Sci Adv. .

Abstract

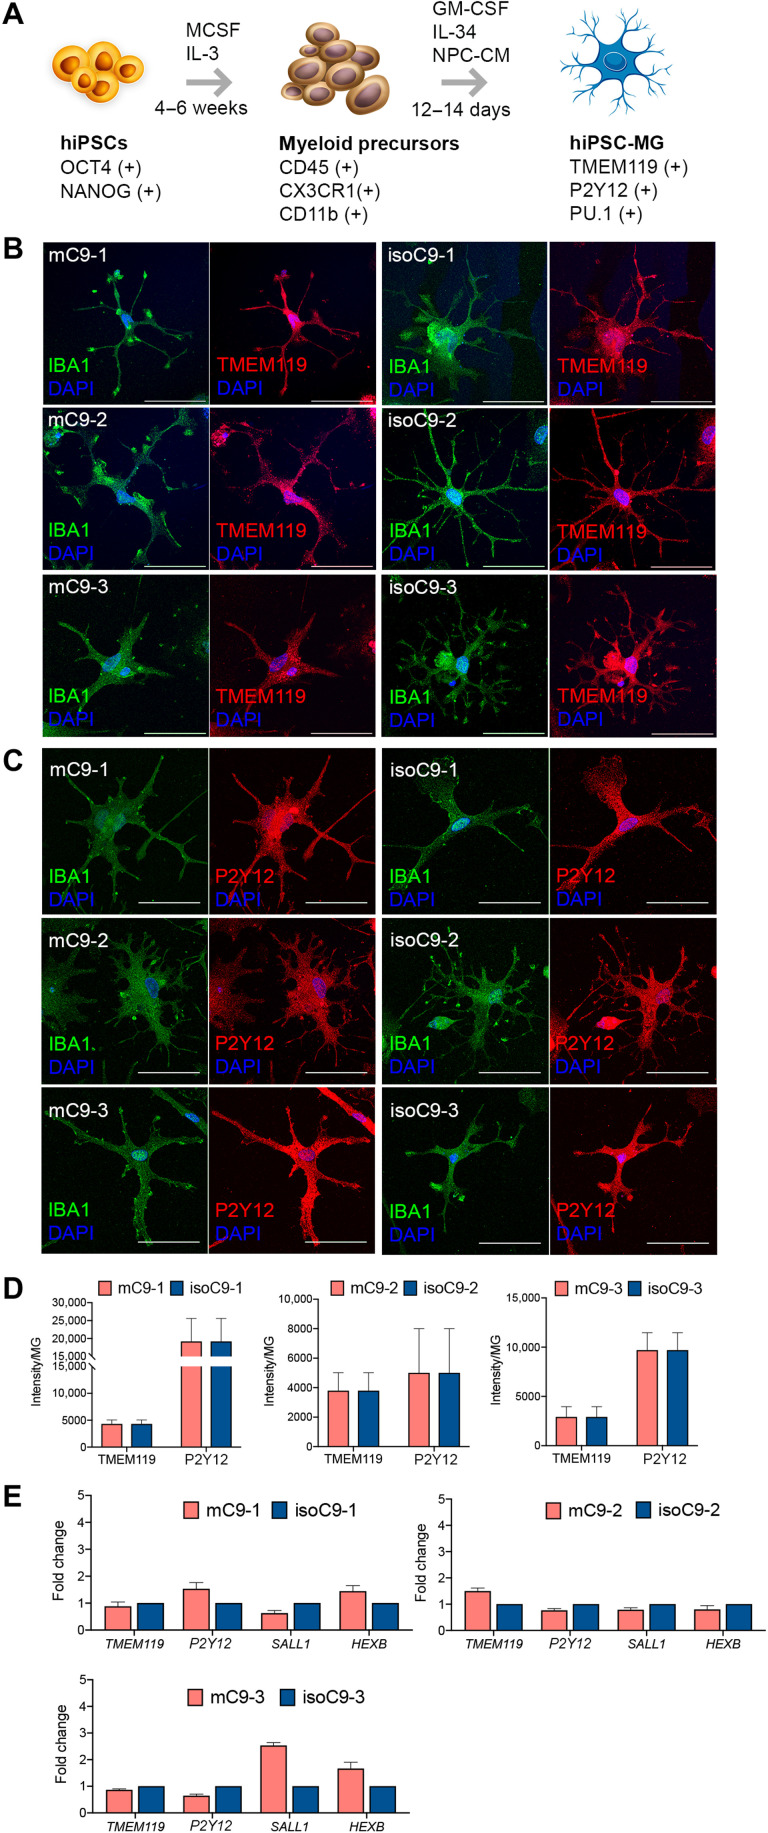
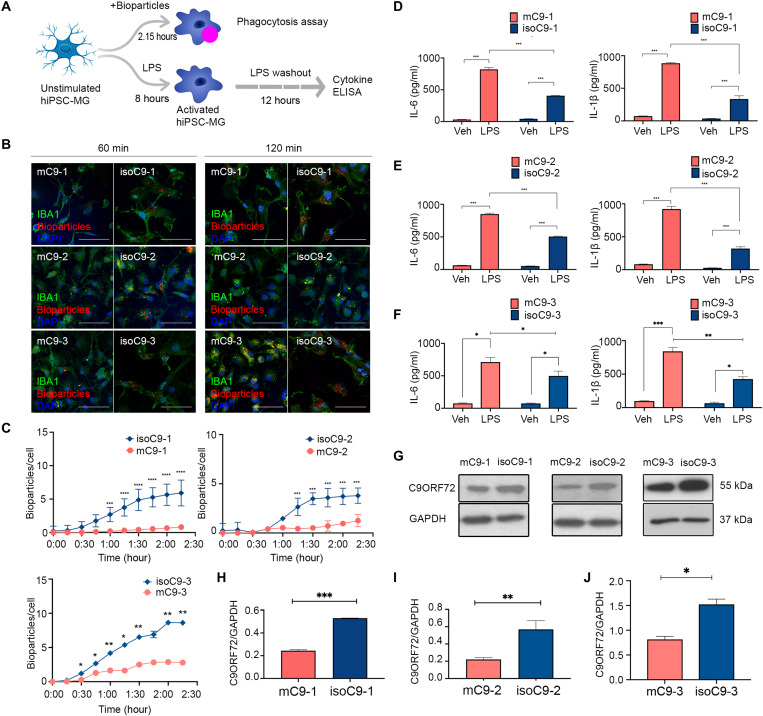
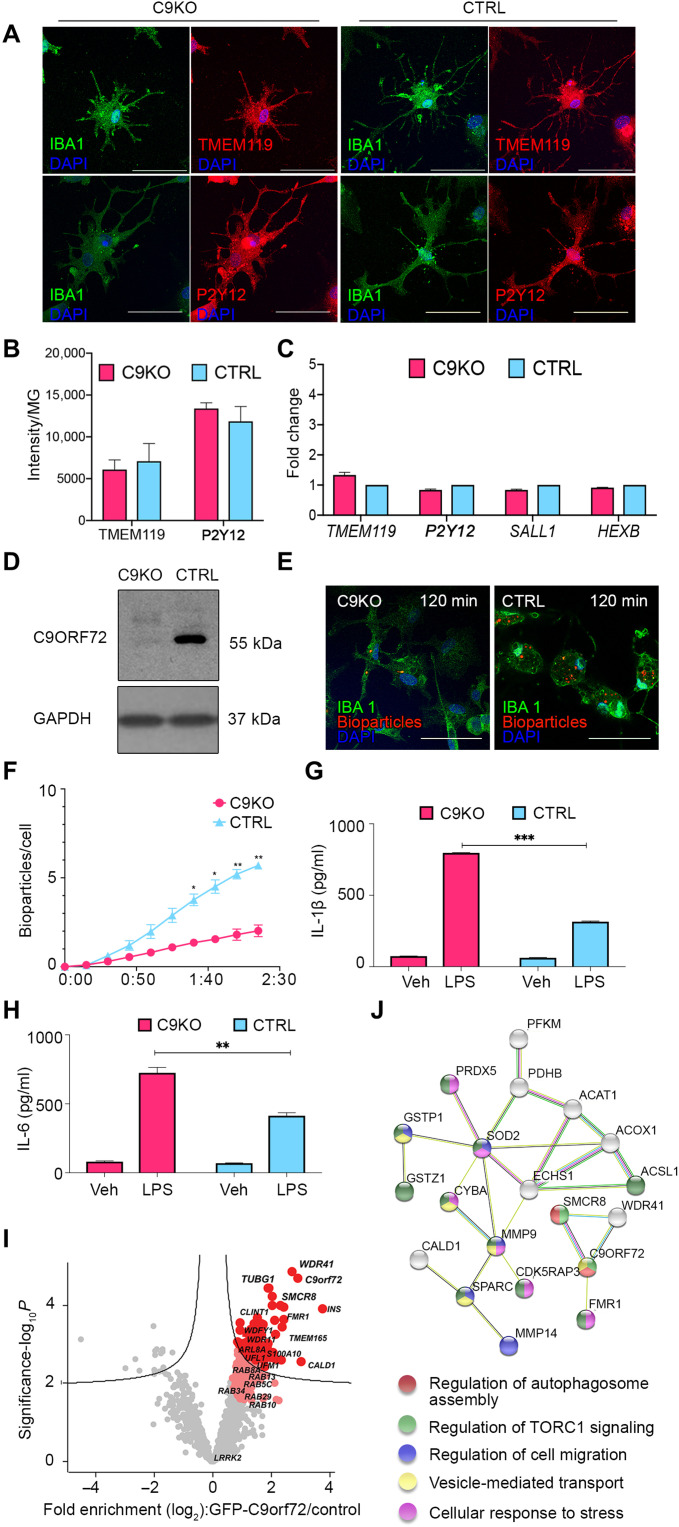
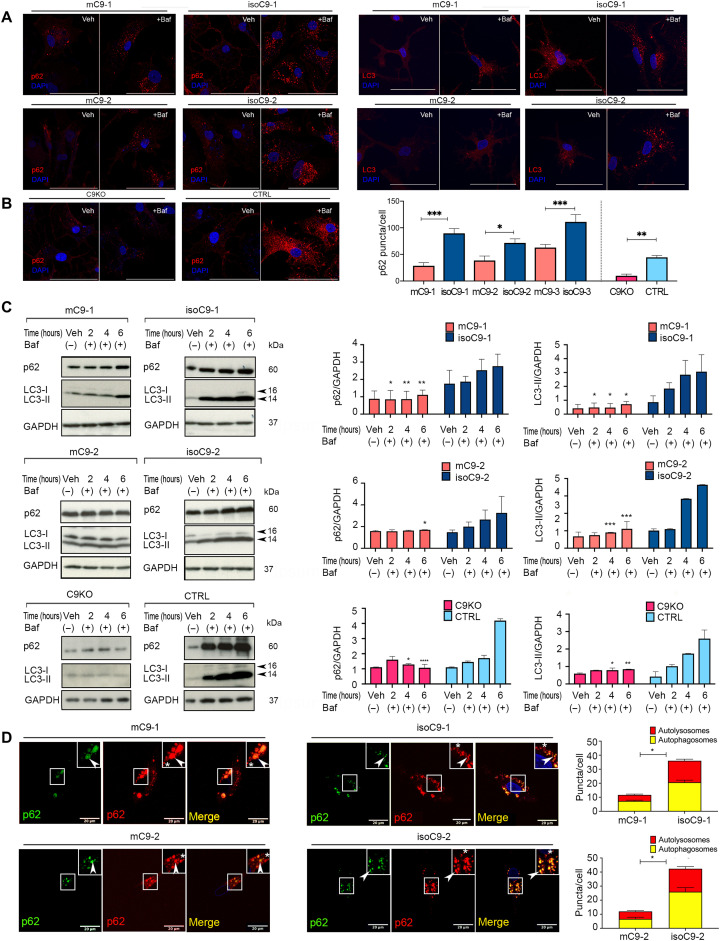
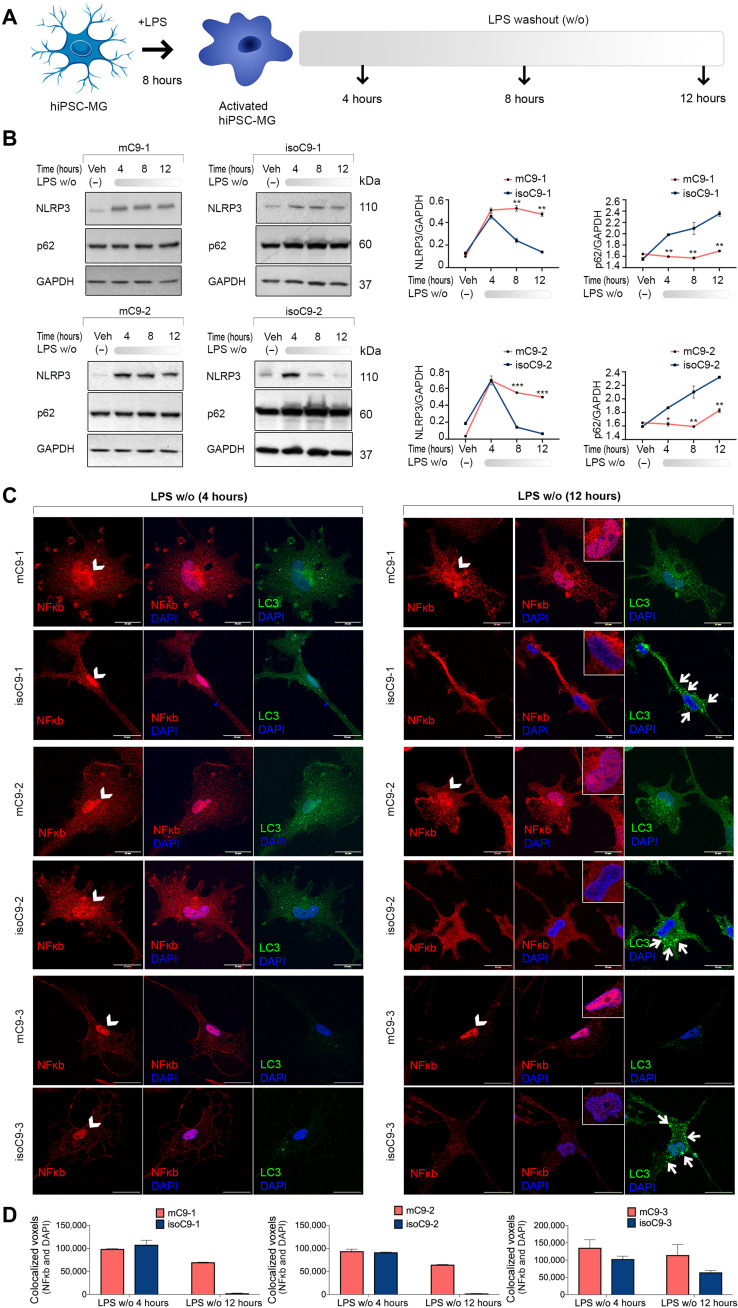
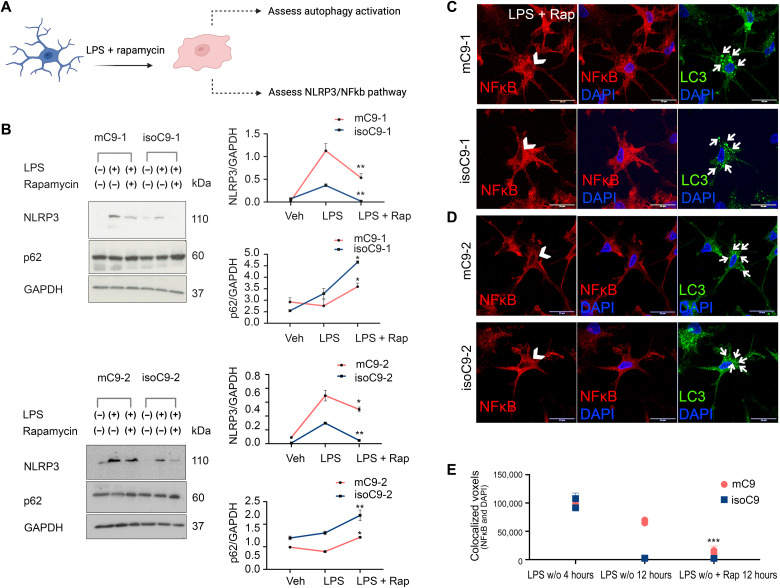
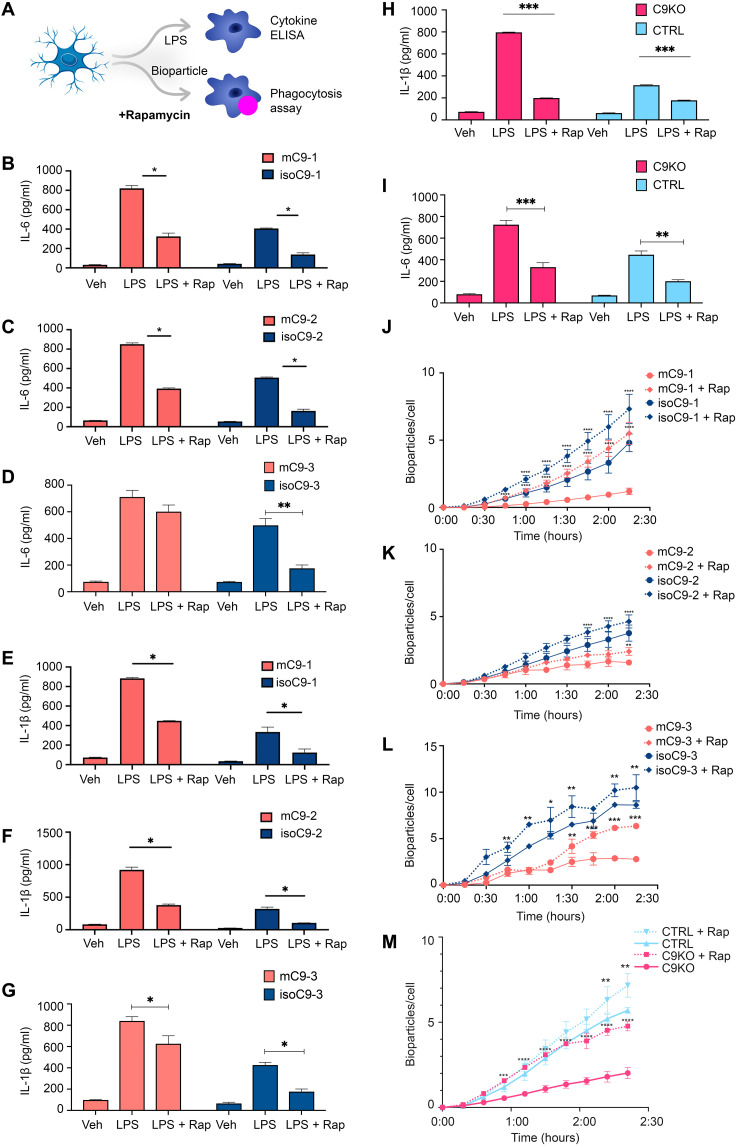
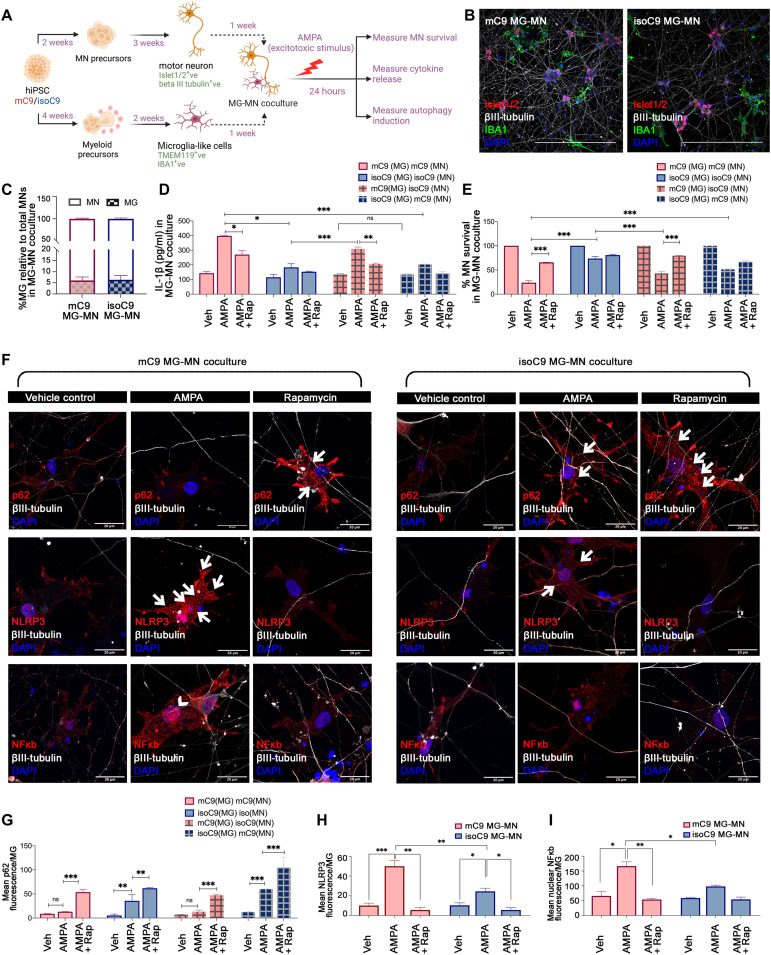
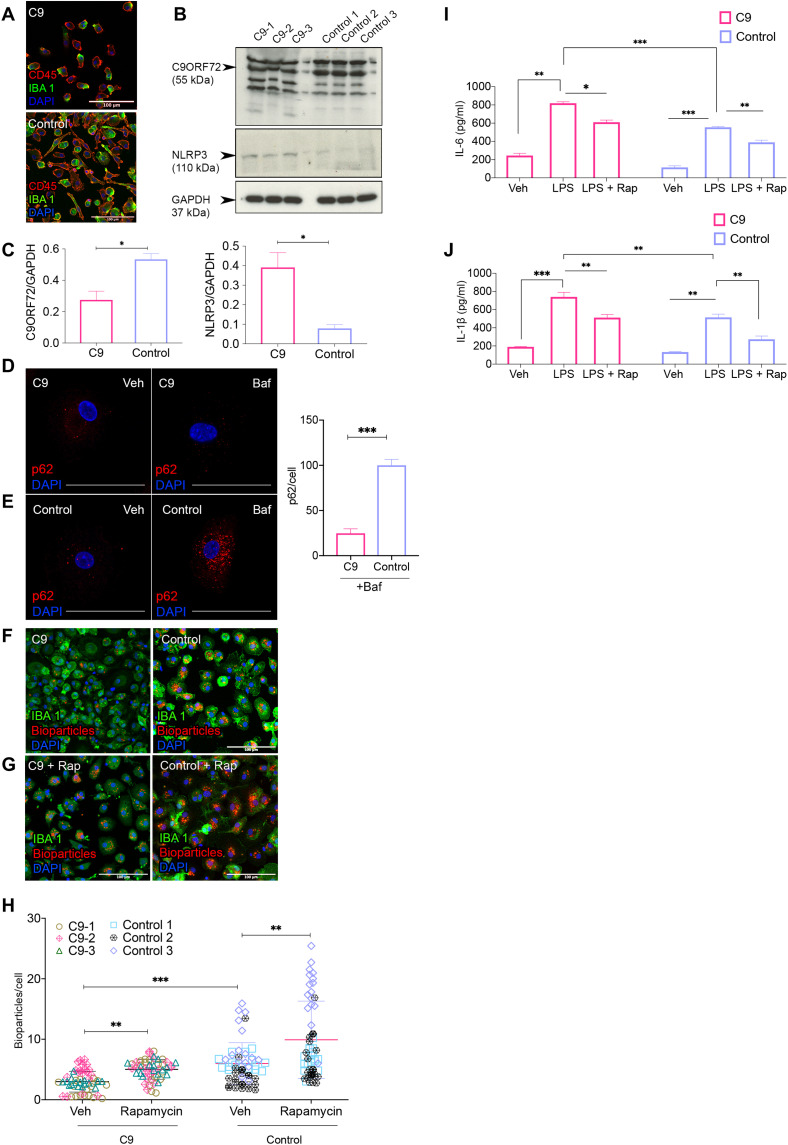
Although microglial activation is widely found in amyotrophic lateral sclerosis (ALS) and frontotemporal dementia (FTD), the underlying mechanism(s) are poorly understood. Here, using human-induced pluripotent stem cell-derived microglia-like cells (hiPSC-MG) harboring the most common ALS/FTD mutation (C9orf72, mC9-MG), gene-corrected isogenic controls (isoC9-MG), and C9orf72 knockout hiPSC-MG (C9KO-MG), we show that reduced C9ORF72 protein is associated with impaired phagocytosis and an exaggerated immune response upon stimulation with lipopolysaccharide. Analysis of the C9ORF72 interactome revealed that C9ORF72 interacts with regulators of autophagy and functional studies showed impaired initiation of autophagy in mC9-MG and C9KO-MG. Coculture studies with motor neurons (MNs) demonstrated that the autophagy deficit in mC9-MG drives increased vulnerability of mC9-MNs to excitotoxic stimulus. Pharmacological activation of autophagy ameliorated both cell-autonomous functional deficits in hiPSC-MG and MN death in MG-MN coculture. Together, these findings reveal an important role for C9ORF72 in regulating immune homeostasis and identify dysregulation in myeloid cells as a contributor to neurodegeneration in ALS/FTD.


Figures

Fig. 1.
Fig. 1.. Generation and characterization of microglia-like cells (hiPSC-MG) from C9orf72 mutant and isogenic iPSC lines.
(A) Schematic depicting stages, timeline, and key markers for the differentiation of microglia-like cells (hiPSC-MG) from hiPSCs. (B and C) Representative immunofluorescence images of mC9-MG and isoC9-MG demonstrating comparable staining of microglial markers: TMEM119 (red) IBA-1 (green) and P2Y12 (red) IBA1 (green) generated from three pairs of C9orf72 mutant and isogenic iPSC lines. Scale bars, 50 μm. DAPI, 4′,6-diamidino-2-phenylindole. (D) Bar graph representing the quantification of fluorescence intensity per hiPSC-MG for TMEM119 and P2Y12 across three pairs of mC9-MG and isoC9-MG. (E) Bar graphs representing the expression of MG signature genes (TMEM119, P2Y12, SALL1, and HEXB) in mC9-MG and isoC9-MG across three pairs. Data are represented as means ± SD; N = 3, where N represents the number of times experiments were performed using cells generated from independent iPSC differentiations.
Fig. 2.
Fig. 2.. mC9-MGs display impaired phagocytosis and heightened immune response following LPS stimulation.
(A) Schematic overview of the experimental paradigm for the assessment of microglial function—phagocytosis and immune response following LPS stimulation. ELISA, enzyme-linked immunosorbent assay. (B) Representative images of immunofluorescence staining showing phagocytosis assay performed with pH-sensitive zymosan bioparticles for three pairs of mC9-MG and isoC9-MG at 60 and 120 min [IBA-1 (green), zymosan bioparticles (red)]. Scale bars, 50 μm. (C) Graphs showing real-time imaging of zymosan bioparticle uptake at 15-min intervals, demonstrating a phagocytic deficit in mC9-MG when compared to isoC9-MGs across three pairs. Statistical analysis was performed across mC9-MG and isoC9-MG using two-way analysis of variance (ANOVA) and Tukey’s multiple comparisons test; data are represented as means ± SEM, N = 3 (*P < 0.05, **P < 0.01, ***P < 0.001, and ****P < 0.0001). (D to F) Graphs showing increased production of IL-6 and IL-1β in mC9-MG (red) compared to isoC9-MG (blue) following LPS stimulation, cells were treated with either LPS or 1× phosphate-buffered saline (PBS) [vehicle control (veh)]. Statistical analysis was performed using two-way ANOVA and Tukey’s multiple comparisons test, data are represented as means ± SD; N = 3 (*P < 0.05;, **P < 0.01, and ***P < 0.001). (G to J) Immunoblot with respective densitometric analysis showing the reduced abundance of C9ORF72 protein (~55 kDa) across three lines of mC9-MG (red) when compared to their respective isogenics (blue). Data are represented as means ± SD; N = 3. Statistical analysis was performed using Student’s t test (*P < 0.05, **P < 0.01, and ***P < 0.001). N across all experiments represents the number of times experiments were performed using cells generated from independent iPSC differentiations. GAPDH, glyceraldehyde-3-phosphate dehydrogenase.
Fig. 3.
Fig. 3.. C9KO-MG phenocopies functional deficits found in mC9-MG and mass spectrometric analysis of C9ORF72 interactome revealed its association with regulators of autophagy.
(A) Represents immune staining of C9KO-MG and CTRL-MG from the same genetic background confirming positive staining for microglial markers such as TMEM119 (red) and P2Y12 (red) along with IBA1 (green). Scale bars, 50 μm. (B) Bar graph representing equivalent fluorescence intensity per hiPSC-MG for TMEM119 and P2Y12 across C9KO-MG and CTRL-MG. (C) Bar graph representing the comparable expression of MG signature genes (TMEM119, P2Y12, SALL1, and HEXB) in C9KO-MG and CTRL-MG. Data are represented as means ± SD; N = 3. (D) Immunoblot validating loss of C9ORF72 protein (55 kDa) in C9KO-MG. (E) Representative images of immunofluorescence staining showing phagocytosis assay performed with pH-sensitive zymosan bioparticles for C9KO-MG and CTRL-MG at 120 min [IBA-1 (green), zymosan bioparticles (red)]. Scale bars, 50 μm. (F) Graph showing real-time imaging of zymosan bioparticle uptake at 15-min intervals, demonstrating a phagocytic deficit in C9KO-MG when compared to control (CTRL-MG). Statistical analysis was performed using two-way ANOVA and Tukey’s multiple comparisons test. Data are represented as means ± SEM (*P ≤ 0.05 and **P ≤ 0.01); N = 3. (G and H) Graphs demonstrating the increased production of IL-1β and IL-6 for C9KO-MGs following LPS stimulation; cells were treated with either LPS or 1× PBS [vehicle control (veh)]. Statistical analysis was performed using two-way ANOVA and Tukey’s multiple comparisons test. Data are represented as means ± SD; N = 3 (**P ≤ 0.01 and ***P ≤ 0.001). (G) Volcano plot demonstrating enrichment of C9ORF72 interactors at 1% false discovery rate (FDR) (dark red) and 5% FDR (light red). n = 4. (H) STRING network analysis of the C9ORF72 interactors (1% FDR); nodes represent the functional enrichment of the network. N for all experiments represents the number of times experiments were performed using cells generated from independent iPSC differentiations.
Fig. 4.
Fig. 4.. mC9-MG demonstrate a deficit in the initiation of autophagy.
(A) Representative images of immunofluorescence staining of p62- (left) and LC3- (right)–positive puncta after 6 hours of dimethyl sulfoxide (DMSO) (vehicle control) and bafilomycin (Baf) treatment. (B) Representative images of immunofluorescence staining showing p62 + ve puncta at 6 hours after bafilomycin treatment in C9KO-MG when compared to CTRL-MG. Scale bars, 50 μm. Right: Bar graph demonstrating a reduced number of p62 + ve puncta per cell in mC9-MG and C9KO-MG after 6 hours of bafilomycin treatment. Data are represented as means ± SD; N = 3 (n = 20 cells per genotype). Statistical analysis was performed using two-way ANOVA and Tukey’s multiple comparisons test. **P < 0.05, **P < 0.01, and ***P < 0.001. (C) Representative immunoblots (left) showing the reduced turnover of p62 (~60 kDa) and LC3-II (~15 kDa) in two pairs of mC9-MG and C9KO-MG compared to their respective isoC9-MG and CTRL-MG in the presence of bafilomycin at 2, 4, and 6 hours. Bar graphs (right) represent the densitometric quantification of p62 and LC3-II normalized to loading control glyceraldehyde-3-phosphate dehydrogenase(GAPDH). Data are represented as means ± SD; N = 3. Statistical analysis was performed across mC9-MG, isoC9-MG and C9KO-MG, and CTRL-MG at 2, 4, and 6 hours using two-way ANOVA and Sidak’s multiple comparisons test. *P < 0.05, **P < 0.01, ***P < 0.001, and ****P < 0.0001. (D) Representative images from live imaging of mcherry-EGFP-p62 dual-reporter probe transduced in two pairs of mC9-MG and isoC9-MG; white arrowhead in the inset represents autophagosomes (GFP+, mCherry+) and white asterisk represents autolysosomes (GFPmCherry+). Stacked bar graphs (right) demonstrating the quantification of autophagosomes and autolysosomes. Statistical analysis was performed using two-way ANOVA and Tukey’s multiple comparisons test for number of autophagosomes across mC9-MG and isoC9-MG. Data are represented as means ± SD; N = 3 [n(mC9-1 = 20 cells, mC9-2 = 18 cells, isoC9-1 = 20 cells, isoC9-2 = 20 cells)]; *P < 0.05. N represents the number of times experiments were performed using cells generated from independent iPSC differentiations.
Fig. 5.
Fig. 5.. Disrupted autophagy in mC9-MG results in inadequate attenuation of inflammasome activation and NF-κB signaling following LPS stimulation.
(A) Experimental paradigm for assessing NLRP3 inflammasome dynamics and NF-κB signaling following LPS stimulation. mC9-MG and isoC9-MG were treated with LPS (100 ng/ml) for 8 hours, and following LPS removal, whole-cell lysates were harvested at 4, 8, and 12 hours; cells were treated with either LPS or 1× PBS [vehicle control (veh)]. (B) Immunoblots showing immunoreactivity for NLRP3 (~110 kDa), p62 (~60 kDa), and corresponding line graphs depicting the densitometric quantification of NLRP3 and p62, normalized to GAPDH at 4, 8, and 12 hours demonstrating a sustained activation of NLRP3 and reduced p62 in mC9-MG. Data are represented as means ± SD for three independent experiments; statistical analysis across mC9-MG and isoC9-MG at 4, 8, and 12 hours was performed using two-way ANOVA and Sidak’s multiple comparisons test. *P < 0.05, **P < 0.01, and ***P < 0.001. (C) Representative images of immunofluorescence staining for NF-κB and LC3 demonstrating the dynamics of NF-κB signaling and autophagy activation respectively at 4 and 12 hours after LPS washout for three pairs of mC9-MG and isoC9-MG. The nuclear localization of NF-κB is indicative of activated NF-κB signaling, and the appearance of LC3 puncta indicates autophagy induction. The nuclear region is highlighted using white arrowheads, and the presence of LC3 puncta are indicated using small white arrows at the 12-hour time point. Scale bars, 20 μm. (D) Graphs show the quantification of colocalized voxels of NF-κB and DAPI demonstrating the sustained activation of NF-κB signaling in mC9-MG. Data are represented as means ± SD, N = 3. Data represent n = 20 cells across all genotypes. N represents the number of times experiments were performed using cells generated from independent iPSC differentiations.
Fig. 6.
Fig. 6.. Pharmacological activation of autophagy with rapamycin leads to the attenuation of NLRP3 inflammasome and NF-κB signaling in mC9-MG following LPS stimulation.
(A) Schematic showing the experimental setup wherein the cells were treated with rapamycin for 12 hours, during LPS washout, and were tested for activation of autophagy and state of NLRP3/NF-κB signaling. (B) Immunoblots and their quantification showing an increase in p62 level (~60 kDa) and a reduction in NLRP3 level (~110 kDa) across mC9-MG and isoC9-MG in the presence of rapamycin. The cells were either treated with vehicle (veh), LPS, or LPS + rapamycin (LPS + Rap). Statistical analysis was performed for LPS-primed mC9-MG and isoC9-MG across rapamycin-treated and rapamycin-untreated condition using two-way ANOVA and Sidak’s multiple comparisons test. *P < 0.05 and **P < 0.01. Data represent means ± SD across three independent experiments. (C and D) Representative images of immunofluorescence staining showing the reduction of nuclear localization of NF-κB in rapamycin-treated mC9-MG, demonstrating an attenuation of NF-κB signaling. The nuclear regions are indicated using white arrowheads and the concurrent increase in the appearance of LC3 puncta is highlighted using white arrows. Scale bars, 20 μm. (E) Quantification of the colocalized voxels of NF-κB and DAPI after rapamycin treatment. Data are represented as means ± SD; n = 20 cells across all genotypes. Statistical analysis was performed for mC9-MG and isoC9-MG across rapamycin-treated and -untreated condition in the presence of LPS at 12-hour time point using two-way ANOVA and Sidak’s multiple comparisons test. ***P < 0.001.
Fig. 7.
Fig. 7.. Pharmacological activation of autophagy with rapamycin ameliorates the sustained immune activation and phagocytic deficit in mC9-MG and C9KO-MG.
(A) Schematic showing the experimental setup wherein the cells are treated with rapamycin for 12 hours and tested for cytokine release and phagocytosis of zymosan bioparticles. (B to G) Cytokine ELISA of IL-6 and IL-1β demonstrates suppression of the production of proinflammatory cytokines in mC9-MG following rapamycin treatment. Cells were treated with either vehicle (veh), LPS, or LPS + rapamycin (LPS + Rap). Data are represented as means ± SD; statistical analysis was performed using two-way ANOVA and Sidak’s multiple comparisons test (*P ≤ 0.05); N = 3. (H and I) IL-1β and IL-6 ELISA demonstrates the amelioration of immune response in C9KO-MGs mirroring mC9-MGs as a result of rapamycin treatment; cells were treated with either vehicle (veh), LPS, or LPS + rapamycin. Data are represented as means ± SD; statistical analysis was performed using two-way ANOVA and Sidak’s multiple comparisons test. (**P < 0.01 and ***P < 0.001); N = 3. (J to M) Graph showing real-time imaging of zymosan bioparticle uptake assay demonstrating rapamycin-mediated amelioration of the phagocytic deficit in mC9-MGs and C9KO-MG; statistical analysis was performed across rapamycin-treated and rapamycin-untreated condition for all genotypes using two-way ANOVA and Tukey’s multiple comparisons test (*P <0.05, **P < 0.01, ***P < 0.001, and ****P < 0.0001) and error bars represent ± SEM; N = 3. N represents the number of times experiments were performed using cells generated from independent differentiations from iPSCs.
Fig. 8.
Fig. 8.. Disrupted autophagy in mC9-MG contributes to enhanced motor neuronal death following excitotoxic insult.
(A) Schematic showing protocol for coculture of iPSC-derived MG and MNs (MG-MNs) to assess the impact of MG on MN survival, induction of autophagy in MG and cytokine release following excitotoxic stimulus (AMPA). (B) Representative immunofluorescence images of IBA1 (green) βIII-tubulin (gray) and Islet1/2 (red) in MG-MN coculture. Scale bars, 50 μm. (C) Graph representing percentage of MG relative to total MN in MG-MN coculture. Data are represented as means ± SD; N = 3. (D) Graph representing production of IL-1β in MG-MN cocultures in vehicle-treated condition, following AMPA challenge and in the presence of rapamycin. Data are represented as means ± SD; N = 3; *P < 0.05, **P < 0.01, and ***P < 0.001; ns, not significant. (E) Graphs showing percentage survival of MNs in MG-MN cocultures in vehicle-treated condition, following AMPA treatment and in the presence of rapamycin. Data are represented as means ± SD; N = 3. ***P < 0.001. (F) Representative images of fluorescence staining for microglial p62/NLRP3/NF-κB across vehicle-treated, AMPA-treated conditions and in the presence of rapamycin in MG-MN coculture. White arrows indicate the cytoplasmic localization of p62 and NLRP3 staining and arrowheads indicate the nuclear localization of NF-κB staining. Scale bars, 20 μm. (G) Graph representing the quantification of mean fluorescence intensity of p62 per microglial cell across vehicle-treated, AMPA-treated conditions and in the presence of rapamycin in MG-MN coculture. (H and I) Graph representing the quantification of the mean fluorescence intensity of NLRP3/NF-κB per microglial cell across vehicle-treated, AMPA-treated conditions and in the presence of rapamycin in MG-MN coculture. Twenty microglial cells from three biological replicates have been analyzed per condition against each genotype. Data are represented as means ± SD; N = 3. *P < 0.05, **P < 0.01, and ***P < 0.001; ns, not significant. N represents number of times experiments were performed using cells generated from independent iPSC differentiations.
Fig. 9.
Fig. 9.. Blood-derived macrophages isolated from people with the C9orf72 mutation recapitulate deficits observed in mC9-MGs.
(A) Representative images of immunofluorescence staining for CD45 and IBA-1 in C9-carrier and control PBMC-derived macrophages. Scale bars, 100 μm. (B) Immunoblot and (C) densitometric quantification demonstrating the reduced abundance of C9ORF72 (~55 kDa) (graph, left) and increased levels of NLRP3 (~110 kDa) (graph, right), in three C9 macrophage samples compared to control macrophages. Data are represented as means ± SD, and statistical analysis was performed using Student’s t test. *P < 0.05. (D and E) Representative images of immunofluorescence staining of p62-positive puncta after 6 hours of DMSO (vehicle control) and bafilomycin treatment. Scale bars, 50 μm. Graph demonstrating significantly fewer p62-positive puncta in C9 macrophages compared to control; statistical analysis was performed by Student’s t test. (F and G) Representative images of immunofluorescence staining showing phagocytosis assay performed with pH-sensitive zymosan bioparticles in C9 macrophages and control macrophages at 120 min [IBA-1 (green) and zymosan bioparticles (red)]. Scale bars, 50 μm. (H) Quantification of the number of internalized zymosan bioparticles at 120 min in C9 macrophages and control macrophages showing reduced phagocytosis in C9 macrophages; statistical analysis was performed using two-way ANOVA and Tukey’s multiple comparisons test (**P < 0.01 and ***P < 0.001), and data represent means ± SD across the pooled data from three C9-ALS cases with age-/sex-matched control. (I and J) ELISA for proinflammatory cytokines (IL-6 and IL-1β) across C9 macrophages and control macrophages in unstimulated and LPS-stimulated condition in the presence and absence of rapamycin, demonstrating exaggerated immune response in C9 macrophages following LPS stimulation. Statistical analysis was performed using two-way ANOVA and Tukey’s multiple comparisons test (*P < 0.05, **P < 0.01, and ***P < 0.001). Data are represented as means ± SD.

Similar articles

Cited by

References

    1. O. Hardiman, L. H. van den Berg, M. C. Kiernan, Clinical diagnosis and management of amyotrophic lateral sclerosis. Nat. Rev. Neurol. 7, 639–649 (2011). - PubMed
    1. S.-C. Ling, M. Polymenidou, D. W. Cleveland, Converging mechanisms in ALS and FTD: Disrupted RNA and protein homeostasis. Neuron 79, 416–438 (2013). - PMC - PubMed
    1. M. DeJesus-Hernandez, I. R. Mackenzie, B. F. Boeve, A. L. Boxer, M. Baker, N. J. Rutherford, A. M. Nicholson, N. C. A. Finch, H. Flynn, J. Adamson, N. Kouri, A. Wojtas, P. Sengdy, G.-Y. R. Hsiung, A. Karydas, W. W. Seeley, K. A. Josephs, G. Coppola, D. H. Geschwind, Z. K. Wszolek, H. Feldman, D. S. Knopman, R. C. Petersen, B. L. Miller, D. W. Dickson, K. B. Boylan, N. R. Graff-Radford, R. Rademakers, Expanded GGGGCC hexanucleotide repeat in noncoding region of C9ORF72 causes chromosome 9p-linked FTD and ALS. Neuron 72, 245–256 (2011). - PMC - PubMed
    1. R. Balendra, A. M. Isaacs, C9orf72-mediated ALS and FTD: Multiple pathways to disease. Nat. Rev. Neurol. 14, 544–558 (2018). - PMC - PubMed
    1. Y. Zhang, K. Chen, S. A. Sloan, M. L. Bennett, A. R. Scholze, S. O'Keeffe, H. P. Phatnani, P. Guarnieri, C. Caneda, N. Ruderisch, S. Deng, S. A. Liddelow, C. Zhang, R. Daneman, T. Maniatis, B. A. Barres, J. Q. Wu, An RNA-sequencing transcriptome and splicing database of glia, neurons, and vascular cells of the cerebral cortex. J. Neurosci. 34, 11929–11947 (2014). - PMC - PubMed

MeSH terms