

Prevalence of refractive error in Portugal estimated from ophthalmic lens manufacturing data: Ten-years analysis
- PMID: 37083583
- PMCID: PMC10121041
- DOI: 10.1371/journal.pone.0284703
Prevalence of refractive error in Portugal estimated from ophthalmic lens manufacturing data: Ten-years analysis
Abstract
Purpose: To investigate the prevalence, distribution and trends of refractive error from ophthalmic lens manufacturing data over a ten-year period.
Methods: Fully anonymized data from ophthalmic lenses, for the years between 2010 and 2020, provided by the leading ophthalmic lens manufacturer operating in Portugal were analysed (no human participants were involved in the research). Prescriptions delivered were divided in single vision prescriptions and progressive/multifocal prescriptions and categorized into 14 spherical equivalent ranges. Given the lack of absolute values, indirect estimates and a qualitative analysis of the current situation and trends on refractive error epidemiology was carried out.
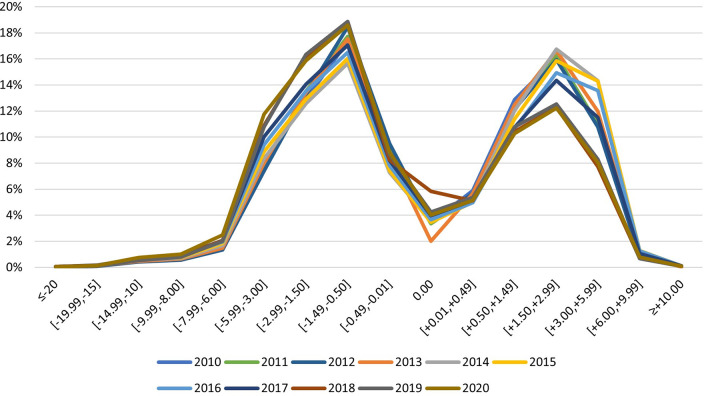
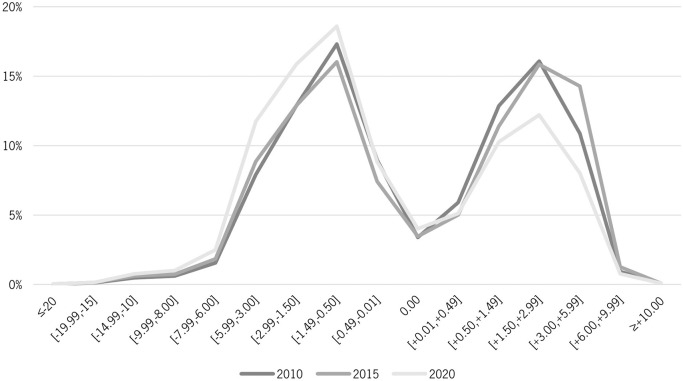
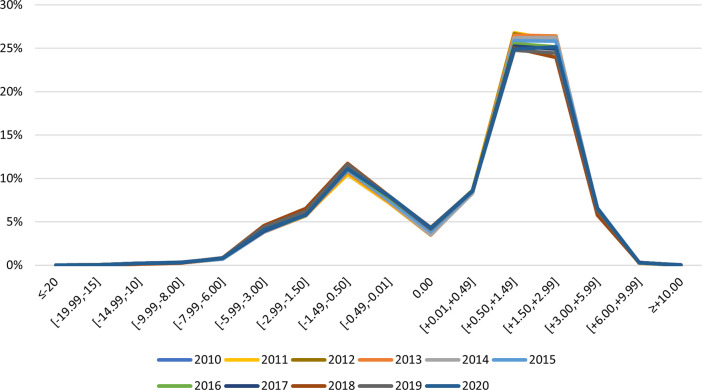
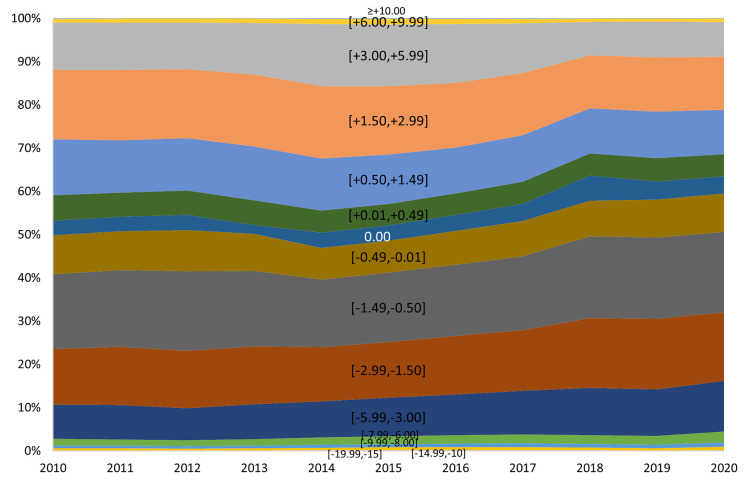
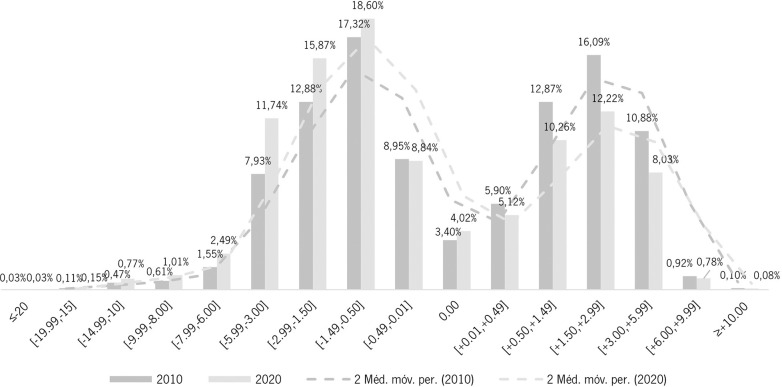
Results: Dataset from manufacturer comprises percentage values of ophthalmic lenses dispensed in Portugal. The distribution of ophthalmic prescriptions for single vision prescriptions presents most of the observations in the range [-1.49, -0.50] diopters, in every year from 2010 to 2020. For the progressive prescription's lenses, most of the observations is in an interval of two ranges, [0.50, 1.49] and [1.50, 2.99] diopters. From 2010 to 2020 the proportion of single vision ophthalmic lens prescriptions for myopia increased from 38.13% to 46.21%; the proportion for high myopia increased from 2.76% to 4.45%; and the proportion for hyperopia decreased from 40.85% to 31.36%.
Conclusions: Ophthalmic lens manufacturing data can be a valuable source for long-term analysis of refractive error prescription and trends over time. It was possible to observe a trend of increasing prevalence of myopia and high myopia from 40.89% in 2010 to 50.66% in 2020. That increase trend has important implications for public health and in the planning of services.
Copyright: © 2023 Alves Carneiro, González-Méijome. This is an open access article distributed under the terms of the Creative Commons Attribution License, which permits unrestricted use, distribution, and reproduction in any medium, provided the original author and source are credited.
Conflict of interest statement
The authors have declared that no competing interests exist.
Figures

References
-
- GBD 2019 Blindness and Vision Impairment Collaborators; Vision Loss Expert Group of the Global Burden of Disease Study. Causes of blindness and vision impairment in 2020 and trends over 30 years, and prevalence of avoidable blindness in relation to VISION 2020: The Right to Sight: An analysis for the Global Burden of Disease Study. Lancet Glob Health. 2021;9: e144–e160. doi: 10.1016/S2214-109X(20)30489-7 - DOI - PMC - PubMed
MeSH terms
LinkOut - more resources
Full Text Sources
Medical
