. 2023 Apr 21;19(4):e1010698.
doi: 10.1371/journal.pcbi.1010698. eCollection 2023 Apr.

Minor variations in multicellular life cycles have major effects on adaptation

Affiliations

Minor variations in multicellular life cycles have major effects on adaptation

Hanna Isaksson et al. PLoS Comput Biol. .

Abstract

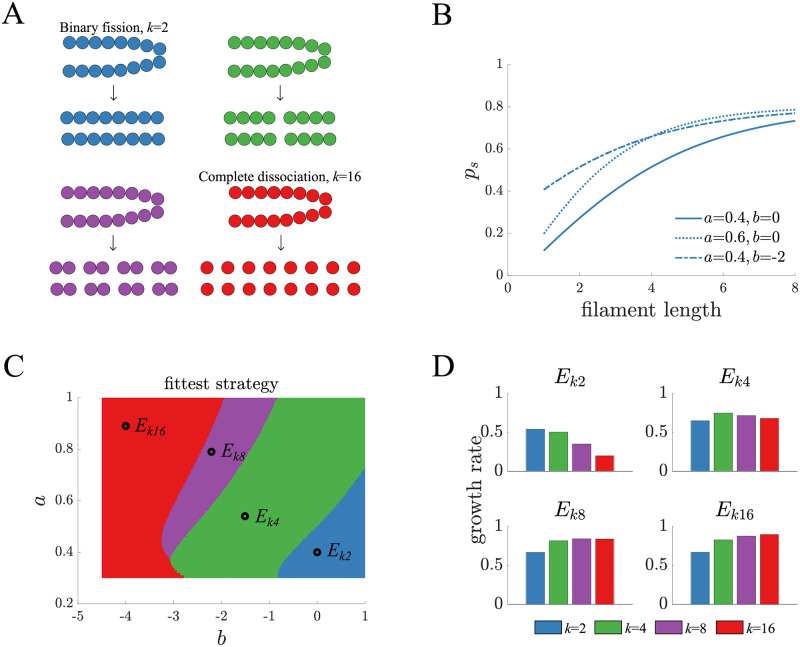
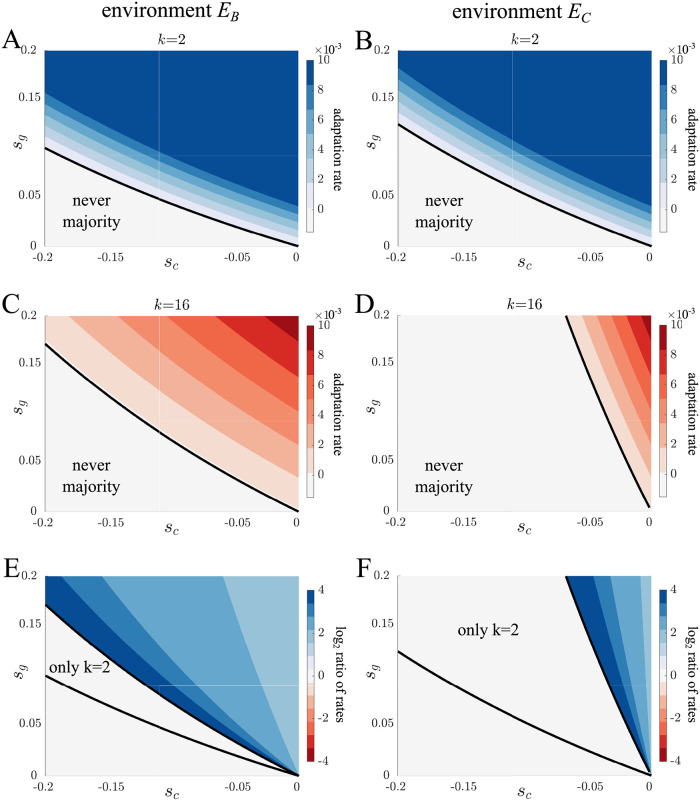
Multicellularity has evolved several independent times over the past hundreds of millions of years and given rise to a wide diversity of complex life. Recent studies have found that large differences in the fundamental structure of early multicellular life cycles can affect fitness and influence multicellular adaptation. Yet, there is an underlying assumption that at some scale or categorization multicellular life cycles are similar in terms of their adaptive potential. Here, we consider this possibility by exploring adaptation in a class of simple multicellular life cycles of filamentous organisms that only differ in one respect, how many daughter filaments are produced. We use mathematical models and evolutionary simulations to show that despite the similarities, qualitatively different mutations fix. In particular, we find that mutations with a tradeoff between cell growth and group survival, i.e. "selfish" or "altruistic" traits, spread differently. Specifically, altruistic mutations more readily spread in life cycles that produce few daughters while in life cycles producing many daughters either type of mutation can spread depending on the environment. Our results show that subtle changes in multicellular life cycles can fundamentally alter adaptation.


Conflict of interest statement

We the authors declare no competing interests.

Figures

Fig 1
Fig 1. Life cycle fitness across different environments.
A) A schematic shows the possible life cycles in which a filament fragments into a set of identical daughter filaments. The parameter k indicates the number of daughters and varies between 2 to 16. B) The survival function ps is shown for different values of parameters a and b. More specifically, a specifies the steepness of the curve i.e. how fast the survival benefit increases for larger filaments, and b defines the level of survival for unicelled daughters i.e. the value of ps(1). C) A fitness landscape shows the k that produces the fittest life cycle as a function of the two parameters a and b in the survival function. The color scheme is the same as in panel A and the dots indicate the parameter values shown in S8 Fig. D) The long term growth rate for the various life cycles are shown for each of the environments identified in panel C. Binary fission is the least fit life cycle in all environments except Ek2.
Fig 2
Fig 2. Adaptation and extinction rates for sc and sg mutations in isolation.
A) The time it takes for a mutant to spread from 0.1% to over 50% of the population in EB is shown for mutations with different values of sc (solid) and sg (dashed) in binary fission (blue) and complete dissociation (red) life cycles. The binary fission life cycle adapts faster for both types of mutations, as indicated by the shorter times for a mutant to become the majority. B) The plot is a companion to A) for the environment EC. The key difference is that sc mutations spread faster than sg mutations in the complete dissociation life cycle. They also spread faster than sc mutations in the binary fission life cycle but not sg mutations. C) The proportion of mutant lineages that go extinct in EB is shown as a function of the value of sg in binary fission (blue) and complete dissociation (red) life cycles. Each point is the mean of 10 samples of 10 simulations and the bars indicate standard deviation. For all values of sg, mutants go extinct more often in the binary fission life cycle. D) The plot is a companion to C) in the EC environment. Again mutants go extinct more often in the binary fission life cycle—indeed binary fission mutants with the highest value of sg go extinct more often than all complete dissociation mutants except when sg < < 0.
Fig 3
Fig 3. Adaptation via altruistic mutations.
A-D) Contour plots show the rate of adaptation as a function of the value of sc < 0 and sg > 0 for binary fission (blue) and complete dissociation (red) life cycles in EB and EC environments. The rate of adaptation corresponds to 1/t, where t is the time for the mutant population to exceed 50%. The black lines indicate the border where a mutation can spread. Altruistic mutations spread for a greater combination of sc and sg values in binary fission life cycles. Adaptation in complete dissociation life cycles varies more between environments with altruistic mutations spreading faster in the EB environment. E-F) Contour plots show the log ratio of adaptation rates for binary fission and complete dissociation life cycles in EB (panel E) and EC (panel F) environments. The blue region indicates mutations that spread faster in binary fission life cycles while the red region is the same but for complete dissociation life cycles. In both environments, all altruistic mutations spread faster in binary fission life cycles.
Fig 4
Fig 4. Adaptation via selfish mutations.
A-D) Contour plots show the rate of adaptation as a function of the value of sc > 0 and sg < 0 for binary fission (blue) and complete dissociation (red) life cycles in EB and EC environments. The rate of adaptation corresponds to 1/t, where t is the time for the mutant population to exceed 50%. The black lines indicate the border where a mutation can spread. Selfish mutations spread for a greater combination of sc and sg values in complete dissociation life cycles. Adaptation in complete dissociation life cycles varies more between environments with a greater spread in the EC environment. E-F) Contour plots show the log ratio of adaptation rates for binary fission and complete dissociation life cycles in EB (panel E) and EC (panel F) environments. The blue region indicates mutations that spread faster in binary fission life cycles while the red region is the same but for complete dissociation life cycles. All selfish mutations in the EC environment spread faster in the complete dissociation life cycle, but in the EB environment mutations can spread faster in either life cycle depending on the tradeoff between sc and sg.
Fig 5
Fig 5. Evolutionary simulations for populations in a serial passage experiment.
A-D) Each plot displays the average trait value of either sc or sg in 100 independent populations evolving in environment EB. All mutations have a tradeoff such that they are either selfish or altruistic. The thicker lines indicate the average trait value across populations. Both binary fission (blue) and complete dissociation (red) life cycles evolve a higher sg average at the expense of sc. E-H) These plots share a similar format with panels A)-D) and display trait evolution in the EC environment. Populations using complete dissociation evolve a selfish trait profile (bottom), while binary fission populations evolve an altruistic trait profile similar to their evolution in EB.
Fig 6
Fig 6. Average population trait values at the end of simulations.
A)-D) The average trait values for sc and sg are plotted for each independent population in Fig 5 for binary fission (blue) and complete dissociation (red) life cycles. Populations repeatedly evolved similar altruistic or selfish trait profiles. Although all mutations had a tradeoff with opposite signs for sc and sg, some populations were polymorphic which allowed both their average sc and sg values to be positive. Polymorphic populations are more common for life cycles in selective environments where the expected number of surviving daughter filaments is close to exp (1). E) A similar plot shows the results of evolving a k = 4 fragmentation life cycle in EC. Since k = 4 is intermediate, lying between binary fission and complete dissociation, its populations are more polymorphic. F) The proportion of selfish/altruistic mutants are shown over 50 transfers for the population indicated by an arrow in E. Altruistic and selfish mutants coexist and regularly swap places as constituting the majority of the population.

Similar articles

Cited by

References

    1. Schopf JW, Haugh BN, Molnar RE, Satterthwait DF. On the development of metaphytes and metazoans. Journal of Paleontology. 1973; p. 1–9.
    1. Stanley SM. An ecological theory for the sudden origin of multicellular life in the late Precambrian. Proceedings of the National Academy of Sciences. 1973;70(5):1486–1489. doi: 10.1073/pnas.70.5.1486 - DOI - PMC - PubMed
    1. Smith JM, Szathmary E. The major transitions in evolution. Oxford University Press; 1997.
    1. Bonner JT. The origins of multicellularity. Integrative Biology: Issues, News, and Reviews: Published in Association with The Society for Integrative and Comparative Biology. 1998;1(1):27–36. doi: 10.1002/(SICI)1520-6602(1998)1:1<27::AID-INBI4>3.0.CO;2-6 - DOI
    1. King N. The unicellular ancestry of animal development. Developmental cell. 2004;7(3):313–325. doi: 10.1016/j.devcel.2004.08.010 - DOI - PubMed

Publication types