

Calibrating agent-based models to tumor images using representation learning
- PMID: 37083821
- PMCID: PMC10156003
- DOI: 10.1371/journal.pcbi.1011070
Calibrating agent-based models to tumor images using representation learning
Abstract
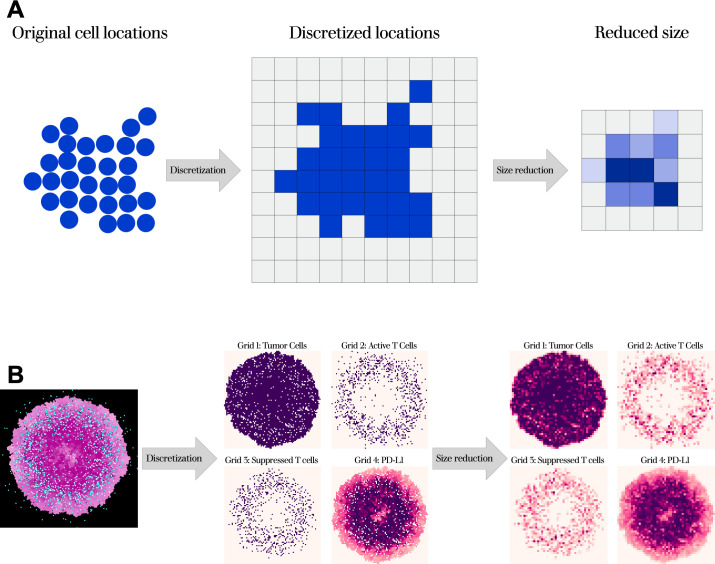
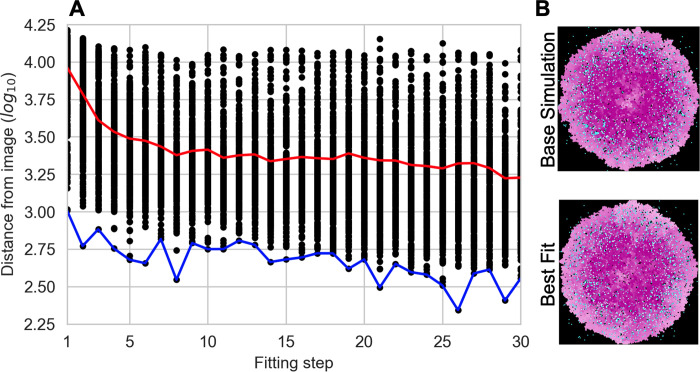
Agent-based models (ABMs) have enabled great advances in the study of tumor development and therapeutic response, allowing researchers to explore the spatiotemporal evolution of the tumor and its microenvironment. However, these models face serious drawbacks in the realm of parameterization - ABM parameters are typically set individually based on various data and literature sources, rather than through a rigorous parameter estimation approach. While ABMs can be fit to simple time-course data (such as tumor volume), that type of data loses the spatial information that is a defining feature of ABMs. While tumor images provide spatial information, it is exceedingly difficult to compare tumor images to ABM simulations beyond a qualitative visual comparison. Without a quantitative method of comparing the similarity of tumor images to ABM simulations, a rigorous parameter fitting is not possible. Here, we present a novel approach that applies neural networks to represent both tumor images and ABM simulations as low dimensional points, with the distance between points acting as a quantitative measure of difference between the two. This enables a quantitative comparison of tumor images and ABM simulations, where the distance between simulated and experimental images can be minimized using standard parameter-fitting algorithms. Here, we describe this method and present two examples to demonstrate the application of the approach to estimate parameters for two distinct ABMs. Overall, we provide a novel method to robustly estimate ABM parameters.
Copyright: © 2023 Cess, Finley. This is an open access article distributed under the terms of the Creative Commons Attribution License, which permits unrestricted use, distribution, and reproduction in any medium, provided the original author and source are credited.
Conflict of interest statement
The authors have no competing interests.
Figures


Similar articles
-
Connecting Agent-Based Models with High-Dimensional Parameter Spaces to Multidimensional Data Using SMoRe ParS: A Surrogate Modeling Approach.Bull Math Biol. 2023 Dec 30;86(1):11. doi: 10.1007/s11538-023-01240-6. Bull Math Biol. 2023. PMID: 38159216 Free PMC article.
-
Forecasting and Predicting Stochastic Agent-Based Model Data with Biologically-Informed Neural Networks.Bull Math Biol. 2024 Sep 23;86(11):130. doi: 10.1007/s11538-024-01357-2. Bull Math Biol. 2024. PMID: 39307859
-
Utilizing the Heterogeneity of Clinical Data for Model Refinement and Rule Discovery Through the Application of Genetic Algorithms to Calibrate a High-Dimensional Agent-Based Model of Systemic Inflammation.Front Physiol. 2021 May 19;12:662845. doi: 10.3389/fphys.2021.662845. eCollection 2021. Front Physiol. 2021. PMID: 34093225 Free PMC article.
-
Introduction of an agent-based multi-scale modular architecture for dynamic knowledge representation of acute inflammation.Theor Biol Med Model. 2008 May 27;5:11. doi: 10.1186/1742-4682-5-11. Theor Biol Med Model. 2008. PMID: 18505587 Free PMC article.
-
A narrative review of the use of agent-based modeling in health behavior and behavior intervention.Transl Behav Med. 2019 Nov 25;9(6):1065-1075. doi: 10.1093/tbm/iby132. Transl Behav Med. 2019. PMID: 30649559 Review.
Cited by
-
A seven-step guide to spatial, agent-based modelling of tumour evolution.Evol Appl. 2024 May 2;17(5):e13687. doi: 10.1111/eva.13687. eCollection 2024 May. Evol Appl. 2024. PMID: 38707992 Free PMC article. Review.
-
Agent-based modeling in cancer biomedicine: applications and tools for calibration and validation.Cancer Biol Ther. 2024 Dec 31;25(1):2344600. doi: 10.1080/15384047.2024.2344600. Epub 2024 Apr 28. Cancer Biol Ther. 2024. PMID: 38678381 Free PMC article. Review.
-
Dysregulated FGFR3 signaling alters the immune landscape in bladder cancer and presents therapeutic possibilities in an agent-based model.Front Immunol. 2024 Mar 7;15:1358019. doi: 10.3389/fimmu.2024.1358019. eCollection 2024. Front Immunol. 2024. PMID: 38515743 Free PMC article.
-
Merging Metabolic Modeling and Imaging for Screening Therapeutic Targets in Colorectal Cancer.bioRxiv [Preprint]. 2024 Dec 5:2024.05.24.595756. doi: 10.1101/2024.05.24.595756. bioRxiv. 2024. Update in: NPJ Syst Biol Appl. 2025 Jan 28;11(1):12. doi: 10.1038/s41540-025-00494-1. PMID: 38826317 Free PMC article. Updated. Preprint.
-
Merging metabolic modeling and imaging for screening therapeutic targets in colorectal cancer.NPJ Syst Biol Appl. 2025 Jan 28;11(1):12. doi: 10.1038/s41540-025-00494-1. NPJ Syst Biol Appl. 2025. PMID: 39875420 Free PMC article.
References
-
- Van Liedekerke P, Palm M, Jagiella N, Drasdo D. Simulating tissue mechanics with agent-based models: concepts, perspectives and some novel results. Comput Part Mech. 2015;2: 401–444.
Publication types
MeSH terms
LinkOut - more resources
Full Text Sources
Medical
