. 2023 Apr 21;18(4):e0284744.
doi: 10.1371/journal.pone.0284744. eCollection 2023.

MicroRNA-708 emerges as a potential candidate to target undruggable NRAS

Affiliations

MicroRNA-708 emerges as a potential candidate to target undruggable NRAS

Jia Meng Pang et al. PLoS One. .

Abstract

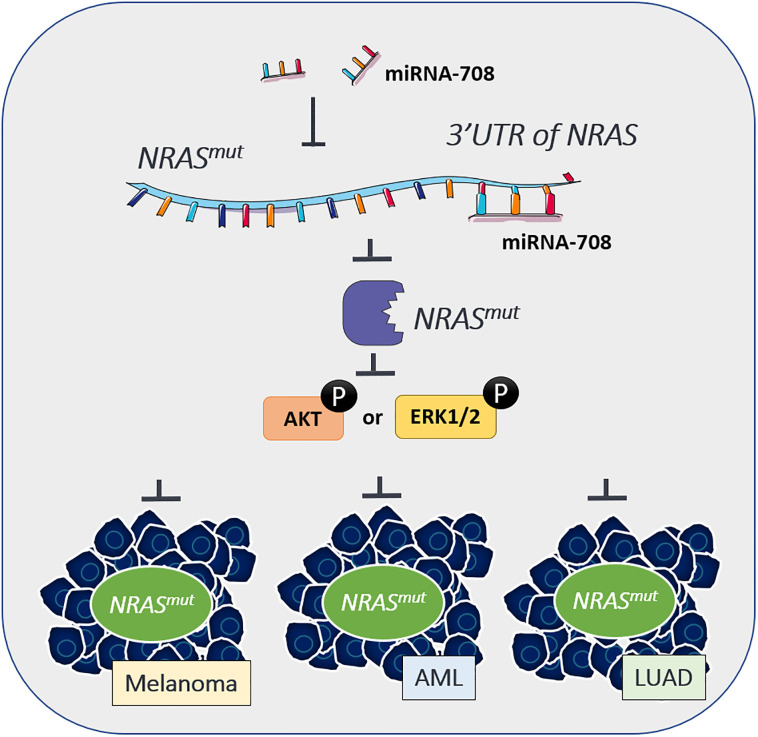
RAS, the most frequently mutated oncogene that drives tumorigenesis by promoting cell proliferation, survival, and motility, has been perceived as undruggable for the past three decades. However, intense research in the past has mainly focused on KRAS mutations, and targeted therapy for NRAS mutations remains an unmet medical need. NRAS mutation is frequently observed in several cancer types, including melanoma (15-20%), leukemia (10%), and occasionally other cancer types. Here, we report using miRNA-708, which targets the distinct 3' untranslated region (3'UTR) of NRAS, to develop miRNA-based precision medicine to treat NRAS mutation-driven cancers. We first confirmed that NRAS is a direct target of miRNA-708. Overexpression of miRNA-708 successfully reduced NRAS protein levels in melanoma, leukemia, and lung cancer cell lines with NRAS mutations, resulting in suppressed cell proliferation, anchorage-independent growth, and promotion of reactive oxygen species-induced apoptosis. Consistent with the functional data, the activities of NRAS-downstream effectors, the PI3K-AKT-mTOR or RAF-MEK-ERK signaling pathway, were impaired in miR-708 overexpressing cells. On the other hand, cell proliferation was not disturbed by miRNA-708 in cell lines carrying wild-type NRAS. Collectively, our data unveil the therapeutic potential of using miRNA-708 in NRAS mutation-driven cancers through direct depletion of constitutively active NRAS and thus inhibition of its downstream effectors to decelerate cancer progression. Harnessing the beneficial effects of miR-708 may therefore offer a potential avenue for small RNA-mediated precision medicine in cancer treatment.


Conflict of interest statement

The authors have declared that no competing interests exist.

Figures

Fig 1
Fig 1. NRAS is the direct target of miR-708.
(A) Cancer cell lines with NRAS mutation used in this study. (B) Left: Representative Western blot of NRAS protein expression in SK-MEL-2, THP-1, and H1299 cells transfected with mock, scrambled control (s.c.), and precursor miR-708 (pre-miR-708) for 48 h. Right: quantitative analysis of NRAS protein level, normalized with actin. Histogram represents normalized means ± SEM (n = 3 biological replicates). (C) Expression of NRAS mRNA in SK-MEL-2 cells transfected mock, s.c., and pre-miR-708. Data represent normalized means ± SD (n = 3 biological replicates). (D) Luciferase reporter assays showing luciferase activities in the pGL3 construct conjugated with NRAS 3’UTR (wild type or mutant form) by SK-MEL-2 transfected with pre-miR-708 or s.c. Left: the sequence of miR-708 and the potential miR-708 binding site on NRAS 3’UTR. Nucleotides mutated in miR-708 binding sites are shown in red. Right: data represent normalized means ± SD (n = 3 biological replicates). One-way ANOVA followed by Tukey’s post-hoc test (B and C) and student’s t-test (two-tailed) (D) were used for the statistical test (*p<0.05, **p<0.01, ***p<0.001, ****p<0.0001).
Fig 2
Fig 2. MicroRNA-708 inhibits proliferation, anchorage-independent growth, motility, and cell survival in NRAS-mutated cancer cells.
(A) Clonogenic assay of SK-MEL-2 cells transfected with mock, s.c., and pre-miR-708. Left: representative images of SK-MEL-2 cells are shown. Right: histogram represents the fold change of mean ± SD (n = 3 biological replicates) relative to mock. (B) Soft agar colony formation assay was performed in SK-MEL-2 cells expressing mock, s.c., miR-708. Left: the representative images of SK-MEL-2. Right: the number and size of colonies were quantified and expressed as averaged fold increase compared to mock (n = 3 biological replicates). Scale bars: 200 μm (C) SK-MEL-2 cells expressing mock, s.c., miR-708 were subjected to transwell cell migration and invasion assay. Left: the representative images of migration and invasion. Scale bars: 200 μm. Right: the quantitative results of migration and invasion assay. Data are fold changes ± SD (n = 3 biological replicates) relative to mock. (D) Apoptosis of SK-MEL-2 cells overexpressing mock, s.c. and miR-708. Cells were incubated with 200 μM of H2O2 for 24 h and then examined by Annexin V/7-AAD staining through flow cytometry analysis. The apoptotic rate was represented by the percentage of Annexin V positive cells and then normalized with mock. Data are fold changes ± SD (n = 3 biological replicates) relative to mock. (A-D) One-way ANOVA followed by Tukey’s post-hoc test was used for all statistical tests (*p<0.05, **p<0.01, ***p<0.001, ****p<0.0001).
Fig 3
Fig 3. MicroRNA-708 impairs cell proliferation through NRAS-mediated pathway.
(A) Left: Western blot analysis of SK-MEL-2 cells transfected with mock, s.c., siNRAS-1, and siNRAS-2. Right: quantitative analysis of NRAS protein levels, normalized with GAPDH level. Histogram show normalized mean ± SEM (n = 3 biological replicates) (B) Clonogenic assay of SK-MEL-2 cells transfected with mock, s.c., siNRAS-1, and siNRAS-2. Left: representative images of SK-MEL-2 cells are shown. Right: histogram represents the fold change of mean ± SD (n = 3 biological replicates) relative to mock. (C) Soft agar colony formation assay was performed in SK-MEL-2 cells expressing mock, s.c., siNRAS-1 and siNRAS-2. Left: the representative images of SK-MEL-2 cells in soft agar colony formation assay. Scale bars: 200 μm. Right: the number and size of colonies were quantified and expressed as averaged fold increase compared to mock ± SD (n = 3 biological replicates). (D) SK-MEL-2 cells expressing mock, s.c., siNRAS-1 and siNRAS-2 were subjected to transwell cell migration and invasion assay. Left: the representative images of migration and invasion. Right: the quantitative results of migration and invasion assay. Scale bars: 200 μm. Data are the fold increase of means ± SD (n = 3 biological replicates) relative to mock. (E) Apoptosis of SK-MEL-2 cells overexpressing mock, s.c., siNRAS-1 and siNRAS-2. Cells were treated with 200 μM H2O2 24 hours post-transfection and incubated for another 24 hours. The cells were then co-stained with Annexin V/7-AAD and subjected to flow cytometry analysis. The apoptotic rate was represented by the percentage of Annexin V positive cells and then normalized with mock. Data are fold changes ± SD (n = 3 biological replicates) relative to mock. (F) Left panel: Total cell lysate of SK-MEL-2, THP-1, and H1299 cells transfected with miR-708 and s.c. were collected and subjected to Western blotting to analyze the level of phosphorylation of AKT (pAKT) and ERK-1/2 (pERK-1/2), total AKT, total ERK-1/2, and NRAS. Right panel: The pAKT and pERK1/2 levels were quantified and normalized to total AKT and total Erk1/2 levels. Data presented as normalized mean ± SEM (n = 3 biological replicates). (A-F) One-way ANOVA followed by Tukey’s post-hoc test was used for all statistical tests (*p<0.05, **p<0.01, ***p<0.001, ****p<0.0001).
Fig 4
Fig 4. MicroRNA-708 fails to inhibit proliferation in cells with wild-type NRAS.
(A) Left: Representative Western blot of NRAS protein expression in MDA-MB-231 cells transfected with mock, s.c., and pre-miR-708 for 48 h. Right: quantitative analysis of NRAS protein level, normalized with GAPDH. Histogram represents normalized means ± SEM (n = 3 biological replicates). (B) Clonogenic assay of MDA-MB-231 cells transfected with mock, s.c., and pre-miR-708. Left: representative images are shown. Right: histogram represents the fold change of mean ± SD (n = 3 biological replicates) relative to mock. (C) Left: Representative Western blot of NRAS protein expression in A549 cells transfected with mock, s.c., and pre-miR-708 for 48 h. Right: quantitative analysis of NRAS protein level, normalized with GAPDH. Histogram represents normalized means ± SEM (n = 3 biological replicates). (D) Clonogenic assay of A549 cells transfected with mock, s.c., and pre-miR-708. Left: representative images are shown. Right: histogram represents the fold change of mean ± SD (n = 3 biological replicates) relative to mock. (E) Left: Representative Western blot of NRAS protein expression in BEAS-2B cells transfected with mock, s.c., and pre-miR-708 for 48 h. Right: quantitative analysis of NRAS protein level, normalized with GAPDH. Histogram represents normalized means ± SEM (n = 3 biological replicates). (F) Clonogenic assay of BEAS-2B cells transfected with mock, s.c., and pre-miR-708. Left: representative images are shown. Right: histogram represents the fold change of mean ± SD (n = 3 biological replicates) relative to mock. (A-F) One-way ANOVA followed by Tukey’s post-hoc test was used for the statistical test (*p<0.05, **p<0.01, ***p<0.001, ns: not significant).
Fig 5
Fig 5. MicroRNA-708 showed moderate survival benefits in NRAS-mutated cancer patients.
Retrospective analysis of Kaplan-Meier plots for miR-708 expression in association with overall survival. (A) 119 patients with Skin Cutaneous Melanoma (SKCM) carrying NRAS simple somatic mutation (#SSM). (B) 437 patients in all SKCM. (C) 11 patients from Acute Myeloid Leukemia (LAML) with NRAS #SSM. (D) 162 patients in all LAML. (E) 10 patients from Lung Adenocarcinoma with NRAS #SSM. (F) 508 patients in all LUAD. Patients were split into high and low expression groups based on the median expression of the miR-708. The log-rank test was used for the statistical analysis.
Fig 6
Fig 6. Working model of miR-708 suppresses cancer progression in NRAS mutated cancers.
Expression of miR-708 depletes NRAS and impairs downstream PI3K/AKT/mTOR or RAF/MEK/ERK activation, resulting in the suppression of cell proliferation, anchorage-independent growth, and enhanced reactive oxygen species-induced apoptosis in NRAS-mutation driven cancer cells. MicroRNA-708 possesses the potential to be developed as the targeted therapy for NRAS mutant melanoma, AML, LUAD et cetera.

References

    1. Simanshu DK, Nissley DV, McCormick F. RAS proteins and their regulators in human disease. Cell. 2017;170(1):17–33. doi: 10.1016/j.cell.2017.06.009 - DOI - PMC - PubMed
    1. Prior IA, Lewis PD, Mattos C. A comprehensive survey of Ras mutations in cancer. JCr 2012;72(10):2457–67. doi: 10.1158/0008-5472.CAN-11-2612 - DOI - PMC - PubMed
    1. Li S, Balmain A, Counter CM. A model for RAS mutation patterns in cancers: finding the sweet spot. Nature Reviews Cancer. 2018;18(12):767–77. doi: 10.1038/s41568-018-0076-6 - DOI - PubMed
    1. Pylayeva-Gupta Y, Grabocka E, Bar-Sagi D. RAS oncogenes: weaving a tumorigenic web. Nature Reviews Cancer. 2011;11(11):761–74. doi: 10.1038/nrc3106 - DOI - PMC - PubMed
    1. Tsuchida N, Murugan AK, Grieco M. Kirsten Ras oncogene: Significance of its discovery in human cancer research. Oncotarget. 2016;7(29):46717. doi: 10.18632/oncotarget.8773 - DOI - PMC - PubMed

Publication types