. 2023 Jul 1;72(7):999-1011.
doi: 10.2337/db22-0962.

Hematopoietic NLRP3 and AIM2 Inflammasomes Promote Diabetes-Accelerated Atherosclerosis, but Increased Necrosis Is Independent of Pyroptosis

Affiliations

Hematopoietic NLRP3 and AIM2 Inflammasomes Promote Diabetes-Accelerated Atherosclerosis, but Increased Necrosis Is Independent of Pyroptosis

Cheng-Chieh Hsu et al. Diabetes. .

Abstract

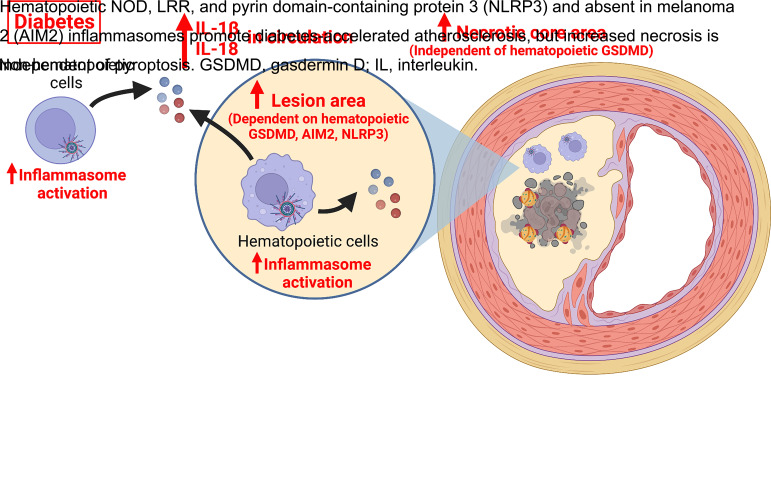
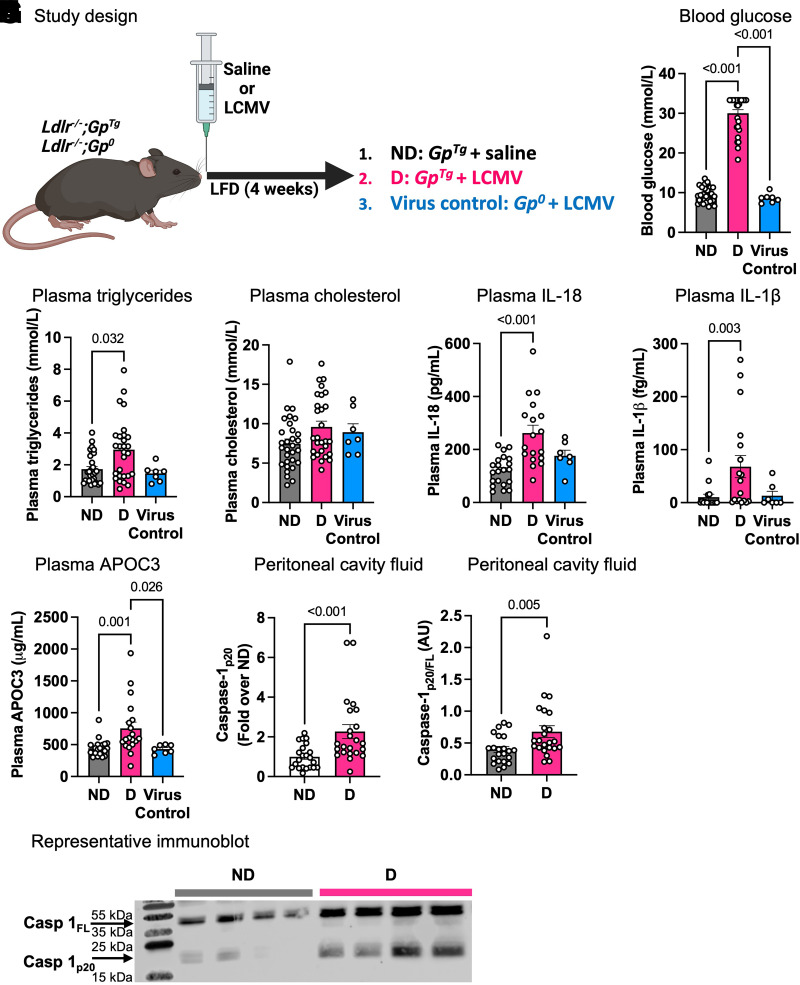
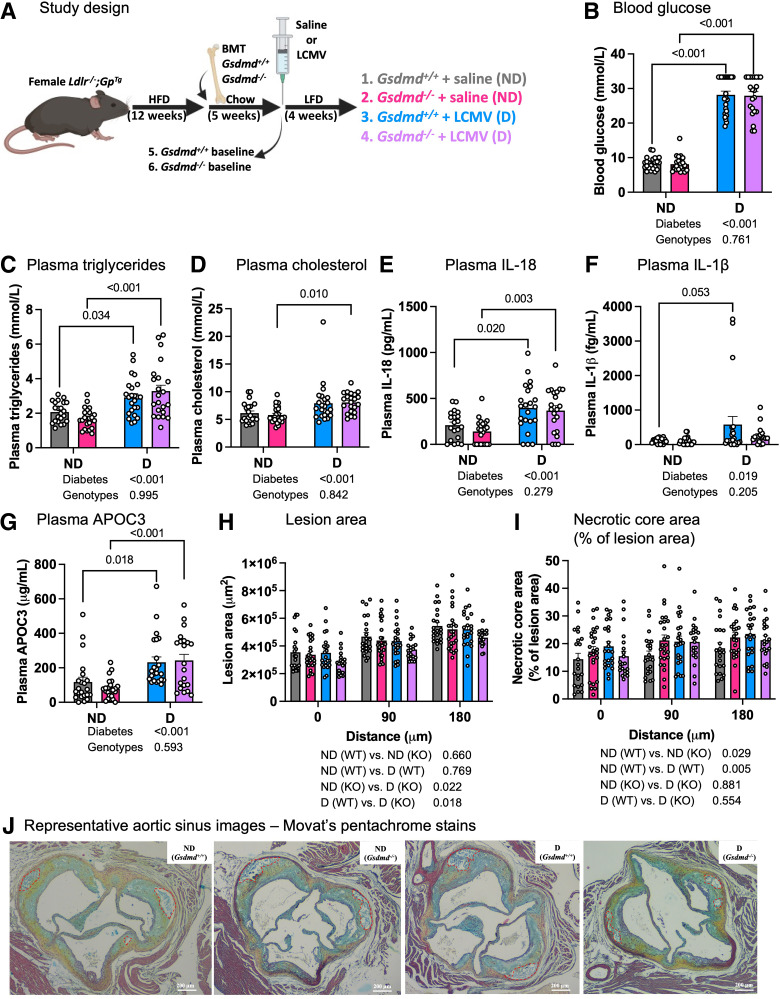
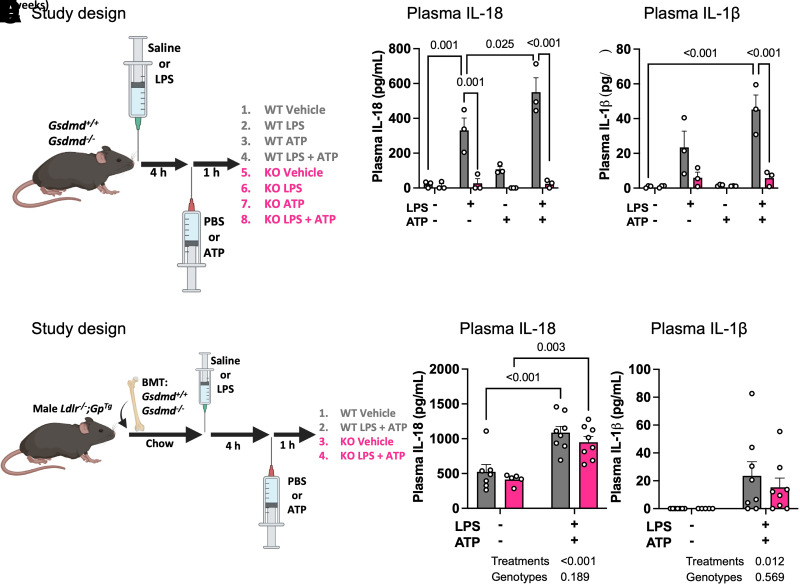
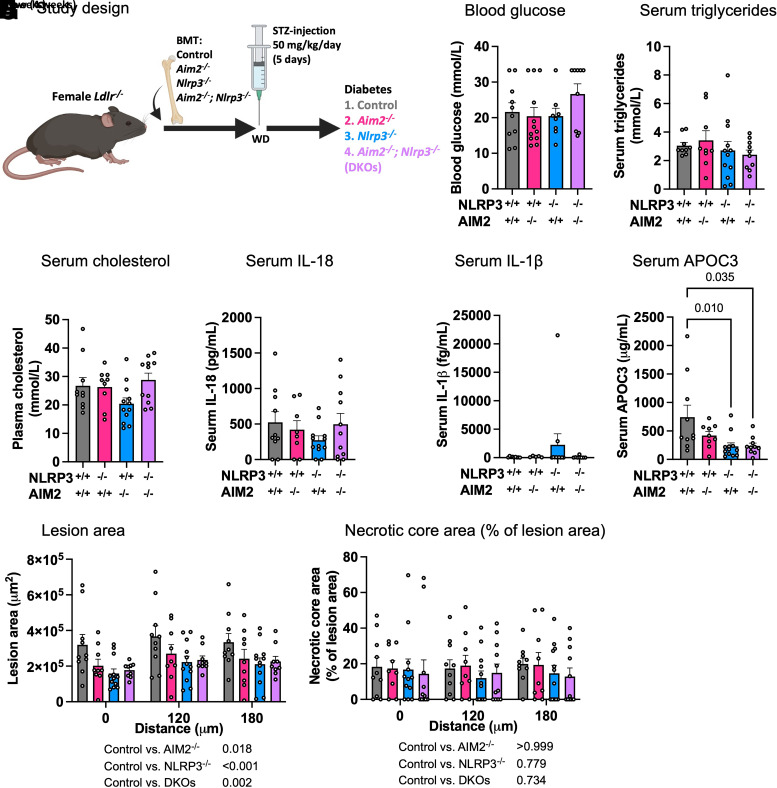
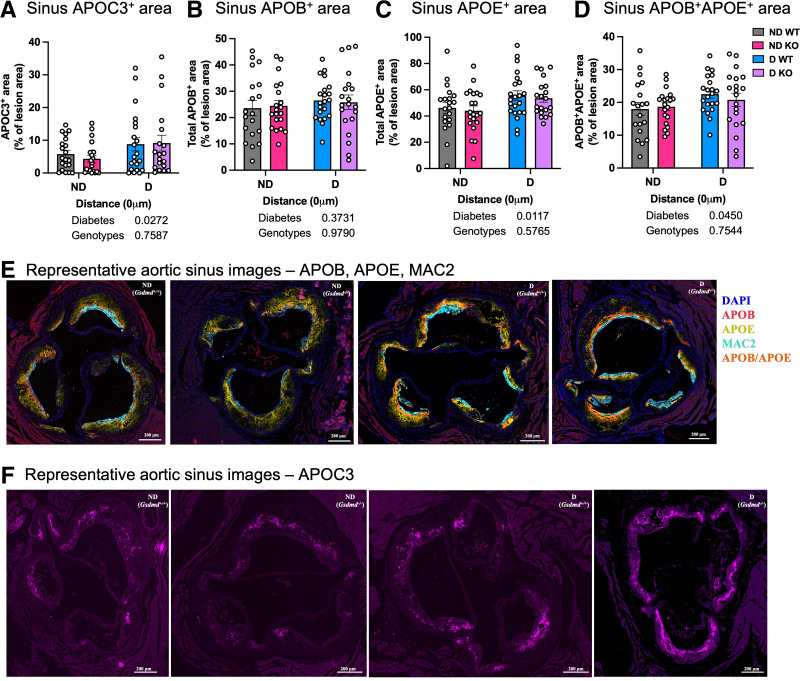
Serum apolipoprotein C3 (APOC3) predicts incident cardiovascular events in people with type 1 diabetes, and silencing of APOC3 prevents both lesion initiation and advanced lesion necrotic core expansion in a mouse model of type 1 diabetes. APOC3 acts by slowing the clearance of triglyceride-rich lipoproteins, but lipid-free APOC3 has recently been reported to activate an inflammasome pathway in monocytes. We therefore investigated the contribution of hematopoietic inflammasome pathways to atherosclerosis in mouse models of type 1 diabetes. LDL receptor-deficient diabetes mouse models were transplanted with bone marrow from donors deficient in NOD, LRR and pyrin domain-containing protein 3 (NLRP3), absent in melanoma 2 (AIM2) or gasdermin D (GSDMD), an inflammasome-induced executor of pyroptotic cell death. Mice with diabetes exhibited inflammasome activation and consistently, increased plasma interleukin-1β (IL-1β) and IL-18. Hematopoietic deletions of NLRP3, AIM2, or GSDMD caused smaller atherosclerotic lesions in diabetic mice. The increased lesion necrotic core size in diabetic mice was independent of macrophage pyroptosis because hematopoietic GSDMD deficiency failed to prevent necrotic core expansion in advanced lesions. Our findings demonstrate that AIM2 and NLRP3 inflammasomes contribute to atherogenesis in diabetes and suggest that necrotic core expansion is independent of macrophage pyroptosis.

Article highlights: The contribution of hematopoietic cell inflammasome activation to atherosclerosis associated with type 1 diabetes is unknown. The goal of this study was to address whether hematopoietic NOD, LRR, and pyrin domain-containing protein 3 (NLRP3), absent in melanoma 2 (AIM2) inflammasomes, or the pyroptosis executioner gasdermin D (GSDMD) contributes to atherosclerosis in mouse models of type 1 diabetes. Diabetic mice exhibited increased inflammasome activation, with hematopoietic deletions of NLRP3, AIM2, or GSDMD causing smaller atherosclerotic lesions in diabetic mice, but the increased lesion necrotic core size in diabetic mice was independent of macrophage pyroptosis. Further studies on whether inflammasome activation contributes to cardiovascular complications in people with type 1 diabetes are warranted.


Conflict of interest statement

Duality of Interest. K.E.B. serves on a scientific advisory board of Esperion Therapeutics. A.R.T. is a consultant or scientific advisory board member of Staten Biotechnology, 1016 Bio, Commonwealth Serum Laboratories, and Beren Pharmaceuticals. No other potential conflicts of interest relevant to this article were reported.

Figures

None
Graphical abstract
Figure 1
Figure 1
Diabetes leads to elevated plasma triglycerides, APOC3, and inflammasome signatures. Female Ldlr−/−;GpTg mice were rendered diabetic (D) with LCMV. Saline was used as a control (nondiabetic [ND]). Ldlr−/−;Gp0 mice were injected with LCMV as a virus control. At the onset of diabetes, the animals were switched to a semipurified LFD with no added cholesterol and maintained for 4 weeks. A: Schematic of the study design. B: Blood glucose levels. Glucose values >33.3 mmol/L are expressed as 33.3 mmol/L. C: Plasma triglyceride levels. D: Plasma cholesterol levels. E: Plasma IL-18 levels. F: Plasma IL-1β levels. G: Plasma APOC3. H and I: Peritoneal cavity fluid was immunoblotted for cleaved caspase-1 (Casp 1p20) and cleaved caspase-1 over full-length caspase-1 (Casp 1p20/Casp 1FL). J: Representative immunoblot. The number of individual mice per group was 7–30. Normality tests were performed using the D’Agostino and Pearson test. Statistical analyses were performed using Kruskal-Wallis test and Dunn multiple comparisons test in BD, F, and G, one-way ANOVA followed by Tukey multiple comparisons test in E, and Mann-Whitney U test in H and I. Outliers were removed based on Grubbs test with α = 0.01: (1,0,0) data points were removed in F, (0,1) data points were removed in H, (0,1) data points were removed in I, and no data points were removed in BE and G. AU, arbitrary unit.
Figure 2
Figure 2
Hematopoietic GSDMD deficiency does not prevent the effect of diabetes on lesion necrotic core expansion. Female Ldlr−/−;GpTg mice were maintained on an HFD for 12 weeks to allow the formation of preexisting lesions. The mice were then lethally irradiated and received bone marrow cells from animals with and without GSDMD deficiency. The animals were maintained on a chow diet and recovered for 5 weeks. Mice were rendered diabetic (D) with LCMV. Saline was used as a control (nondiabetic [ND]). At the onset of diabetes, the animals were switched to a semipurified LFD with no added cholesterol and maintained for 4 weeks. A subset of animals was euthanized after 5 weeks of recovery to evaluate lesion morphology before diabetes (baseline). A: Schematic of the study design. B: Blood glucose levels. Glucose values >33.3 mmol/L are expressed as 33.3 mmol/L. C: Plasma triglyceride levels. D: Plasma cholesterol levels. E: Plasma IL-18 levels. F: Plasma IL-1β levels. G: Plasma APOC3 levels. H: Aortic sinus lesion area; 0 μm represents the first appearance of the three aortic valve leaflets. I: Aortic sinus percent necrotic core area calculated as necrotic core area / lesion area. J: Representative aortic sinus lesions stained with Movat pentachrome stain. Representative necrotic core areas are circled in red. Data are mean ± SEM (n = 19–25 mice/group). Statistical analyses were performed by two-way ANOVA followed by Tukey multiple comparisons test. In BG, lines between two groups indicate P values calculated by multiple comparisons test, and the text underneath the graphs indicates overall group effects (P values) as calculated by two-way ANOVA. In H and I, the text underneath the graphs indicates group effects (P values) as calculated by the multiple comparisons test. Outliers were removed based on Grubbs test with α = 0.01: (0,0,1,0) data points were removed in D, (0,0,1,1) data points were removed in F, (0,0,1,0) data points were removed in G, (0,0,0,0,0,0,0,1,1,1,0,1) data points were removed in H, and no data points were removed in B, C, E, and I. BMT, bone marrow transplant; KO, knockout; WT, wild type.
Figure 3
Figure 3
Full-body but not hematopoietic GSDMD deficiency contributes to the release of circulating IL-18 and IL-1β. AC: Male and female mice with and without whole-body GSDMD deficiency received i.p. injections of ultrapure LPS, ATP, or saline controls to induce inflammasome activation. A: Schematic of the study design. B: Plasma IL-18. C: Plasma IL-1β. Data are mean ± SEM (n = 3 mice/group in B and C). Statistical analyses were performed using two-way ANOVA followed by Tukey multiple comparisons test. DF: Male Ldlr−/−;GpTg mice were lethally irradiated and received bone marrow cells from animals with and without GSDMD deficiency. The animals were maintained on a chow diet and recovered for 5 weeks. The mice were then injected with and without ultrapure LPS and ATP after 5 weeks of recovery. D: Schematic of the study design. E: Plasma IL-18. F: Plasma IL-1β. Data are mean ± SEM (n = 7, 5, 8, and 8 mice/group in E and F). Statistical analyses were performed using two-way ANOVA followed by Tukey multiple comparisons test. In B and C and E and F, the lines between two groups indicate P values between the groups as calculated by multiple comparisons test. In E and F, the text underneath the graphs indicates overall group effects (P values) as calculated by two-way ANOVA. Outliers were removed based on Grubbs test with α = 0.01: no data points were removed in B and C and E and F. BMT, bone marrow transplant; KO, knockout; WT, wild type.
Figure 4
Figure 4
Hematopoietic AIM2, NLRP3, and DKO contribute to lesion area but not necrotic core area in the setting of diabetes. Female Ldlr−/− mice were lethally irradiated and received bone marrow from mice with and without Nlrp3 deficiency (Nlrp3−/−), Aim2 deficiency (Aim2−/−), or DKO. The animals were recovered on chow for 4 weeks before diabetes was induced with 5 days of STZ injections (50 mg/kg/day). Animals were maintained on a Western diet (WD) for 8 weeks. A: Schematic of the study design. B: Blood glucose levels. Glucose values >33.3 mmol/L are expressed as 33.3 mmol/L. Animals with average blood glucose <13.9 mmol/L were removed from the study. C: Serum triglyceride levels. D: Serum cholesterol levels. E: Serum IL-18 levels. F: Serum IL-1β levels. G: Serum APOC3 levels. H: Aortic sinus lesion area where 0 μm represents the first appearance of the three aortic valve leaflets. I: Aortic sinus necrotic core area calculated as percent of lesion area. Data are mean ± SEM (n = 9–12 mice/group). Statistical analyses were performed using Kruskal-Wallis test and Dunn multiple comparisons test in BG and using two-way ANOVA followed by Tukey multiple comparisons test in H and I. Normality test was performed using D’Agostino and Pearson test. In H and I, the text underneath the graphs indicates P values between the groups as calculated by the multiple comparisons test. Outliers were removed based on Grubbs test with α = 0.01: (1,1,1,1) data points were removed in F, and no data points were removed in BE and G and H. BMT, bone marrow transplant.
Figure 5
Figure 5
Diabetes increases APOC3 and APOE accumulation in aortic sinus lesions, but hematopoietic GSDMD deficiency has no effect. Female Ldlr−/−;GpTg mice were maintained on an HFD for 12 weeks to allow the formation of preexisting lesions. Mice were lethally irradiated and received bone marrow cells from animals with and without GSDMD deficiency. The animals were maintained on a chow diet and recovered for 5 weeks. Mice were rendered diabetic (D) with LCMV. Saline was used as a control (nondiabetic [ND]). At the onset of diabetes, the animals were switched to a semipurified LFD with no added cholesterol and were maintained for 4 weeks. A: Aortic sinus APOC3+ area. B: Aortic sinus total APOB+ area. C: Aortic sinus total APOE+ area. D: Aortic sinus APOB+APOE+ area. E: Representative aortic sinuses with Mac2, APOB, and APOE staining. F: Representative aortic sinuses with APOC3 staining. Immunofluorescence staining of Mac2, APOC3, APOB, and APOE were conducted at 0 μm. Data are mean ± SEM (n = 20, 21, 21, and 20 mice/group in A; 19, 20, 21, 20 mice/group in B and D; and 20, 21, 22, and 20 mice/group in C). Statistical analyses were performed by two-way ANOVA followed by Tukey multiple comparisons test in AD. The text underneath the graphs indicates overall group effects (P values) as calculated by two-way ANOVA. Outliers were removed based on Grubbs test with α = 0.01: (0,0,0,1) data points were removed in A, and no data points were removed in BD. KO, hematopoietic GSDMD knockout; WT, wild type.

References

    1. Tsao CW, Aday AW, Almarzooq ZI, et al. . Heart disease and stroke statistics-2022 update: a report from the American Heart Association. Circulation 2022;145:e153–e639 - PubMed
    1. Nishikawa T, Edelstein D, Du XL, et al. . Normalizing mitochondrial superoxide production blocks three pathways of hyperglycaemic damage. Nature 2000;404:787–790 - PubMed
    1. Senatus L, MacLean M, Arivazhagan L, et al. . Inflammation meets metabolism: roles for the receptor for advanced glycation end products axis in cardiovascular disease. Immunometabolism 2021;3:e210024. - PMC - PubMed
    1. Sharma A, Choi JSY, Stefanovic N, et al. . Specific NLRP3 inhibition protects against diabetes-associated atherosclerosis. Diabetes 2021;70:772–787 - PubMed
    1. Kanter JE, Hsu CC, Bornfeldt KE. Monocytes and macrophages as protagonists in vascular complications of diabetes. Front Cardiovasc Med 2020;7:10. - PMC - PubMed

Publication types