. 2024 Mar;20(1):117-128.
doi: 10.1007/s12024-023-00629-y. Epub 2023 Apr 21.

Starch treatment improves the salivary proteome for subject identification purposes

Affiliations

Starch treatment improves the salivary proteome for subject identification purposes

Hannah Smith et al. Forensic Sci Med Pathol. 2024 Mar.

Abstract

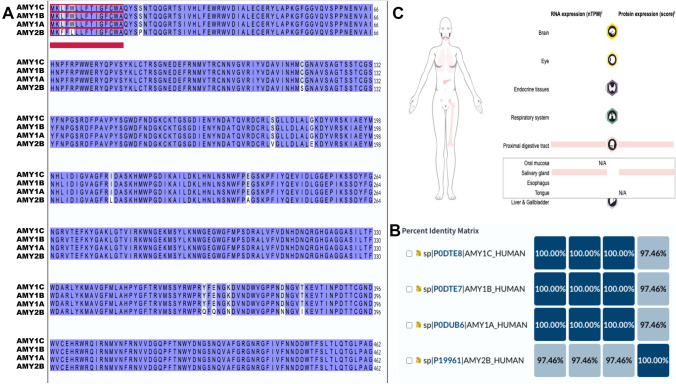
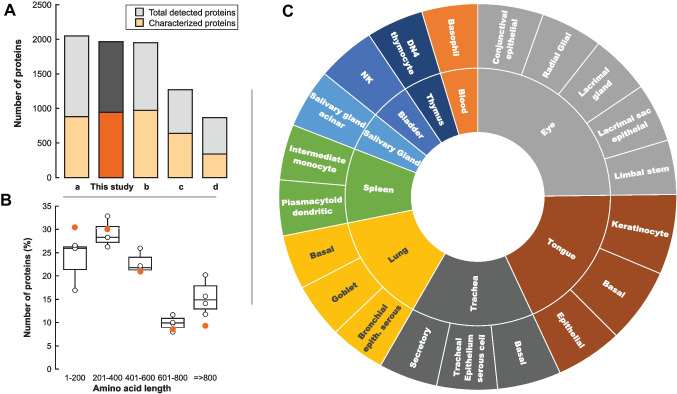
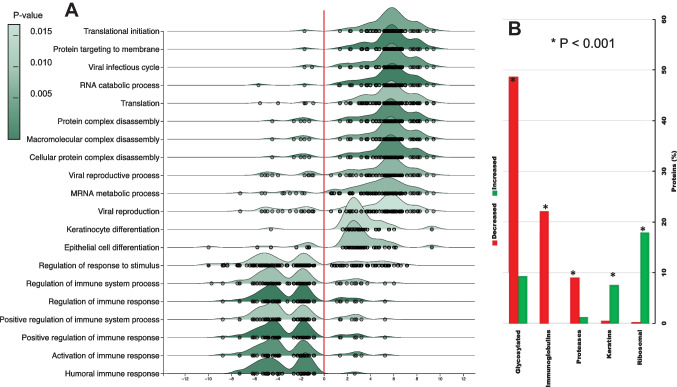
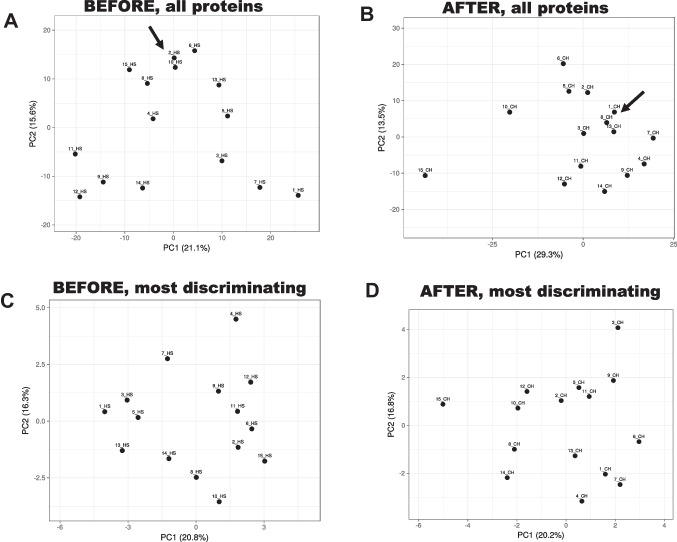
Identification of subjects, including perpetrators, is one of the most crucial goals of forensic science. Saliva is among the most common biological fluids found at crime scenes, containing identifiable components. DNA has been the most prominent identifier to date, but its analysis can be complex due to low DNA yields and issues preserving its integrity at the crime scene. Proteins are emerging as viable candidates for subject identification. Previous work has shown that the salivary proteome of the least-abundant proteins may be helpful for subject identification, but more optimized techniques are needed. Among them is removing the most abundant proteins, such as salivary α-amylase. Starch treatment of saliva samples elicited the removal of this enzyme and that of glycosylated, low-molecular-weight proteins, proteases, and immunoglobulins, resulting in a saliva proteome profile enriched with a subset of proteins, allowing a more reliable and nuanced subject identification.

Keywords: Forensic identification; Mass spectrometry; Method; Proteome; Saliva; Starch.


Conflict of interest statement

The authors declare no competing interests.

Figures

Fig. 1
Fig. 1
Alignment and expression of α-amylase isoforms in the body. A Alignment of primary sequences of isoforms AMY1A, AMY1B, AMY1C, and AMY2B. Alignment was performed with CLUSTAWL under Uniprot [31]. Similar amino acids are highlighted in blue, whereas the signal peptide is indicated in red. B Percentage of identity across isoforms. C Protein expression of AMY1A in the female body. Information retrieved from Human Protein Atlas [81]; www.proteinatlas.org). Image credit Human Protein Atlas (https://www.proteinatlas.org/ENSG00000237763-AMY1A/tissue)
Fig. 2
Fig. 2
Characterization of the salivary proteome from 15 females. A The total number of proteins detected in each of the studies (grey) and that of the ones characterized, reviewed, and present in the UniProt database (orange). These numbers were calculated from the following studies: a parotid and submandibular/sublingual saliva [34]; b whole saliva from females [11]; c whole saliva [33]; d whole saliva from females aged 20–30 years and 55–65 years [32]. B Distribution of proteins based on their amino acid length. The amino acid lengths of all reviewed and characterized proteins from each of the studies—including the current one—were obtained from UniProt. The results were plotted using a box plot. Each box encloses 50% of the data, with the median value of the four studies displayed as a line. The top and bottom of the box mark the limits of ± 25% of the variable population. The lines extending from the top and bottom of each box mark the minimum and maximum values within the data set that fall within an acceptable range. Any value outside this range, called an outlier, is displayed as an individual point. Data from the current study are shown in orange. C Tissue and cell distribution of the salivary proteome from this study. Reviewed and characterized proteins were analyzed using EnrichR [82] and the Human Proteome Map [83]. Only the top 20 data are shown based on the negative log of q-value. The q-value is an adjusted p-value calculated using the Benjamini–Hochberg method for correction for multiple hypotheses testing. Data were obtained for tissues (inner doughnut) and cell type (outer doughnut)
Fig. 3
Fig. 3
Effect of starch treatment on the salivary proteome of 15 females. A Abundance of total proteins/subject with and without starch treatment (blue), the abundance of amylase/subject with and without starch treatment (red), and of MGAM (green). B Heat map visualizing the protein abundance distribution across all samples. Subjects on X-axis, proteins on Y-axis. Proteins depleted (C) or enriched (D) by the starch treatment
Fig. 4
Fig. 4
Biological function and protein features associated with the most discriminating proteins before and after starch treatment. A Statistically significant proteins between treatments (n = 601) were obtained through a pair-wise test using Limma and selected by the adjusted p-value set at 0.05 or below. This analysis revealed 601 different proteins. These were used as input for the ridgeline diagram of enriched functions. All analysis was performed with NetworkAnalyst [55]. Only the top 20 are shown. Results were organized by log2 fold ratio (X-axis), and the shade of green indicates the significance. B The statistically different proteins between treatments were analyzed for glycosylation and if they belong to the following families: immunoglobulins, proteases or peptidases, keratins, and ribosomal. Analysis was performed with Uniprot. * indicates the p-value of the Chi-squared test for each outcome between treatments
Fig. 5
Fig. 5
Principal component analysis of the salivary proteome under different conditions. PCA (performed with ClustVis 2.0 [30]) was applied by utilizing proteins (normalized by variance-stabilizing normalization followed by quantile normalization) for each treatment. Unit variance scaling was applied to rows; singular value decomposition with imputation was used to calculate principal component analysis (to all panels). Other options were set as follows: no data transformation and no collapse of columns with similar annotations were performed; the maximum percentage of unavailable data allowed in both rows and columns was set at 99.99; row centering; no removal of constant columns; row scaling was based on unit variance scaling, and the PCA method was calculated by using singular value decomposition. Panels A and B were obtained by running a PCA with all proteins before (A) and after (B) starch treatment. Lower panels were obtained with the most discriminating proteins before (C) and after (D) starch treatment

Similar articles

Cited by

References

    1. Anzai-Kanto E, Hirata MH, Hirata RD, Nunes FD, Melani RF, Oliveira RN. DNA extraction from human saliva deposited on skin and its use in forensic identification procedures. Braz Oral Res. 2005;19(3):216–22. Available from: https://www.ncbi.nlm.nih.gov/pubmed/16308611. - PubMed
    1. Chatterjee S. Saliva as a forensic tool. J Forensic Dent Sci. 2019;11(1):1–4. Available from: https://www.ncbi.nlm.nih.gov/pubmed/31680748. - PMC - PubMed
    1. Van Steendam K, De Ceuleneer M, Dhaenens M, Van Hoofstat D, Deforce D. Mass spectrometry-based proteomics as a tool to identify biological matrices in forensic science. Int J Legal Med. 2013;127(2):287–98. Available from: https://www.ncbi.nlm.nih.gov/pubmed/22843116. - PMC - PubMed
    1. Toennes SW, Steinmeyer S, Maurer HJ, Moeller MR, Kauert GF. Screening for drugs of abuse in oral fluid--correlation of analysis results with serum in forensic cases. J Anal Toxicol. 2005;29(1):22–7. Available from: https://www.ncbi.nlm.nih.gov/pubmed/15808009. - PubMed
    1. Grassl N, Kulak NA, Pichler G, Geyer PE, Jung J, Schubert S, Sinitcyn P, Cox J, Mann M. Ultra-deep and quantitative saliva proteome reveals dynamics of the oral microbiome. Genome Med. 2016;8(1):44. Available from: https://www.ncbi.nlm.nih.gov/pubmed/27102203. - PMC - PubMed

LinkOut - more resources