. 2023 Apr 21;14(4):279-293.
doi: 10.1093/procel/pwac038.

Single-nucleus transcriptomics reveals a gatekeeper role for FOXP1 in primate cardiac aging

Affiliations

Single-nucleus transcriptomics reveals a gatekeeper role for FOXP1 in primate cardiac aging

Yiyuan Zhang et al. Protein Cell. .

Abstract

Aging poses a major risk factor for cardiovascular diseases, the leading cause of death in the aged population. However, the cell type-specific changes underlying cardiac aging are far from being clear. Here, we performed single-nucleus RNA-sequencing analysis of left ventricles from young and aged cynomolgus monkeys to define cell composition changes and transcriptomic alterations across different cell types associated with age. We found that aged cardiomyocytes underwent a dramatic loss in cell numbers and profound fluctuations in transcriptional profiles. Via transcription regulatory network analysis, we identified FOXP1, a core transcription factor in organ development, as a key downregulated factor in aged cardiomyocytes, concomitant with the dysregulation of FOXP1 target genes associated with heart function and cardiac diseases. Consistently, the deficiency of FOXP1 led to hypertrophic and senescent phenotypes in human embryonic stem cell-derived cardiomyocytes. Altogether, our findings depict the cellular and molecular landscape of ventricular aging at the single-cell resolution, and identify drivers for primate cardiac aging and potential targets for intervention against cardiac aging and associated diseases.

Keywords: FOXP1; aging; cardiomyocyte; primate; single-nucleus RNA-sequencing.


Conflict of interest statement

The authors declare no competing interests.

Figures
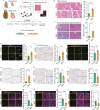
Figure 1.
Figure 1.
Characterization of aging-associated physiological changes in the monkey left ventricle. (A) Schematic flowchart overview of samples, analysis, and validation approaches. Young, young cynomolgus monkeys, 4–6 years old; Aged, old cynomolgus monkeys, 18–21 years old. (B) Hematoxylin and eosin (H&E) staining of LV tissues from young and aged monkeys. Scale bars, 100 μm and 25 μm (zoomed-in images). Left, representative images. Right, quantitative analysis. (C) Masson staining of the LV tissues from young and aged monkeys. Scale bars, 100 μm. Left, representative images for perivascular fibrosis and interstitial fibrosis as indicated. Right, quantitative analysis. (D) Immunofluorescence staining for CD45 in LV tissues from young and aged monkeys. Scale bars, 50 μm and 10 μm (zoomed-in images). Left, representative images. Right, the proportion of CD45 positive cells was quantified. (E) Immunohistochemical staining for S100A8 in LV tissues from young and aged monkeys. The proportion of S100A8-positive cells in total cells was calculated as quantitative analysis. Scale bars, 50 μm and 20 μm (zoomed-in images). Left, representative images; right, the proportion of S100A8 positive cells was quantified. (F) Analysis for lipofuscin deposition in LV tissues from young and aged monkeys. Scale bars, 50 μm and 10 μm (zoomed-in images). Left, representative images; right, the relative intensity was quantified as fold changes of their intensity in the aged LV vs. that in young LV tissues. (G) Immunohistochemical staining for cellular senescence-associated marker p21 in LV tissues from young and aged monkeys. Scale bars, 50 μm and 20 μm (zoomed-in images). Left, representative images. Right, the proportion of p21 positive cells was quantified. (H) Immunohistochemical staining for heterochromatin protein HP1-α in LV tissues from young and aged monkeys. Scale bars, 50 μm and 20 μm (zoomed-in images). Left, representative images. Right, the relative intensity was quantified as fold changes of their intensity in the aged tissues vs. that in young tissues. (I) Immunohistochemical staining of heterochromatin protein HP1-γ in LV tissues from young and aged monkeys. Scale bars, 50 μm and 20 μm (zoomed-in images). Left, representative images. Right, the relative intensity was quantified as fold changes of their intensity in the aged tissue vs. that in young tissue. (J) Immunofluorescence staining of cTnT and H3K9me3 in LV tissues from young and aged monkeys. Scale bars, 50 μm. Left, representative images. Right, the relative intensity was quantified as fold changes of their intensity in the aged samples vs. that in young samples. (K) Immunofluorescence staining of cTnT and Lamin B2 in LV tissues from young and aged monkeys. Scale bars, 25 μm. Left, representative images. Right, the relative intensity was quantified as fold changes of their intensity in the aged samples vs. that in young samples. (L) Immunofluorescence staining of cTnT and CX43 in LV tissues from young and aged monkeys. Scale bars, 25 μm and 5 μm (zoomed-in images). Left, representative images. Right, the relative intensity was quantified as fold changes of their intensity in the aged samples vs. that in young samples. Data are presented as the mean ± SEM. n = 8 monkeys for each group. *P < 0.05, **P < 0.01; ***P < 0.001.
Figure 2.
Figure 2.
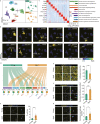
Single-cell atlas of left ventricle revealed the changes of cell proportion in the aged heart. (A) UMAP (uniform manifold approximation and projection) plot showing the distribution of different cell types in the LV tissues of young and aged monkeys. CM, cardiomyocyte; FB, fibroblast; T cell, T lymphocyte; B cell, B lymphocyte; Mac, macrophage; Neuron; EC, endothelial cell; NTN1+ EC, NTN1-postivite endothelial cell; Per, pericyte; SMC, smooth muscle cell; ADI, adipocyte. (B) UMAP plots showing the expression profiles of indicated cell-type-specific marker genes in monkey heart. The color key from blue to yellow indicates low to high gene expression levels. (C) Left, heatmap showing the expression signatures of top 50 cell-type-specific genes. Enriched representative GO terms and pathways for each cell type are showing on the right. Colors indicate different cell types and the length of bar indicates −log10 (P-value). (D) Sankey plot showing the number of cells and the ratios of young and aged cells in each cell type. The length of the bar indicates the number of cells, and the number of cells was marked below the bar. The pie chart showing the ratios of cell types in young and aged monkey LV. (E) Immunofluorescence staining of cardiomyocyte marker cTnT in young and aged monkey LV. Scale bars, 25 μm and 5 μm (zoomed-in images). Left, representative images. Right, the percentage of cardiac nuclei to total nuclei was calculated, the asterisk in representative images indicates non-cardiomyocytes. (F) Immunofluorescence staining of fibroblast marker Vimentin in young and aged monkey LV. Scale bars, 25 μm and 5 μm (zoomed-in images). Left, representative images. Right, the percentage of vimentin positive cells to total nuclei was quantified. (G) Immunofluorescence staining of T cell marker CD3 in young and aged monkey LV. Scale bars, 50 μm and 10 μm (zoomed-in images). Left, representative images. Right, the percentage of CD3 positive cells to total nuclei was quantified. (H) Immunofluorescence staining of macrophage marker CD163 in young and aged monkey LV. Scale bars, 25 μm and 5 μm (zoomed-in images). Left, representative images. Right, the percentage of CD163 positive cells to total nuclei was quantified. Data are presented as the mean ± SEM. n = 8 monkeys for each group. *P < 0.05, **P < 0.01, ***P < 0.001.
Figure 3.
Figure 3.
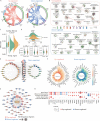
Transcriptional changes in multiple cell types during cardiac aging. (A) Circos plots showing up (left) and downregulated (right) aging-related differentially expressed genes (aging DEGs) in different cell types in monkey LV. Each connecting line represents a DEG that co-occurs in both cell types. (B) Network visualizing representative GO terms and pathways of aging-related up (top) and downregulated (bottom) DEGs between aged and young monkey LV cells. The nodes were represented as pie charts, where the size of a pie is proportional to the total number of hits that fall into that specific term. The pie charts are colored by cell types, where the size of a slice represents the percentage of genes under the term that originated from the corresponding gene list. Two terms with similarity > 0.3 are connected by a line. (C) Ridge plot showing the AUC score of cardiac fibrosis gene set in fibroblasts. (D) Ridge plot showing the AUC score of senescence-associated secretory phenotype (SASP) gene set in the monkey LV cells. Violin plots showing increased SASP genome scores in FB, Mac, and EC in monkey LV during aging. (E) Network visualization of aging-related up (left) and downregulated (right) core regulatory transcription factors (TFs) in monkey ventricular cells. The pie charts in the middle represent different cell types, with red representing upregulated and blue representing downregulated. The node size indicates the number of target genes involved in a certain cell type. The red nodes on the left represent upregulated TFs, and the blue nodes on the right represent downregulated TFs. Color keys from light to dark indicate the numbers of target genes regulated by these TFs from low to high. (F) Plots showing up (left) and downregulated DEGs (right) shared by at least three cell types. The color key indicates different cell types. (G) Network plot showing up and downregulated DEGs of all cell types that overlapped with genes annotated in the Aging Atlas database. The node size indicates the frequency of DEGs appearing across different cell types. Red parts of nodes, upregulated genes; blue parts of nodes, downregulated genes. (H) Dot plots showing that DEGs overlapped with genes from heart disease-associated gene sets. Red parts of nodes, upregulated DEGs; blue parts of nodes, downregulated genes. The node size indicates the frequency of DEGs.
Figure 4.
Figure 4.
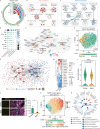
Profiling of aging-susceptible cardiomyocyte changes. (A) Circle plot showing prioritization of the most responsive cell types during monkey heart aging by Augur (a method to identify the cell types most responsive to biological perturbations in single-cell data). (B) Network visualizing representative GO terms and pathways of upregulated aging-related DEGs between aged and young monkey cardiomyocytes. The size of nodes is proportional to the total number of hits that fall into a certain specific term. Two terms with similarity > 0.3 are connected by a line. (C) Network visualizing representative GO terms and pathways of downregulated aging-associated DEGs between aged and young monkey cardiomyocytes. The size of nodes is proportional to the total number of hits that fall into a certain term. Two terms with similarity > 0.3 are connected by a line. (D) Dot plot showing the number of genes that overlap between marker genes of each cell types and cardiovascular disease-associated gene sets. (E) Network visualizing the overlap between aging DEGs of cardiomyocytes and genes involved in cardiovascular diseases. The colors of grey and yellow nodes represent genes and diseases, respectively. Among nodes of genes, DEGs of cardiomyocytes are labeled by gene symbols, with edges indicating log2 fold changes. Red, upregulation; blue, downregulation. (F) t-SNE plot showing cluster distribution of monkey cardiomyocytes by the 18 aging-related regulons activity. Cells are colored by young and old groups. (G) Regulatory networks visualizing potential key transcriptional regulators in monkey cardiomyocytes during aging. Smaller nodes represent target genes and larger nodes represent TFs. The node size of TFs positively correlates with the number of target genes it regulates. Red nodes, upregulated; blue nodes, downregulated. (H) Plot showing regulon activity and number of target genes of 18 aging-related regulators in CMs. The size of the dots was positively correlated with the number of target genes. (I) Violin plot showing the expression of FOXP1 in monkey cardiomyocytes from young and aged groups, indicated that FOXP1 is downregulated in aged cardiomyocytes. The black line represents the median expression. (J) Immunofluorescence staining of FOXP1 in young and aged monkey LV, verifying the downregulation of FOXP1 in aged cardiomyocytes, but not other cell types. Left, representative image of FOXP1 in aged and young heart. Right, quantitative data of FOXP1 expression in cardiomyocytes. Scale bars, 25 μm and 5 μm (zoomed-in images). Data are presented as the mean ± SEM. n = 8 monkeys for each group. **P < 0.01. (K) t-SNE plot showing activity score of the FOXP1 target gene set in monkey cardiomyocytes. (L) Network plot showing representative terms of FOXP1 target gene enrichment. The genes corresponding to the terms are shown on the outermost side. Red nodes, upregulated; blue nodes, downregulated.
Figure 5.
Figure 5.
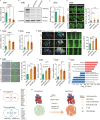
Downregulated FOXP1 induced senescence and hypertrophy in hCMs. (A) RT-qPCR detecting silent efficacy of FOXP1 siRNA in hCMs. Data are presented as mean ± SEM. n = 4 independent experiment, *P < 0.05, **P < 0.01. (B) Western blot detecting FOXP1 protein levels in hCMs after transfection of siNC and siFOXP1#1 and siFOXP1#2. (C) Quantitative data of (B) showed the downregulation of FOXP1 protein level after transfected with siFOXP1#1 and siFOXP1#2 compared with siNC. Data are presented as mean ± SEM. n = 3 independent experiment, *P < 0.05, **P < 0.01. (D) Immunofluorescence staining of cTnT in hCMs after transfection of siNC and siFOXP1#1 and siFOXP1#2. Left, representative photos. Right, quantitative data. Scale bars, 20 μm. Data are presented as mean ± SEM. n = 3 independent experiment, ***P < 0.001. (E) RT-qPCR detecting the cardiac hypertrophic marker NPPA after transfection of siNC and siFOXP1#1 and siFOXP1#2. Data are presented as mean ± SEM. n = 3 independent experiment, *P < 0.05, **P < 0.01. (F) RT-qPCR detecting the cardiac hypertrophic marker NPPB after transfection of siNC and siFOXP1#1 and siFOXP1#2. Data are presented as mean ± SEM. n = 3 independent experiment, *P < 0.05. (G) Calcium transient recordings and quantification of amplitude by Fluo-4 AM in hCMs upon knockdown of FOXP1. Left, representative photos showing the F0 (min intensity) and F (max intensity) of calcium transients in hCMs transfected with siNC, siFOXP1#1 and siFOXP1#2. Middle: X-T mode of each group. Right: quantitative data. Data are presented as mean ± SEM. n = 3 independent experiment, **P < 0.01. (H) Co-staining of SA-β-gal activity and cTnT immunofluorescence in hCMs after transfection of siNC and siFOXP1#1 and siFOXP1#2. Left, representative photos. Right, quantitative data. Data are presented as mean ± SEM. n = 3 independent experiment, ***P < 0.001. (I) RT-qPCR detecting the senescence marker p16 after transfection of siNC and siFOXP1#1 and siFOXP1#2. Data are presented as mean ± SEM. n = 3 independent experiment, *P < 0.05. (J) RT-qPCR detecting the senescence marker p21 after transfection of siNC and siFOXP1#1 and siFOXP1#2. Data are presented as mean ± SEM. n = 3 independent experiment, **P < 0.01. (K) Representative GO terms and pathways of up- and downregulated DEGs in siNC and siFOXP1 hCMs by RNA-sequencing. (L) Venn diagram showing genes shared by DEGs of hCMs after silencing of FOXP1 and aging-related DEGs of cardiomyocytes in snRNA-seq. (M) Schematic (created with Biorender.com) showing pathological changes in the LV of young and aged hearts.

References

    1. Abdellatif M, Sedej S, Carmona-Gutierrez Det al. . Autophagy in cardiovascular aging. Circ Res 2018;123:803–824. - PubMed
    1. Abplanalp WT, John D, Cremer Set al. . Single-cell RNA-sequencing reveals profound changes in circulating immune cells in patients with heart failure. Cardiovasc Res 2021;117:484–494. - PubMed
    1. Aging Atlas C. Aging Atlas: a multi-omics database for aging biology. Nucleic Acids Res 2021;49:D825–D830. - PMC - PubMed
    1. Ahola A, Pölönen RP, Aalto-Setälä Ket al. . Simultaneous measurement of contraction and calcium transients in stem cell derived cardiomyocytes. Ann Biomed Eng 2018;46:148–158. - PMC - PubMed
    1. Anders, S, Pyl T, Huber, W.. HTSeq—a Python framework to work with high-throughput sequencing data. Bioinformatics 2015;31:166–169. - PMC - PubMed

Publication types

Substances