. 2023 Jul 20;142(3):244-259.
doi: 10.1182/blood.2022018774.

Spectrum of clonal hematopoiesis in VEXAS syndrome

Affiliations

Spectrum of clonal hematopoiesis in VEXAS syndrome

Fernanda Gutierrez-Rodrigues et al. Blood. .

Abstract

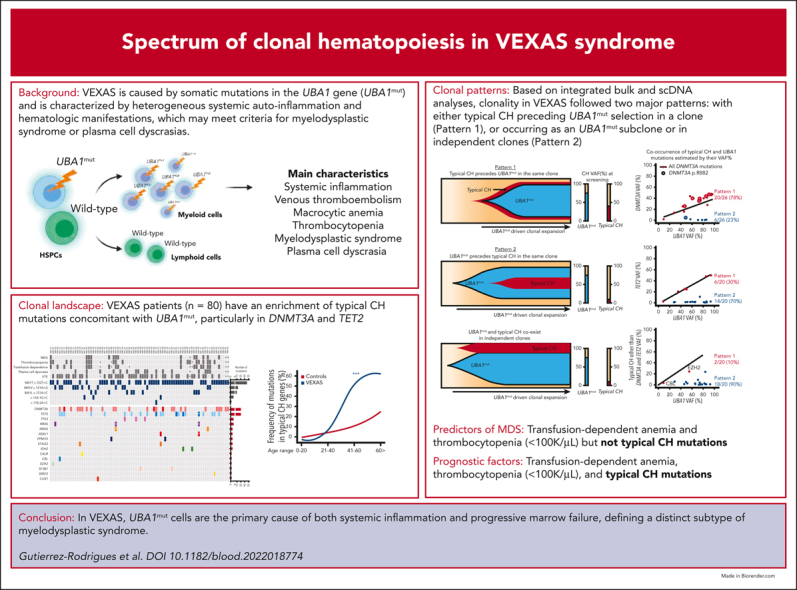
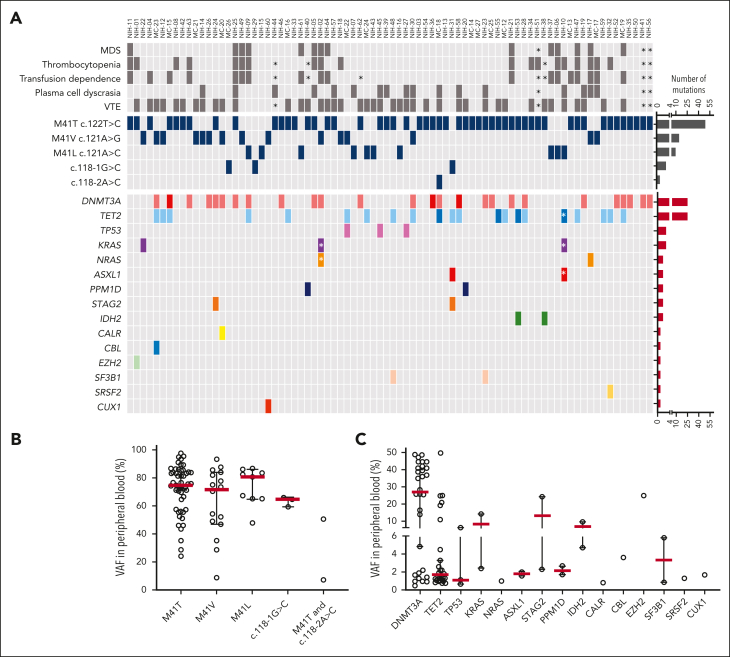
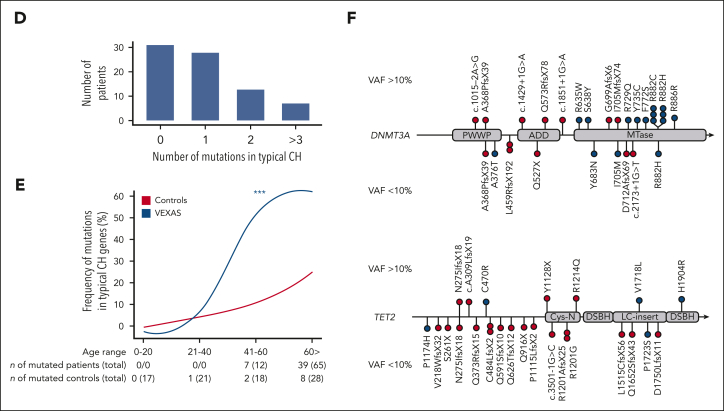
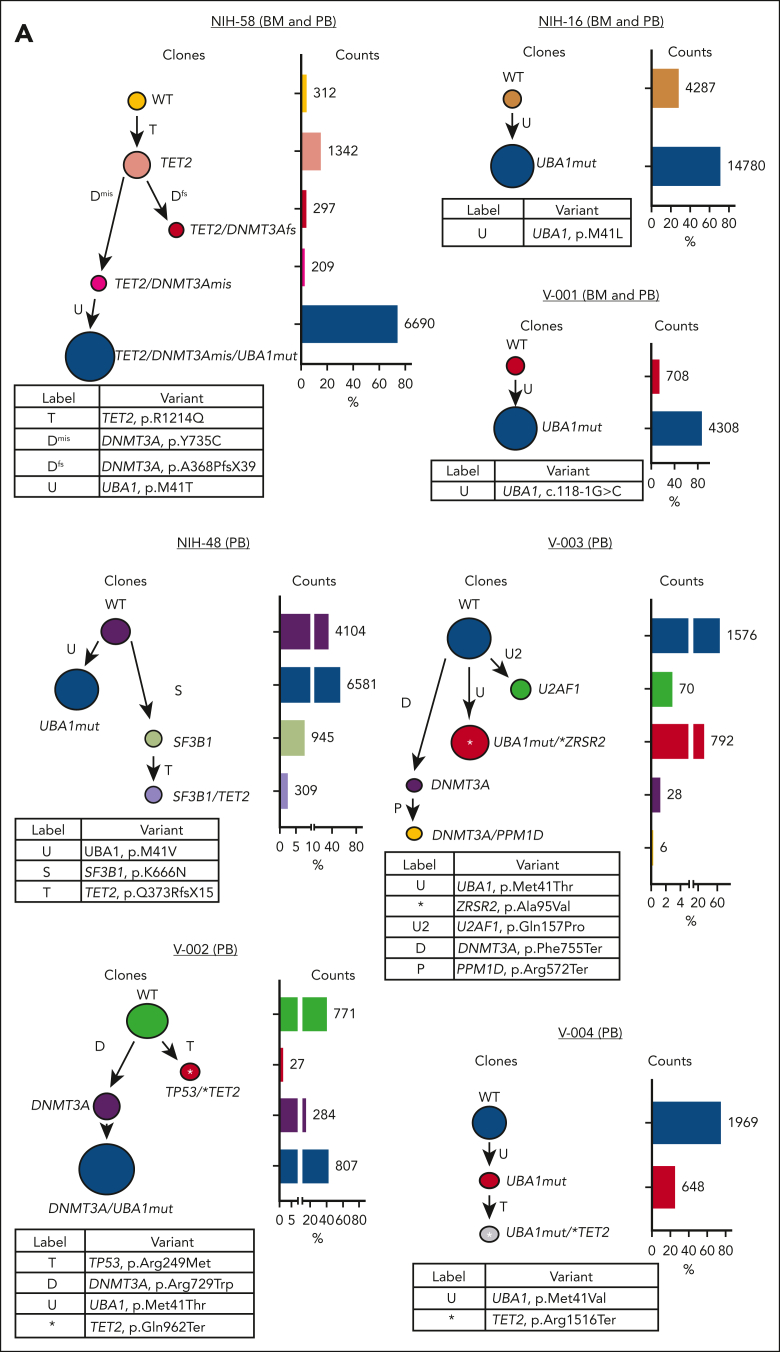
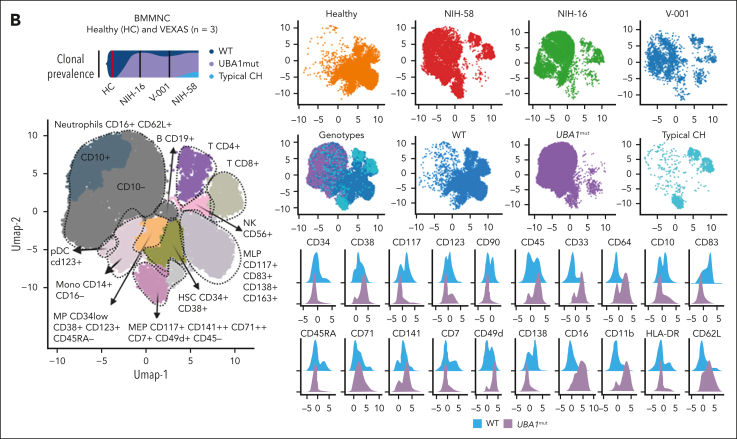
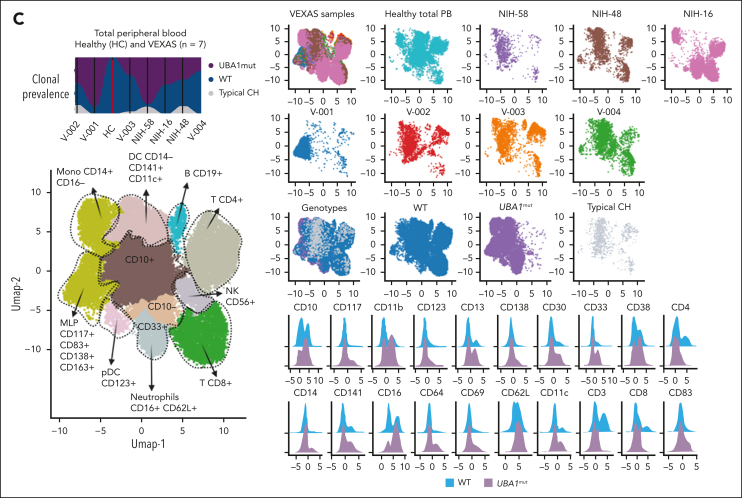
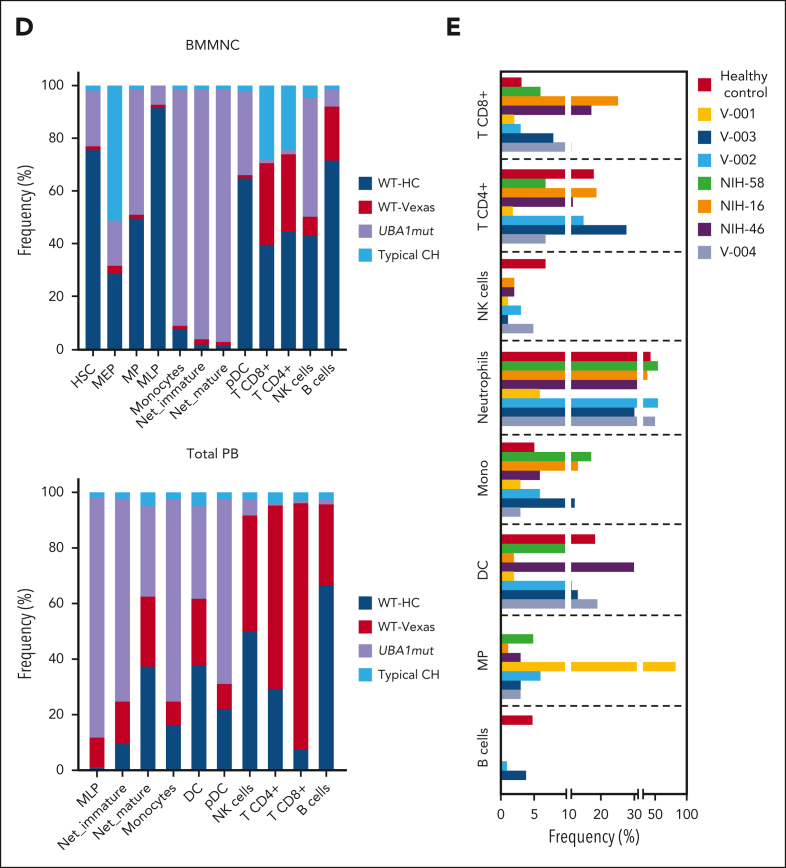
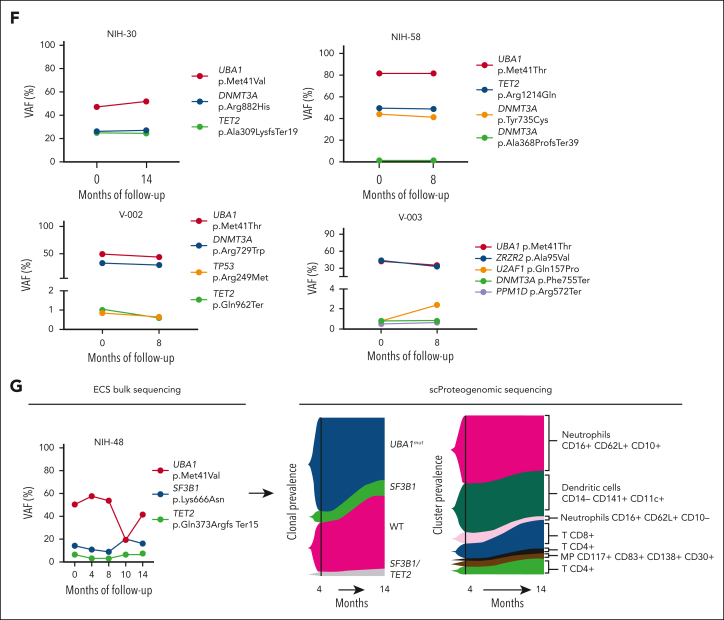
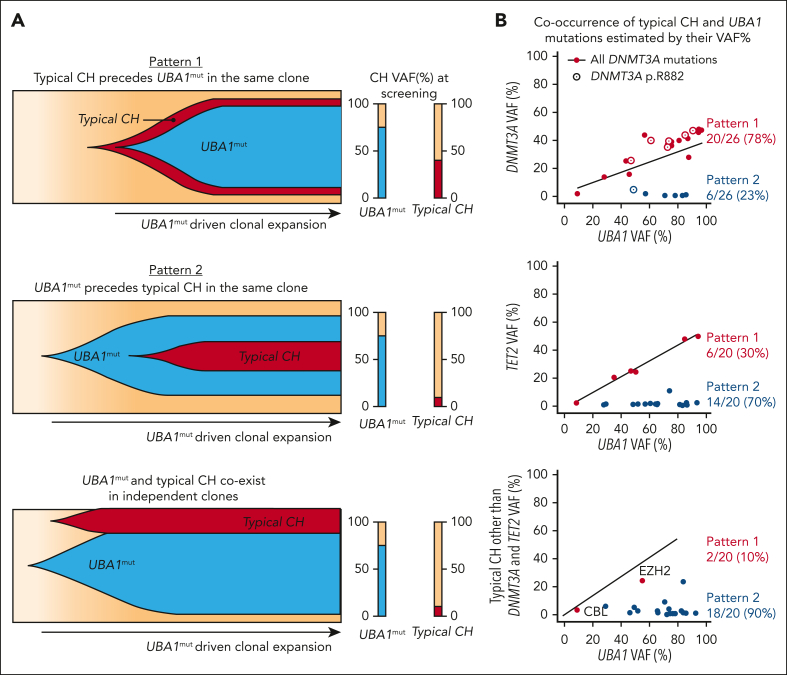
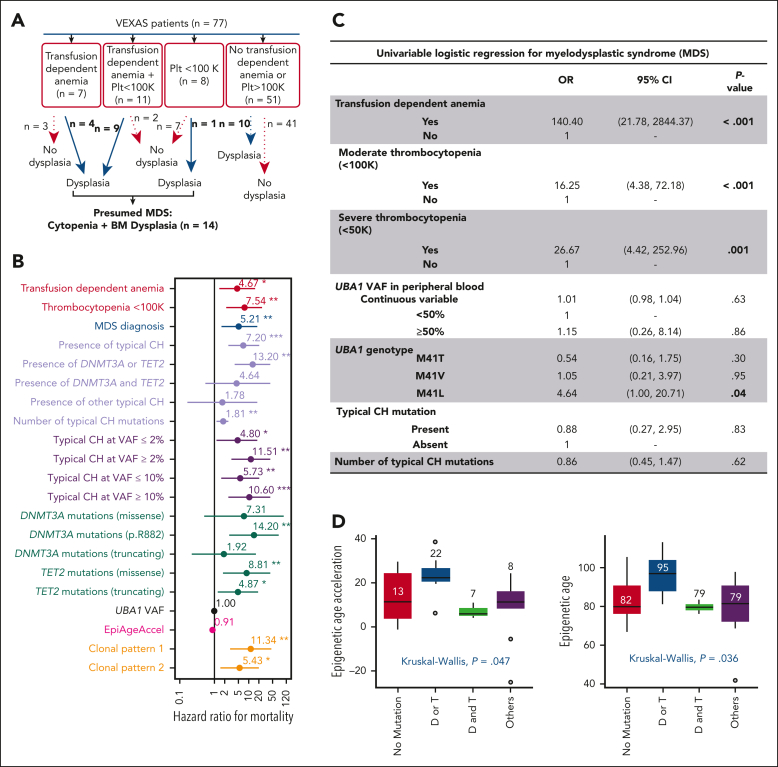
Vacuoles, E1 enzyme, X-linked, autoinflammatory, somatic (VEXAS) syndrome is caused by somatic mutations in UBA1 (UBA1mut) and characterized by heterogenous systemic autoinflammation and progressive hematologic manifestations, meeting criteria for myelodysplastic syndrome (MDS) and plasma cell dyscrasias. The landscape of myeloid-related gene mutations leading to typical clonal hematopoiesis (CH) in these patients is unknown. Retrospectively, we screened 80 patients with VEXAS for CH in their peripheral blood (PB) and correlated the findings with clinical outcomes in 77 of them. UBA1mut were most common at hot spot p.M41 (median variant allele frequency [VAF] = 75%). Typical CH mutations cooccurred with UBA1mut in 60% of patients, mostly in DNMT3A and TET2, and were not associated with inflammatory or hematologic manifestations. In prospective single-cell proteogenomic sequencing (scDNA), UBA1mut was the dominant clone, present mostly in branched clonal trajectories. Based on integrated bulk and scDNA analyses, clonality in VEXAS followed 2 major patterns: with either typical CH preceding UBA1mut selection in a clone (pattern 1) or occurring as an UBA1mut subclone or in independent clones (pattern 2). VAF in the PB differed markedly between DNMT3A and TET2 clones (median VAF of 25% vs 1%). DNMT3A and TET2 clones associated with hierarchies representing patterns 1 and 2, respectively. Overall survival for all patients was 60% at 10 years. Transfusion-dependent anemia, moderate thrombocytopenia, and typical CH mutations, each correlated with poor outcome. In VEXAS, UBA1mut cells are the primary cause of systemic inflammation and marrow failure, being a new molecularly defined somatic entity associated with MDS. VEXAS-associated MDS is distinct from classical MDS in its presentation and clinical course.


Conflict of interest statement

Conflict-of-interest disclosure: The authors declare no competing interests.

Figures

None
Graphical abstract
Figure 1.
Figure 1.
Clonal landscape of VEXAS. (A) Oncoprint of 80 patients screened via ECS based on their ages (ascending order). The clinical characteristics, UBA1 genotype, and the presence of mutations in typical CH genes from each patient are shown. Few patients were found with multiple DNMT3A or TET2 variants, depicted in darker red or blue in the figure, respectively. The number of UBA1 and typical CH mutations are also shown in the panel. Black asterisks represent missing data in retrospective chart reviews. White asterisks represent mutations that were not identified in total blood but in granulocytes of 2 patients (NIH-02 and NIH-10) because these were the only available sample. In NIH-02, the KRAS and NRAS variants were found below the limit of detection of the assay in PB (0.15% and 0.21%, respectively) after being first identified in patient’s granulocytes at VAF around 0.7%. NIH-10 was screened after he had undergone an autologous stem cell transplant; he had a detectable UBA1 mutation at VAF of 11% and variants in ASXL1 p.L823X (VAF = 2%), KRAS p.I24N (VAF = 14%), and 3 TET2 mutations. (B) Median VAF of UBA1 mutations in the PB. Each circle represents a VAF of an UBA1 mutation. Two UBA1 mutations, the p.M41T at and c.118-2A>C, were found in a single patient. Red lines depict a median of values. (C) Median VAF of mutations in typical myeloid cancer genes other than UBA1 (typical CH genes). Each circle represents a VAF of variants identified by ECS. Red lines depict a median of values. (D) Number of mutations in typical CH genes per patient. (E) Frequency of typical CH mutations in VEXAS and healthy controls according to an age range. Number of patients and controls screened with ECS sequencing in each age range is shown in the graph. Typical CH frequency in VEXAS was significantly higher than in age-matched healthy controls. (F) Linear representation of DNMT3A and TET2 with mutations identified in our VEXAS cohort. DNMT3A and TET2 were the most mutated genes in our patients. Each variant is represented by a circle, red if the variant is missense or blue if it is truncated (splicings, stop gains, and frameshifts). Variants at VAF >10% are shown above the gene representation, whereas the ones at VAF <10% are shown below.
Figure 1.
Figure 1.
Clonal landscape of VEXAS. (A) Oncoprint of 80 patients screened via ECS based on their ages (ascending order). The clinical characteristics, UBA1 genotype, and the presence of mutations in typical CH genes from each patient are shown. Few patients were found with multiple DNMT3A or TET2 variants, depicted in darker red or blue in the figure, respectively. The number of UBA1 and typical CH mutations are also shown in the panel. Black asterisks represent missing data in retrospective chart reviews. White asterisks represent mutations that were not identified in total blood but in granulocytes of 2 patients (NIH-02 and NIH-10) because these were the only available sample. In NIH-02, the KRAS and NRAS variants were found below the limit of detection of the assay in PB (0.15% and 0.21%, respectively) after being first identified in patient’s granulocytes at VAF around 0.7%. NIH-10 was screened after he had undergone an autologous stem cell transplant; he had a detectable UBA1 mutation at VAF of 11% and variants in ASXL1 p.L823X (VAF = 2%), KRAS p.I24N (VAF = 14%), and 3 TET2 mutations. (B) Median VAF of UBA1 mutations in the PB. Each circle represents a VAF of an UBA1 mutation. Two UBA1 mutations, the p.M41T at and c.118-2A>C, were found in a single patient. Red lines depict a median of values. (C) Median VAF of mutations in typical myeloid cancer genes other than UBA1 (typical CH genes). Each circle represents a VAF of variants identified by ECS. Red lines depict a median of values. (D) Number of mutations in typical CH genes per patient. (E) Frequency of typical CH mutations in VEXAS and healthy controls according to an age range. Number of patients and controls screened with ECS sequencing in each age range is shown in the graph. Typical CH frequency in VEXAS was significantly higher than in age-matched healthy controls. (F) Linear representation of DNMT3A and TET2 with mutations identified in our VEXAS cohort. DNMT3A and TET2 were the most mutated genes in our patients. Each variant is represented by a circle, red if the variant is missense or blue if it is truncated (splicings, stop gains, and frameshifts). Variants at VAF >10% are shown above the gene representation, whereas the ones at VAF <10% are shown below.
Figure 2.
Figure 2.
Single-cell proteogenomic analysis of patients with VEXAS. (A) Clonal hierarches in 7 patients with VEXAS. Clones’ genotypes and absolute counts are shown for each patient. Clones with somatic mutations identified via ECS bulk sequencing but not targeted in the single-cell panel are indicated by white asterisks. Although the order of these clonal events is unknown, cooccurrence of mutations in single clones were inferred by their VAF in bulk sequencing and clonal dynamics in serial samples. (B) Multiomics profiles of BMMNC collected from 3 patients with VEXAS. (C) Multiomics profiles of total PB from 7 patients with VEXAS. Panels show the protein uniform manifold approximation and projection (UMAP) with sample types and genotypes, cell clusters with their main protein surface markers used for their characterization, and histograms with expression of different protein surface markers. Representative data from BMNNC and PB cells derived from a healthy control were used as a reference for analysis. (D) Frequency of different clones according to cell clusters in BMMNC and PB samples. Single cells were labeled according to their genotypes as WT, either from the healthy control (WT-HC) or patients with VEXAS (WT-VEXAS), as having an UBA1mut, regardless of cooccurrence with other typical CH, and as having a typical CH independently from UBA1mut. Cells clusters were characterized according to their differentially expressed protein surface markers (normalized reads) when stained with the cocktail of 45 antibodies targeting common blood protein surface markers (TotalSeq-D Heme Oncology Cocktail antibody-oligo conjugate) and processed with the Tapestry protocol (Mission Bio; supplemental Figures 1 and 2). Cell populations in both BMMNC and PB were characterized based on a reference data from healthy samples and available Mission Bio data sets as: HSC (CD34+CD38+CD117+), likely megakaryocyte-erythroid progenitor cells (MEPs; CD38lowCD117+CD141highCD71highCD7+CD45lineage), likely myeloid and lymphoid progenitors (MLPs; CD34lowCD38+CD117+CD83+CD138+CD30+CD13+), myeloid progenitors (MPs; CD34low CD38+CD117+CD123+CD45RACD141+CD71+CD7+CD33+CD64+), immature neutrophils (Net_immature: LinCD16+CD62L+CD10 or CD33high), mature neutrophils (Net_mature: LinCD16+CD62L+CD10+), monocytes (mono; CD14+CD16+/−), plasmacytoid dendritic cells (pDCs; CD14CD123+FcεRIa+), conventional DCs (DCs; CD14CD141+CD11c+CD11b+), T lymphocytes (CD3+CD8+ or CD4+), B lymphocytes (CD19+), and natural killer cells (NKs; CD3CD56+CD7+). (E) Frequency of different blood subpopulations identified by scDNA in PB. Frequency of cells assigned as total neutrophils, MPs, T lymphocytes CD4+ or CD8+, NKs, total mono, DCs, and B cells are shown. (F) Clonal dynamics of UBA1mut and typical CH in 4 patients during follow-up. (G) Clonal dynamics of UBA1mut and typical CH in NIH-48 via ECS and single-cell proteogenomic sequencing. Somatic mutations in UBA1, SF3B1, and TET2 were first identified in bulk sequencing. Clonal trajectories elucidated by scDNA showed the presence of 4 independent clones in this patient: a WT, UBA1-mutated (UBA1mut), a SF3B1 p.K666N-mutated (SF3B1) and a SF3B1 clone that subsequently acquired a TET2 p.Q373Rfs mutation (SF3B1/TET2). Frequency of each clone (clone prevalence) and cell clusters based on expression of protein surface markers (cluster prevalence) in samples collected at 4 and 14 months of follow-up are shown.
Figure 2.
Figure 2.
Single-cell proteogenomic analysis of patients with VEXAS. (A) Clonal hierarches in 7 patients with VEXAS. Clones’ genotypes and absolute counts are shown for each patient. Clones with somatic mutations identified via ECS bulk sequencing but not targeted in the single-cell panel are indicated by white asterisks. Although the order of these clonal events is unknown, cooccurrence of mutations in single clones were inferred by their VAF in bulk sequencing and clonal dynamics in serial samples. (B) Multiomics profiles of BMMNC collected from 3 patients with VEXAS. (C) Multiomics profiles of total PB from 7 patients with VEXAS. Panels show the protein uniform manifold approximation and projection (UMAP) with sample types and genotypes, cell clusters with their main protein surface markers used for their characterization, and histograms with expression of different protein surface markers. Representative data from BMNNC and PB cells derived from a healthy control were used as a reference for analysis. (D) Frequency of different clones according to cell clusters in BMMNC and PB samples. Single cells were labeled according to their genotypes as WT, either from the healthy control (WT-HC) or patients with VEXAS (WT-VEXAS), as having an UBA1mut, regardless of cooccurrence with other typical CH, and as having a typical CH independently from UBA1mut. Cells clusters were characterized according to their differentially expressed protein surface markers (normalized reads) when stained with the cocktail of 45 antibodies targeting common blood protein surface markers (TotalSeq-D Heme Oncology Cocktail antibody-oligo conjugate) and processed with the Tapestry protocol (Mission Bio; supplemental Figures 1 and 2). Cell populations in both BMMNC and PB were characterized based on a reference data from healthy samples and available Mission Bio data sets as: HSC (CD34+CD38+CD117+), likely megakaryocyte-erythroid progenitor cells (MEPs; CD38lowCD117+CD141highCD71highCD7+CD45lineage), likely myeloid and lymphoid progenitors (MLPs; CD34lowCD38+CD117+CD83+CD138+CD30+CD13+), myeloid progenitors (MPs; CD34low CD38+CD117+CD123+CD45RACD141+CD71+CD7+CD33+CD64+), immature neutrophils (Net_immature: LinCD16+CD62L+CD10 or CD33high), mature neutrophils (Net_mature: LinCD16+CD62L+CD10+), monocytes (mono; CD14+CD16+/−), plasmacytoid dendritic cells (pDCs; CD14CD123+FcεRIa+), conventional DCs (DCs; CD14CD141+CD11c+CD11b+), T lymphocytes (CD3+CD8+ or CD4+), B lymphocytes (CD19+), and natural killer cells (NKs; CD3CD56+CD7+). (E) Frequency of different blood subpopulations identified by scDNA in PB. Frequency of cells assigned as total neutrophils, MPs, T lymphocytes CD4+ or CD8+, NKs, total mono, DCs, and B cells are shown. (F) Clonal dynamics of UBA1mut and typical CH in 4 patients during follow-up. (G) Clonal dynamics of UBA1mut and typical CH in NIH-48 via ECS and single-cell proteogenomic sequencing. Somatic mutations in UBA1, SF3B1, and TET2 were first identified in bulk sequencing. Clonal trajectories elucidated by scDNA showed the presence of 4 independent clones in this patient: a WT, UBA1-mutated (UBA1mut), a SF3B1 p.K666N-mutated (SF3B1) and a SF3B1 clone that subsequently acquired a TET2 p.Q373Rfs mutation (SF3B1/TET2). Frequency of each clone (clone prevalence) and cell clusters based on expression of protein surface markers (cluster prevalence) in samples collected at 4 and 14 months of follow-up are shown.
Figure 3.
Figure 3.
Characterization of clonal dynamics in VEXAS via integrated ECS bulk sequencing and single-cell proteogenomic analysis. (A) Patterns of clonal trajectories. In VEXAS, increased cell fitness is primarily driven by UBA1 loss-of-function. Considering that UBA1 gene is located on chromosome X and all patients are male, cooccurrence with heterozygous typical CH mutations follow 2 major patterns that can be inferred by their VAF at PB: (1) pattern 1 is seen when typical CH precedes UBA1mut in a cell. Upon emergence of an UBA1 mutation, cells carrying both typical CH and UBA1 expand rapidly. Typical CH and UBA1 likely coexist in the same cell when their VAF follow a linear ratio of 1:2, or higher (Pattern 1). In contrast, pattern 2 is observed when UBA1mut precedes the acquisition of typical CH in the same cell or independently coexist with typical CH clones. In this case, the VAF of typical CH mutations and UBA1mut, which is commonly the dominant clone, follow no linear correlation at PB. (B) Clonal patterns of DNMT3A, TET2, and other typical CH mutations estimated based on their VAFs in the PB. Most DNMT3A mutations follow pattern 1, including the ones in the p.R882 hot spot. In contrast, TET2 and other typical CH mutations follow pattern 2.
Figure 4.
Figure 4.
Clinical outcomes in VEXAS. (A) Criteria used for presumed MDS diagnosis in VEXAS. (B) Predictors of survival using a univariate time-varying Cox model from the onset of symptoms. Variables that were significantly associated with an increased HR for mortality are highlighted by their P value (<.05). (C) Univariate logistic regression for MDS. Variables that were significantly associated with MDS are highlighted by their P value (<.05). (D) Epigenetic age and age acceleration of patients with VEXAS. Global DNA methylation was used to calculate patients’ epigenetic ages according to Horvath's clock. Patients were grouped based on their typical CH status: no typical CH, D/T (DNMT3A or TET2) mutations, D&T (DNMT3A and TET2) mutations, and mutations in other myeloid cancer genes regardless of having DNMT3A/TET2 mutations.

Comment in

Similar articles

Cited by

References

    1. Beck DB, Ferrada MA, Sikora KA, et al. Somatic mutations in UBA1 and severe adult-onset autoinflammatory disease. N Engl J Med. 2020;383(27):2628–2638. - PMC - PubMed
    1. Poulter JA, Collins JC, Cargo C, et al. Novel somatic mutations in UBA1 as a cause of VEXAS syndrome. Blood. 2021;137(26):3676–3681. - PMC - PubMed
    1. Obiorah IE, Patel BA, Groarke EM, et al. Benign and malignant hematologic manifestations in patients with VEXAS syndrome due to somatic mutations in UBA1. Blood Adv. 2021;5(16):3203–3215. - PMC - PubMed
    1. Georgin-Lavialle S, Terrier B, Guedon AF, et al. Further characterization of clinical and laboratory features in VEXAS syndrome: large-scale analysis of a multicentre case series of 116 French patients. Br J Dermatol. 2022;186(3):564–574. - PubMed
    1. Bourbon E, Heiblig M, Gerfaud Valentin M, et al. Therapeutic options in VEXAS syndrome: insights from a retrospective series. Blood. 2021;137(26):3682–3684. - PubMed

Publication types

Supplementary concepts