. 2023 Jun 29;141(26):3166-3183.
doi: 10.1182/blood.2022017839.

Inhibition of MYC translation through targeting of the newly identified PHB-eIF4F complex as a therapeutic strategy in CLL

Affiliations

Inhibition of MYC translation through targeting of the newly identified PHB-eIF4F complex as a therapeutic strategy in CLL

Anne Largeot et al. Blood. .

Abstract

Dysregulation of messenger RNA (mRNA) translation, including preferential translation of mRNA with complex 5' untranslated regions such as the MYC oncogene, is recognized as an important mechanism in cancer. Here, we show that both human and murine chronic lymphocytic leukemia (CLL) cells display a high translation rate, which is inhibited by the synthetic flavagline FL3, a prohibitin (PHB)-binding drug. A multiomics analysis performed in samples from patients with CLL and cell lines treated with FL3 revealed the decreased translation of the MYC oncogene and of proteins involved in cell cycle and metabolism. Furthermore, inhibiting translation induced a proliferation arrest and a rewiring of MYC-driven metabolism. Interestingly, contrary to other models, the RAS-RAF-(PHBs)-MAPK pathway is neither impaired by FL3 nor implicated in translation regulation in CLL cells. Here, we rather show that PHBs are directly associated with the eukaryotic initiation factor (eIF)4F translation complex and are targeted by FL3. Knockdown of PHBs resembled FL3 treatment. Importantly, inhibition of translation controlled CLL development in vivo, either alone or combined with immunotherapy. Finally, high expression of translation initiation-related genes and PHBs genes correlated with poor survival and unfavorable clinical parameters in patients with CLL. Overall, we demonstrated that translation inhibition is a valuable strategy to control CLL development by blocking the translation of several oncogenic pathways including MYC. We also unraveled a new and direct role of PHBs in translation initiation, thus creating new therapeutic opportunities for patients with CLL.


Conflict of interest statement

Conflict-of-interest disclosure: The authors declare no competing financial interests.

Figures

None
Graphical abstract
Figure 1.
Figure 1.
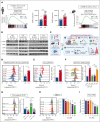
Translation is increased in CLL cells and can be inhibited by FL3. (A) Preranked gene set enrichment analysis (GSEA) from public data sets indicating an enrichment in translation in CLL cells compared with healthy B cells in human (NCBI Gene Expression Omnibus, GSE67640, GSEA, left panel; and EIF4A2 and EIF4G2 gene expression in healthy donor [HD] B cells vs CLL cells, middle panels), and in mouse (GSE175564, TCL1 cells compared with C57BL/6 B cells, right panel). (B) Western-blot analysis of phospho-eIF4E, eIF4E, eIF4A, eIF4G, and HSC70 proteins in B cells from HDs and patients with CLL. (C) Schematic representation of the OPP incorporation assay to evaluate translation rate. (D-F) Determination of translation rate by OPP assay in B cells from HDs and patients with CLL (D, n = 3), in normal B cells and CLL cells from patients with CLL (E, n = 5) and in T- and B-cell subsets from the spleen of sick recipient mice, after transfer of Eμ-TCL1 splenocytes (F, n = 5). Left panel: representative plots; right panel: quantification. (G-I) Determination of translation rate by OPP assay in patients’ CLL cells activated (Activ.) or not (Rest.) with CpG ODN-2006, and treated with dimethyl sulfoxide (DMSO) or 100 nM FL3 for 16 hours (left panel: representative plots; right panel: quantification; n = 21) (G), and in MEC-1 (H) or TCL1-355 (I) cells treated with DMSO or FL3 for 3 hours (0-50 nM) (left panel: representative plots; right panel: quantification; n = 3). (J) Schematic representation of proximity ligation assay (PLA) and determination of translation rate, based on PLA detection of eIF4E/eIF4G interaction, in patient CLL cells activated or not with CpG ODN-2006 and treated with DMSO or 100 nM FL3 for 3 hours (Rest.:858 cells, Activ.: 695 cells, and Activ.+FL3: 357 cells). (K) Schematic representation of polysome profiling, representative plot, and translation efficiency in MEC-1 cells treated with DMSO or 50 nM FL3 for 24 hours.
Figure 1.
Figure 1.
Translation is increased in CLL cells and can be inhibited by FL3. (A) Preranked gene set enrichment analysis (GSEA) from public data sets indicating an enrichment in translation in CLL cells compared with healthy B cells in human (NCBI Gene Expression Omnibus, GSE67640, GSEA, left panel; and EIF4A2 and EIF4G2 gene expression in healthy donor [HD] B cells vs CLL cells, middle panels), and in mouse (GSE175564, TCL1 cells compared with C57BL/6 B cells, right panel). (B) Western-blot analysis of phospho-eIF4E, eIF4E, eIF4A, eIF4G, and HSC70 proteins in B cells from HDs and patients with CLL. (C) Schematic representation of the OPP incorporation assay to evaluate translation rate. (D-F) Determination of translation rate by OPP assay in B cells from HDs and patients with CLL (D, n = 3), in normal B cells and CLL cells from patients with CLL (E, n = 5) and in T- and B-cell subsets from the spleen of sick recipient mice, after transfer of Eμ-TCL1 splenocytes (F, n = 5). Left panel: representative plots; right panel: quantification. (G-I) Determination of translation rate by OPP assay in patients’ CLL cells activated (Activ.) or not (Rest.) with CpG ODN-2006, and treated with dimethyl sulfoxide (DMSO) or 100 nM FL3 for 16 hours (left panel: representative plots; right panel: quantification; n = 21) (G), and in MEC-1 (H) or TCL1-355 (I) cells treated with DMSO or FL3 for 3 hours (0-50 nM) (left panel: representative plots; right panel: quantification; n = 3). (J) Schematic representation of proximity ligation assay (PLA) and determination of translation rate, based on PLA detection of eIF4E/eIF4G interaction, in patient CLL cells activated or not with CpG ODN-2006 and treated with DMSO or 100 nM FL3 for 3 hours (Rest.:858 cells, Activ.: 695 cells, and Activ.+FL3: 357 cells). (K) Schematic representation of polysome profiling, representative plot, and translation efficiency in MEC-1 cells treated with DMSO or 50 nM FL3 for 24 hours.
Figure 2.
Figure 2.
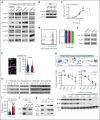
Multiomics analysis revealed that inhibition of translation affects proteins involved in translation, cell cycle regulation, MYC and other oncogenic pathways. (A) Schematic representation of pulsed SILAC assay. (B) Volcano plot showing differentially translated proteins (DTP) in CpG ODN-2006–activated cells from patients with CLL treated with DMSO or 100 nM of FL3 for 16 hours, with false discovery rate of <0.2 and log2–fold change of >1 (n = 5). (C) Volcano plot showing DTP between MEC-1 treated with DMSO or 50 nM of FL3 for 8 hours, with false discovery rate of <0.05 and log2–fold change of >1. (n = 3). (D) Heatmap depicting the ontology terms enriched in proteins with decreased translation in CpG ODN-2006–activated patient CLL cells, MEC-1 cells, and OSU-CLL cells treated with FL3. (E) Heatmap depicting the upstream factors that regulate the expression of proteins with decreased translation in CpG ODN-2006–activated patient CLL cells, MEC-1 cells, and OSU-CLL cells treated with FL3. (F) Heatmap showing the expression of DTP from selected pathways (identified in panels D-E) in samples from patients with CLL. (G-H) GSEA plots obtained from gene expression data generated from MEC-1 (G) and TCL1-355 cells (H) treated with DMSO or 50 nM FL3 for 24 hours. (I) Transcription factor enrichment analysis (top10) for differentially expressed genes downregulated by FL3. (J) Western-blot analysis of MYC proteins in patient CLL cells activated (Activ.) or not (Rest.) with CpG ODN-2006 and treated with DMSO or FL3 for 24 hours, and in MEC-1 and OSU-CLL cell lines treated for 3h. (K) Myc mRNA levels in cell lines treated with DMSO or 50 nM FL3 for 3 hours by quantitative reverse transcription polymerase chain reaction (qRT-PCR) (n = 3). (L) Myc mRNA ratio of expression in polysome vs subpolysome fractions of cells treated with DMSO or 50 nM FL3 for 24 hours. (M) Heatmap showing GSEA normalized enrichment scores (NES) from polysome profiling RNA sequencing. ∗P < .05, ∗∗P < .01, ∗∗∗P < .001.
Figure 2.
Figure 2.
Multiomics analysis revealed that inhibition of translation affects proteins involved in translation, cell cycle regulation, MYC and other oncogenic pathways. (A) Schematic representation of pulsed SILAC assay. (B) Volcano plot showing differentially translated proteins (DTP) in CpG ODN-2006–activated cells from patients with CLL treated with DMSO or 100 nM of FL3 for 16 hours, with false discovery rate of <0.2 and log2–fold change of >1 (n = 5). (C) Volcano plot showing DTP between MEC-1 treated with DMSO or 50 nM of FL3 for 8 hours, with false discovery rate of <0.05 and log2–fold change of >1. (n = 3). (D) Heatmap depicting the ontology terms enriched in proteins with decreased translation in CpG ODN-2006–activated patient CLL cells, MEC-1 cells, and OSU-CLL cells treated with FL3. (E) Heatmap depicting the upstream factors that regulate the expression of proteins with decreased translation in CpG ODN-2006–activated patient CLL cells, MEC-1 cells, and OSU-CLL cells treated with FL3. (F) Heatmap showing the expression of DTP from selected pathways (identified in panels D-E) in samples from patients with CLL. (G-H) GSEA plots obtained from gene expression data generated from MEC-1 (G) and TCL1-355 cells (H) treated with DMSO or 50 nM FL3 for 24 hours. (I) Transcription factor enrichment analysis (top10) for differentially expressed genes downregulated by FL3. (J) Western-blot analysis of MYC proteins in patient CLL cells activated (Activ.) or not (Rest.) with CpG ODN-2006 and treated with DMSO or FL3 for 24 hours, and in MEC-1 and OSU-CLL cell lines treated for 3h. (K) Myc mRNA levels in cell lines treated with DMSO or 50 nM FL3 for 3 hours by quantitative reverse transcription polymerase chain reaction (qRT-PCR) (n = 3). (L) Myc mRNA ratio of expression in polysome vs subpolysome fractions of cells treated with DMSO or 50 nM FL3 for 24 hours. (M) Heatmap showing GSEA normalized enrichment scores (NES) from polysome profiling RNA sequencing. ∗P < .05, ∗∗P < .01, ∗∗∗P < .001.
Figure 3.
Figure 3.
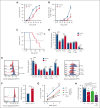
Targeting of MYC translation is associated with decreased proliferative capacities, and reversion of metabolic rewiring. (A) Viability of peripheral blood mononuclear cells from HDs, cells from patients with CLL, MEC-1 cells, and primary Eμ-TCL1 splenocytes treated for 72 hours with FL3 (0-500 nM) assessed by CCK8 assay. (B) Viability of sorted CD19+ B cells from HDs and patients with CLL, treated with FL3 (0-100 nM) for 48 hours (n = 3, Apotracker green and 7AAD staining). (C) Growth of MEC-1 cells treated with FL3 (0-50 nM) for 4 days (n = 3). (D) Growth of MEC-1 cells after drug withdrawal. The cells were treated (red, then green after withdrawal) with 50 nM FL3 or DMSO (blue) for 96 hours, before being washed and resuspended at 0.1 × 106 cells per mL without the drug at day 0. The growth was assessed for 5 days after drug withdrawal. (E) Percentage of apoptotic cells after 3, 24, or 48 hours of treatment with FL3 (0-50 nM) in MEC-1 cells determined by Apotracker green and propidium iodide (PI) staining. (F) Determination of the proliferation of MEC-1 cells based on carboxyfluorescein succinimidyl ester assay (left panel: representative plot, right panel: quantification, n = 3). (G) Metabolomic isotopologue analysis of MEC-1 and TCL1-355 cells treated with DMSO or 50 nM FL3 for 24 hours in the presence of [U-13C]-glucose (orange) and [U-13C]-glutamine (green). Relative metabolic fluxes are indicated with gray for the unlabeled fraction, in orange or green for the labeled fractions (n = 3). ∗P < .05, ∗∗P < .01, ∗∗∗P < .001, ∗∗∗∗P < .0001.
Figure 3.
Figure 3.
Targeting of MYC translation is associated with decreased proliferative capacities, and reversion of metabolic rewiring. (A) Viability of peripheral blood mononuclear cells from HDs, cells from patients with CLL, MEC-1 cells, and primary Eμ-TCL1 splenocytes treated for 72 hours with FL3 (0-500 nM) assessed by CCK8 assay. (B) Viability of sorted CD19+ B cells from HDs and patients with CLL, treated with FL3 (0-100 nM) for 48 hours (n = 3, Apotracker green and 7AAD staining). (C) Growth of MEC-1 cells treated with FL3 (0-50 nM) for 4 days (n = 3). (D) Growth of MEC-1 cells after drug withdrawal. The cells were treated (red, then green after withdrawal) with 50 nM FL3 or DMSO (blue) for 96 hours, before being washed and resuspended at 0.1 × 106 cells per mL without the drug at day 0. The growth was assessed for 5 days after drug withdrawal. (E) Percentage of apoptotic cells after 3, 24, or 48 hours of treatment with FL3 (0-50 nM) in MEC-1 cells determined by Apotracker green and propidium iodide (PI) staining. (F) Determination of the proliferation of MEC-1 cells based on carboxyfluorescein succinimidyl ester assay (left panel: representative plot, right panel: quantification, n = 3). (G) Metabolomic isotopologue analysis of MEC-1 and TCL1-355 cells treated with DMSO or 50 nM FL3 for 24 hours in the presence of [U-13C]-glucose (orange) and [U-13C]-glutamine (green). Relative metabolic fluxes are indicated with gray for the unlabeled fraction, in orange or green for the labeled fractions (n = 3). ∗P < .05, ∗∗P < .01, ∗∗∗P < .001, ∗∗∗∗P < .0001.
Figure 4.
Figure 4.
PHBs interact directly with the eIF4F translation initiation machinery, and FL3 binding disrupts this complex. (A) Western-blot analysis of p-RAF1, RAF1, p-ERK1/2, ERK1/2, p-eIF4E, and eIF4E proteins in patient CLL cells activated or not (resting) with anti-immunoglobulin M, and treated with DMSO or 100 nM FL3 for 3 hours, and MEC-1 and TCL1-355 cells treated with 50 nM FL3 for 3 hours. (B-D) MEC-1 cells treated with MNK1/2 inhibitor eFT-508 (0-10 μM) for 24 hours were analyzed by western blot for p-eIF4E and eIF4E levels (B), for proliferation (C), and protein synthesis (D, OPP assay), n = 3. (E-F) Western-blot analysis of p-4E-BP1 and 4E-BP1 (E) and PLA detection of eIF4E/4E-BP1 interaction (DMSO: 583 cells; FL3: 612 cells; n = 3) (F) in MEC-1 cells treated with DMSO or 50 nM FL3 for 3 hours. (G) Schematic representation of DARTS assay (upper panel). PHB and PHB2 stability in presence of pronase in MEC-1 cells treated with DMSO or 100 nM FL3 for 3 hours. Middle panels: % of PHB or PHB2 remaining at different concentrations of pronase, n = 3; lower panel: representative western blot. (H) Western-blot analysis of PHB and PHB2 proteins in HDs and patient CLL cells. (I) PHB gene expression in HD B cells vs CLL cells from patients with CLL (GSE67640 data set). (J) Western-blot analysis of eIF4E and PHB proteins after immunoprecipitation of eIF4E in MEC-1 cells. (K) Western-blot analysis of His-tag, HA-tag, and Myc-tag after immunoprecipitation of His-tag and HA-tag in HEK-293T cells overexpressing His-eIF4G, HA-eIF4E, and Myc-PHB. (L-M) PLA detection of eIF4E/PHB or eIF4G/PHB interactions in cells from patients with CLL that were activated or not with CpG ODN-2006 and treated with DMSO or 100 nM FL3 for 16 hours (K), and MEC-1 cells treated with 50 nM FL3 for 3 hours (left panel: representative image; right panel: quantification; L, upper: Rest.: 1147 cells, Activ.: 1223 cells, Activ+FL3: 1097 cells; L, lower: Rest.: 1297 cells, Activ.: 1195 cells, Activ+FL3: 1155 cells; M, upper: DMSO: 419 cells, FL3: 411; M, lower: DMSO: 53, FL3: 52; n = 3). (N) Schematic representation of NanoBRET assay and BRET ratio measured in HEK-293T cells transfected with increasing amounts of plasmids encoding PHBs fused with the nanoluciferase (NLF) and either eIF4E or HT fused with the NG. ∗P < .05, ∗∗∗P < .001, ∗∗∗∗P < .0001. ND, not digested.
Figure 4.
Figure 4.
PHBs interact directly with the eIF4F translation initiation machinery, and FL3 binding disrupts this complex. (A) Western-blot analysis of p-RAF1, RAF1, p-ERK1/2, ERK1/2, p-eIF4E, and eIF4E proteins in patient CLL cells activated or not (resting) with anti-immunoglobulin M, and treated with DMSO or 100 nM FL3 for 3 hours, and MEC-1 and TCL1-355 cells treated with 50 nM FL3 for 3 hours. (B-D) MEC-1 cells treated with MNK1/2 inhibitor eFT-508 (0-10 μM) for 24 hours were analyzed by western blot for p-eIF4E and eIF4E levels (B), for proliferation (C), and protein synthesis (D, OPP assay), n = 3. (E-F) Western-blot analysis of p-4E-BP1 and 4E-BP1 (E) and PLA detection of eIF4E/4E-BP1 interaction (DMSO: 583 cells; FL3: 612 cells; n = 3) (F) in MEC-1 cells treated with DMSO or 50 nM FL3 for 3 hours. (G) Schematic representation of DARTS assay (upper panel). PHB and PHB2 stability in presence of pronase in MEC-1 cells treated with DMSO or 100 nM FL3 for 3 hours. Middle panels: % of PHB or PHB2 remaining at different concentrations of pronase, n = 3; lower panel: representative western blot. (H) Western-blot analysis of PHB and PHB2 proteins in HDs and patient CLL cells. (I) PHB gene expression in HD B cells vs CLL cells from patients with CLL (GSE67640 data set). (J) Western-blot analysis of eIF4E and PHB proteins after immunoprecipitation of eIF4E in MEC-1 cells. (K) Western-blot analysis of His-tag, HA-tag, and Myc-tag after immunoprecipitation of His-tag and HA-tag in HEK-293T cells overexpressing His-eIF4G, HA-eIF4E, and Myc-PHB. (L-M) PLA detection of eIF4E/PHB or eIF4G/PHB interactions in cells from patients with CLL that were activated or not with CpG ODN-2006 and treated with DMSO or 100 nM FL3 for 16 hours (K), and MEC-1 cells treated with 50 nM FL3 for 3 hours (left panel: representative image; right panel: quantification; L, upper: Rest.: 1147 cells, Activ.: 1223 cells, Activ+FL3: 1097 cells; L, lower: Rest.: 1297 cells, Activ.: 1195 cells, Activ+FL3: 1155 cells; M, upper: DMSO: 419 cells, FL3: 411; M, lower: DMSO: 53, FL3: 52; n = 3). (N) Schematic representation of NanoBRET assay and BRET ratio measured in HEK-293T cells transfected with increasing amounts of plasmids encoding PHBs fused with the nanoluciferase (NLF) and either eIF4E or HT fused with the NG. ∗P < .05, ∗∗∗P < .001, ∗∗∗∗P < .0001. ND, not digested.
Figure 5.
Figure 5.
Silencing of PHBs inhibits translation and replicates the effects of FL3 treatment. MEC-1 cells were transfected with plasmids encoding short hairpin RNA (shRNA) against Scramble (shCtrl), PHB (shPHB), and PHB2 (shPHB2) and analyzed 72 to 96 hours after transfection. (A) Gene expression measured by qRT-PCR (72 hours, n = 3). (B) Determination of translation rate (OPP assay, 72 hours, n = 3). (C) PLA detection of eIF4E/eIF4G interaction (72 hours; shCtrl: 117 cells; shPHB: 127 cells; and shPHB2: 92 cells; n = 3). (D) Growth of cells up to 96 hours after transfection (n = 4). (E) Determination of proliferation (carboxyfluorescein succinimidyl ester assay, 96 hours, n = 3). (F) Western-blot analysis of MYC protein (72 hours). (G) Metabolomic isotopologue analysis of cells (72 hours, tracers incubated after 48 hours) in the presence of [U-13C]-glucose (orange) and [U-13C]-glutamine (green). Relative metabolic fluxes are indicated with gray for the unlabeled fraction, in orange or green for the labeled fractions. ∗P < .05, ∗∗P < .01, ∗∗∗P < .001, ∗∗∗∗P < .0001.
Figure 5.
Figure 5.
Silencing of PHBs inhibits translation and replicates the effects of FL3 treatment. MEC-1 cells were transfected with plasmids encoding short hairpin RNA (shRNA) against Scramble (shCtrl), PHB (shPHB), and PHB2 (shPHB2) and analyzed 72 to 96 hours after transfection. (A) Gene expression measured by qRT-PCR (72 hours, n = 3). (B) Determination of translation rate (OPP assay, 72 hours, n = 3). (C) PLA detection of eIF4E/eIF4G interaction (72 hours; shCtrl: 117 cells; shPHB: 127 cells; and shPHB2: 92 cells; n = 3). (D) Growth of cells up to 96 hours after transfection (n = 4). (E) Determination of proliferation (carboxyfluorescein succinimidyl ester assay, 96 hours, n = 3). (F) Western-blot analysis of MYC protein (72 hours). (G) Metabolomic isotopologue analysis of cells (72 hours, tracers incubated after 48 hours) in the presence of [U-13C]-glucose (orange) and [U-13C]-glutamine (green). Relative metabolic fluxes are indicated with gray for the unlabeled fraction, in orange or green for the labeled fractions. ∗P < .05, ∗∗P < .01, ∗∗∗P < .001, ∗∗∗∗P < .0001.
Figure 6.
Figure 6.
FL3 alone, or in combination with immunotherapy, controls CLL development in vivo. (A-B) Percentage (A) and number (B) of CD19+CD5+ CLL cells in the peripheral blood (PB) of C57BL/6 mice after adoptive transfer of splenocytes from a sick Eμ-TCL1 mouse, and treated with vehicle (n = 9) or FL3 (n = 8). (C) Survival of mice from panels A-B. (D) Percentage of CLL cells (CD19+CD5+), B cells (CD19+CD5), CD8+ T cells (CD3+CD8+), CD4+ T cells (CD3+CD4+), and Tregs (CD4+FOXP3+) in the spleen of mice treated with vehicle or FL3, 17 days after adoptive transfer of splenocytes from a sick Eμ-TCL1 mouse (n = 5). (E) Determination of the translation rate in cells from panel D. (F) Determination of the translation rate in PD-L1high or PD-L1low CD19+CD5+ CLL cells from the spleen of C57BL/6 mice after TCL1 adoptive transfer (n = 4). (G-H) Percentage of CLL cells in the blood at the indicated time points (G) and the spleen at euthanasia (H) of C57BL/6 mice after adoptive transfer of splenocytes from a sick Eμ-TCL1 mouse, and treated with vehicle, FL3, anti-PD1 antibody, or the combination FL3/anti-PD1. ∗P < .05, ∗∗P < .01, ∗∗∗P < .001, ∗∗∗∗P < .0001.
Figure 7.
Figure 7.
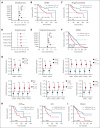
Expression of translation-related genes correlates with disease progression and poor survival in patients with CLL. Gene expression analysis was performed by qRT-PCR for 8 genes involved in translation in a cohort of 144 patients with CLL. The relationship between gene expression and survival was evaluated by Cox univariate regression analysis. Gene expression in clinical groups was evaluated by differential expression analysis for single genes or by logistic regression (LR) analysis for multiple genes. (A,E) Calculated HRs >1 (red dots, P value <.05) indicate an increased risk for patients with high single-gene expression in term of OS (A) and TFS (E). (B,F) Relation between high or low eIF4E2 gene expression and OS (B) or TFS (F). Low and high groups are of identical size (n = 72). (C) Relationship between high or low combined 8-gene expression and OS. (D) Calculated HRs >1 (red dots, P value <.05) indicate an increased risk for patients with high multiple gene expression in term of OS. (G) Standardized expression of single genes in groups of patients based on prognostic markers (CytoG unfav.: cytogenetics unfavorable; group size indicated in each panel). (H-I) Relation between high or low eIF4E2 gene expression and OS in patients with IGHVUM or LPL+ CLL (H), and TFS in patients with Binet A CLL (I). ∗P < .05, ∗∗P < .01, ∗∗∗P < .001.

Comment in

  • Targeting mRNA translation in CLL.
    Küppers R. Küppers R. Blood. 2023 Jun 29;141(26):3129-3130. doi: 10.1182/blood.2023020420. Blood. 2023. PMID: 37383005 No abstract available.

References

    1. Burger JA, Chiorazzi N. B cell receptor signaling in chronic lymphocytic leukemia. Trends Immunol. 2013;34(12):592–601. - PMC - PubMed
    1. Dadashian EL, McAuley EM, Liu D, et al. TLR signaling is activated in lymph node-resident CLL cells and is only partially inhibited by ibrutinib. Cancer Res. 2019;79(2):360–371. - PMC - PubMed
    1. Brown JR. How I treat CLL patients with ibrutinib. Blood. 2018;131(4):379–386. - PubMed
    1. Filip D, Mraz M. The role of MYC in the transformation and aggressiveness of 'indolent' B-cell malignancies. Leuk Lymphoma. 2020;61(3):510–524. - PubMed
    1. Moussay E, Palissot V, Vallar L, et al. Determination of genes and microRNAs involved in the resistance to fludarabine in vivo in chronic lymphocytic leukemia. Mol Cancer. 2010;9:115. - PMC - PubMed

Publication types

MeSH terms