. 2023 May;56(5):e13481.
doi: 10.1111/cpr.13481. Epub 2023 Apr 21.

m6 A promotes planarian regeneration

Affiliations

m6 A promotes planarian regeneration

Guanshen Cui et al. Cell Prolif. 2023 May.

Abstract

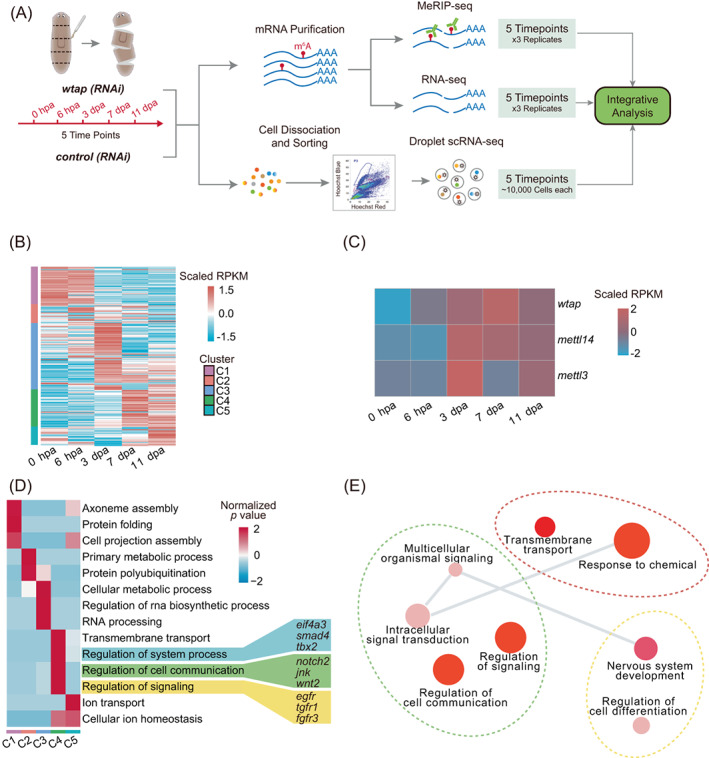
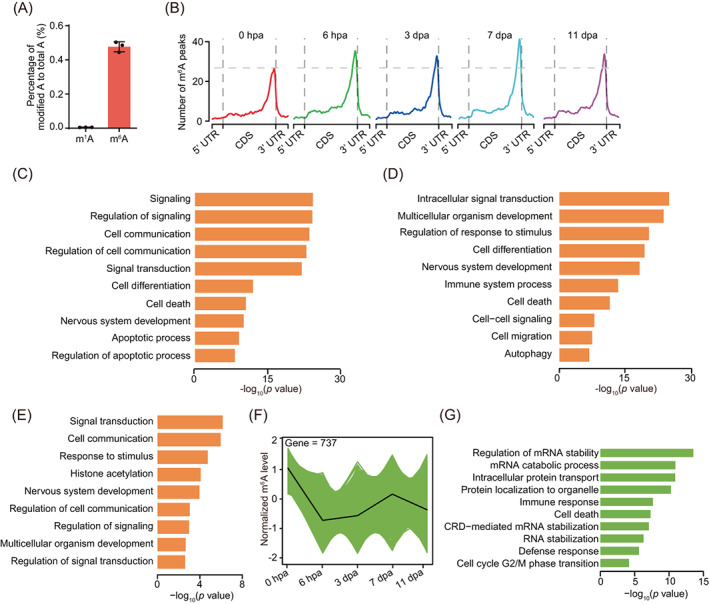
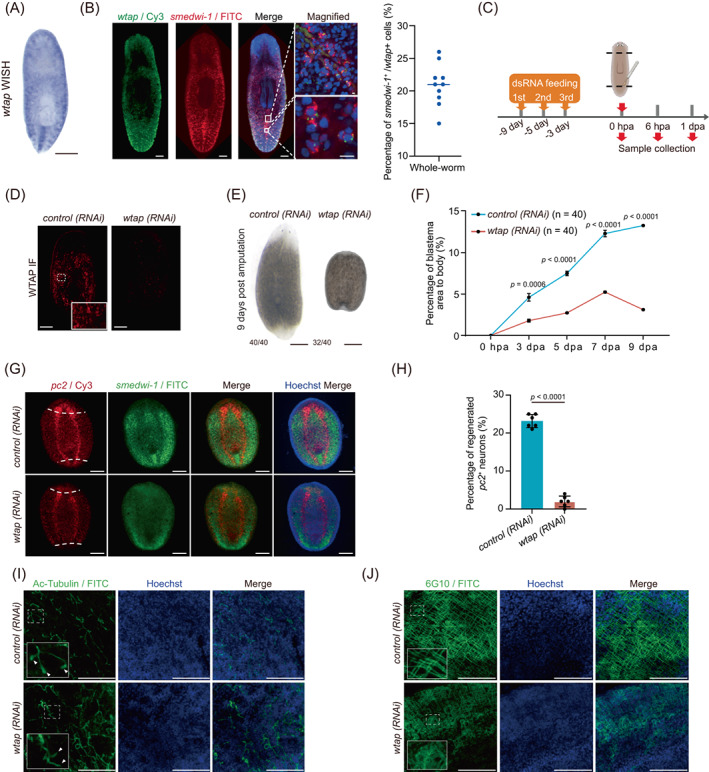
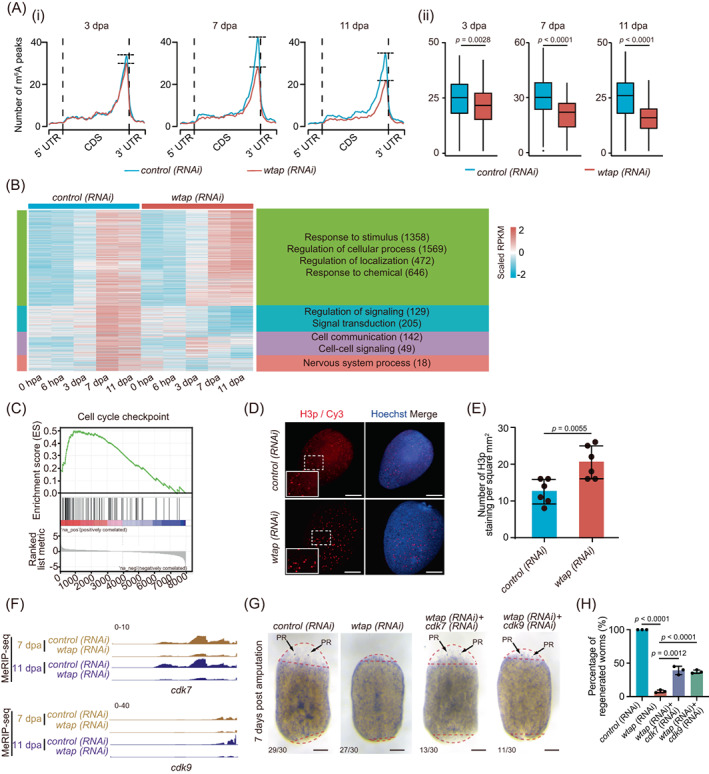
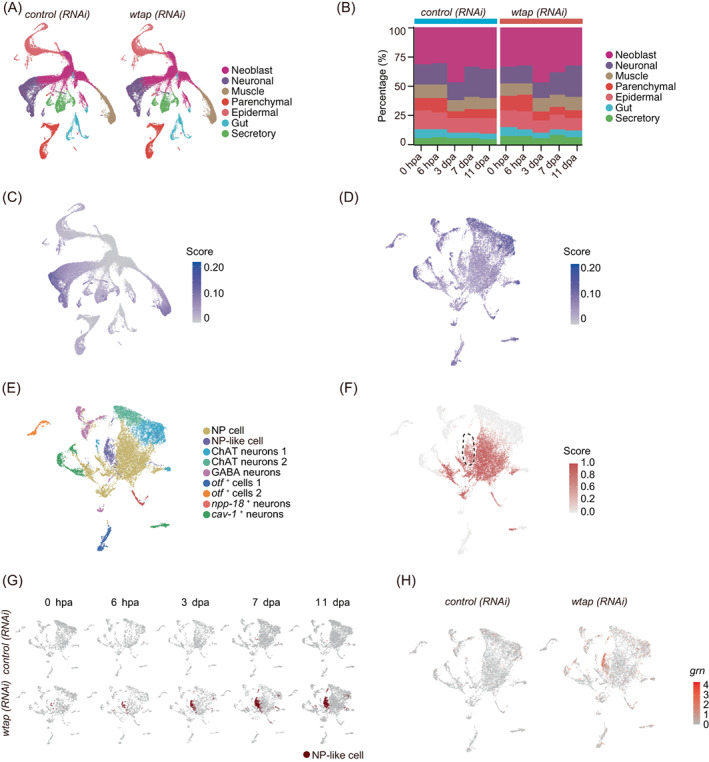
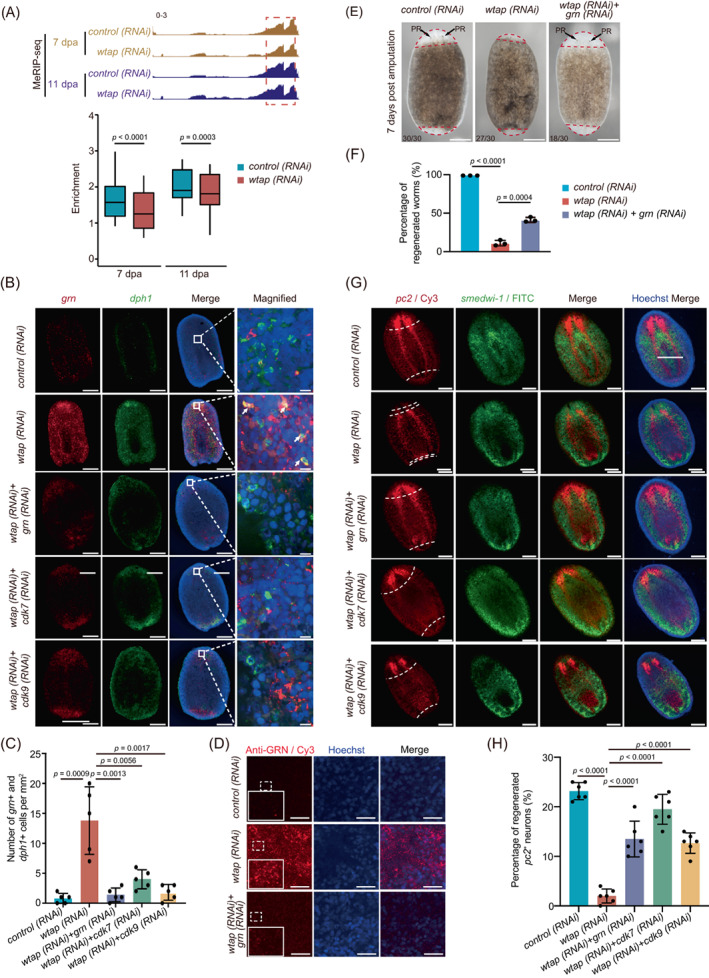
Regeneration is the regrowth of damaged tissues or organs, a vital process in response to damages from primitive organisms to higher mammals. Planarian possesses active whole-body regenerative capability owing to its vast reservoir of adult stem cells, neoblasts, providing an ideal model to delineate the underlying mechanisms for regeneration. RNA N6 -methyladenosine (m6 A) modification participates in many biological processes, including stem cell self-renewal and differentiation, in particular the regeneration of haematopoietic stem cells and axons. However, how m6 A controls regeneration at the whole-organism level remains largely unknown. Here, we demonstrate that the depletion of m6 A methyltransferase regulatory subunit wtap abolishes planarian regeneration, potentially through regulating genes related to cell-cell communication and cell cycle. Single-cell RNA-seq (scRNA-seq) analysis unveils that the wtap knockdown induces a unique type of neural progenitor-like cells (NP-like cells), characterized by specific expression of the cell-cell communication ligand grn. Intriguingly, the depletion of m6 A-modified transcripts grn, cdk9 or cdk7 partially rescues the defective regeneration of planarian caused by wtap knockdown. Overall, our study reveals an indispensable role of m6 A modification in regulating whole-organism regeneration.


Conflict of interest statement

The authors declare no competing interests.

Figures

FIGURE 1
FIGURE 1
m6A methyltransferase complex upregulated during planarian regeneration. (A) Experimental outline of multi‐omics data including methylated RNA immunoprecipitation sequencing (MeRIP‐seq), bulk RNA‐seq and single‐cell RNA‐seq. (B) Heatmap showing the expression levels of all expressed genes and clustered into five categories based on expression pattern during planarian regeneration (left side of the heatmap). Genes were clustered by MEV with parameter—distance‐metric‐selection = Pearson correlation, number of cluster = 5, maximum iterations = 50 and plot with the parameter ‘pheatmap (matrix, scale =“row”)’ through pheatmap function (R package). (C) Heatmap showing the expression levels of major components of m6A writers during regeneration. (D) Heatmap showing the enriched gene ontology (GO) and important genes of five different categories as shown in (B). The colour bar of heatmap represents z‐score of GO's p‐value. (E) Gene ontology of genes belongs to fourth category (C4) shown in (B). Visualization was performed using Revigo with default parameters (semantic similarity measure = SimRel).
FIGURE 2
FIGURE 2
m6A changes dynamically during planarian regeneration. (A) Barplot showing the abundance of m1A and m6A along mRNA. The methylation level of each RNA methylation was quantified via UHPLC‐MRM‐MS/MS. The abundance of each modification was calculated with the percentage of modified A to total A. (B) Metagene profiles of m6A peaks along transcripts with three non‐overlapping segments (5′UTR, CDS and 3′UTR) for five regeneration stages. (C) Barplot showing the significant GO terms for 6385 mRNAs that conserved with m6A modification of five different timepoints shown in Figure S1C. (D) Barplot showing the significant gene ontology (GO) terms for 12,016 mRNAs that with m6A modification of at least one timepoint during regeneration showing in Figure S1C. (E) Barplot showing the significant GO terms for 1532 mRNAs that with m6A modification of four different regeneration timepoints (6 hpa, 3 dpa, 7 dpa and 11 dpa) showing in Figure S1C. (F) Line chart showing one of the trends (fourth category) of mRNAs m6A level during regeneration, which with gradual decreased m6A level from 0 hpa to 11 dpa. mRNAs with different expression pattern were defined by MEV with parameter—distance‐metric‐selection = Pearson correlation, number of cluster = 4, maximum‐iterations = 50. (G) Barplot showing the significant GO terms for mRNAs shown in Figure 2F. See also Figure S1.
FIGURE 3
FIGURE 3
wtap depletion leads to regeneration defects. (A) WISH showing the expression and localization of wtap transcripts in planarians. Scale bar, 300 μm. (B) Whole‐mount fluorescent in situ hybridization showing the expression and localization of wtap and smedwi‐1 transcripts. Scale bar, 100 μm (left panels), 10 μm (right upper row), 10 μm (right lower row). Right panel, scatter plot showing the percentage of smedwi‐1 +/wtap + cells. (C) Schematic diagram showing the knockdown strategy and amputation position. (D) Immunofluorescence showing expression and localization of WTAP protein in control (control) and wtap knockdown (wtap RNA interference [RNAi]) planarians (n ≥ 3). Scale bar, 200 μm. (E) Bright‐field image showing total body sizes for control (control) and wtap knockdown (wtap RNAi) planarians at 9 dpa. Scale bar, 500 μm. Bottom left number, planarians with phenotype of total tested. (F) Percentage of blastema area to total body size in control (control) and wtap knockdown (wtap RNAi) planarians. Error bars represent standard deviation. Data are the mean ± S.D (n ≥ 3 independent experiments). The p values were determined using a two‐sided unpaired Student's t‐test. (G) Whole‐mount fluorescent in situ hybridization showing expressions and localizations of pc2 (red) and smedwi‐1 (green) along whole body of control (control) and wtap knockdown (wtap RNAi) planarians at 7 dpa. Dotted line, amputation plane (n ≥ 3). Scale bar, 200 μm. (H) Quantification analysis of the percentage of regenerated pc2 positive neuron in control (control) and wtap knockdown (wtap RNAi) planarians at 7 dpa. Error bars represent standard deviation. Data are the mean ± S.D. (n ≥ 3 independent experiments). The p values were determined using a two‐sided unpaired Student's t‐test. (I) Immunofluorescence showing the distribution of Ac‐Tubulin protein in control (control) and wtap knockdown (wtap RNAi) planarians at 7 dpa. Arrow indicates the presence of flame cell in the protonephridia of control (control) planarians, and missing in the wtap knockdown (wtap RNAi) planarians (n ≥ 3). Scale bar, 75 μm. (J) Immunofluorescence shows the distribution of 6G10 protein distribution in control (control) and wtap knockdown (wtap RNAi) planarians at 7 dpa. (n ≥ 3) Scale bar, 75 μm. See also Figure S2.
FIGURE 4
FIGURE 4
WTAP‐mediated m6A controls cell cycle‐ and cell–cell communication‐related factors. (A) (i) Metagene profiles of m6A peaks along transcripts with three non‐overlapping segments (5′‐UTR, CDS and 3′‐UTR) for control (blue) and wtap knockdown (red) planarians of different regeneration timepoints (3, 7, and 11 dpa). (ii) Boxplot showing the difference in the number of m6A peaks that located near stop codon of transcripts of control (blue) and wtap knockdown (red) planarians at 3, 7 and 11 dpa. The p values were determined using Wilcoxon‐test. (B) For genes from cluster 4 (C4) in Figure 1B, the expression level during regeneration were displayed for both control and wtap knockdown planarians of five timepoints. Then those genes were separated into four new sub‐groups based on expression features and the enriched GO terms were shown for each sub‐group. Genes with different expression pattern were defined by MEV with parameter–distance‐metric‐selection = Pearson‐correlation–number‐of‐cluster = 4–maximum‐iterations = 50. (C) GSEA plots evaluating the changes in cell cycle checkpoint pathway upon wtap depletion. Normalized p value <0.01. (D) Immunofluorescence showing the distribution of H3P protein in control (control) and wtap knockdown (wtap RNA interference [RNAi]) planarians at 5 dpa. Scale bar, 200 μm. Enlarged field was selected to best represent the statistical mean of staining signals. (E) Statistical analysis for H3p immunostaining. Error bars represent standard deviation. Data are the mean ± S.D. (n ≥ 3 independent experiments). The p values were determined using a two‐sided unpaired Student's t‐test. (F) Integrative genomics viewer tracks displaying the distributions of MeRIP‐seq data that normalized by RNA‐seq data along cdk7 and cdk9 in both control (top) and wtap knockdown (bottom) planarians at 7 dpa and 11 dpa. (G) Bright‐field images showing the phenotypes of control, wtap, cdk7 + wtap and cdk9 + wtap knockdown planarians at 7 dpa. Scale bar, 200 μm. Bottom left number, number of planarians with phenotype versus total number tested. (H) Barplot showing percentage of regenerated worms to total sample size in control, wtap, cdk7 + wtap and cdk9 + wtap knockdown planarians at 7 dpa. Error bars represent standard deviation. Data are the mean ± S.D. (n ≥ 3 independent experiments). The p values were determined using a two‐sided unpaired Student's t‐test. See also Figure S3.
FIGURE 5
FIGURE 5
Single‐cell atlas unveils cell‐type specific regulation of WTAP essential for regeneration. (A) Based on single‐cell RNA‐seq data, Uniform Manifold Approximation and Projection (UMAP) detect major cell types in both control (left) and wtap knockdown (right) planarians of 5 timepoints during regeneration (0 hpa, 6 hpa, 3 dpa, 7 dpa and 11 dpa). Each point depicts a single cell, coloured according to cell types. (B) The percentage of each cell type in control (left) and wtap knockdown (right) planarians during regeneration. (C) Expression score of transcripts with m6A modifications are plotted onto the UMAP map. Expression score is calculated by using the AddModuleScore function from Seurat, and the transcripts used to score cells are from cluster 4 (C4) of Figure 1B and required with m6A modification. (D) Expression score of transcripts with m6A modifications are plotted onto the UMAP map in neuronal cells. Expression score is calculated by using the AddModuleScore function from Seurat, and the transcripts used to score cells are from cluster 4 (C4) of Figure 1B and required with m6A modification. (E) UMAP plot demonstrates nine sub‐clusters of neuronal cells in control and wtap knockdown planarians. Each point depicts a single cell, coloured according to cell types. (F) The NP cell prediction score of neuronal cells. The score is calculated by using the TransferData function from Seurat and the score represents the degree of similarity to neuronal progenitor cells. (G) UMAP plot showing a novel cell type, NP‐like cells, mainly occur in wtap knockdown planarians but rarely in controls. Each point depicts a single cell. (H) Expression level of grn in neuronal cells. Control samples on the left, wtap knockdown samples on the right. See also Figure S4.
FIGURE 6
FIGURE 6
WTAP‐mediated m6A depletion increases GRN levels, and influences cell–cell communication essential for planarian regeneration. (A) Integrative genomics viewer tracks displaying the distributions of methylated RNA immunoprecipitation sequencing (MeRIP‐seq) data that normalized by RNA‐seq data along grn in both control and wtap knockdown planarians at 7 and 11 dpa (top). Barplot showing the enrichment of m6A modification on grn. The p values were determined using Wilcoxon‐test. (B) Whole‐mount fluorescent in situ hybridization showing expressions of grn (red) and dph1 (green) in control, wtap knockdown (wtap RNA interference [RNAi]), double knockdown of wtap and grn (wtap + grn RNAi), double knockdown of wtap and cdk7 (wtap + cdk7 RNAi), double knockdown of wtap and cdk9 (wtap + cdk9 RNAi) planarians at 7 dpa. Hoechst indicates DNA staining. Scale bar, 200 μm (left panels), 10 μm (magnified panels). (C) Barplot showing the number of grn +/dph1 + cells of control (control), wtap knockdown (wtap RNAi), double knockdown of wtap and grn (wtap + grn RNAi), double knockdown of wtap and cdk7 (wtap + cdk7 RNAi), double knockdown of wtap and cdk9 (wtap + cdk9 RNAi) planarians in (B). Data were analysed by the two‐tailed unpaired Student's t‐test (bottom). (D) Immunofluorescence showing the expression and localization of GRN protein in control (control), wtap knockdown (wtap RNAi), double knockdown of wtap and grn (wtap + grn RNAi) planarians at 7 dpa. Hoechst indicates DNA staining. Scale bar, 100 μm. (E) Bright‐field images showing the phenotypes of control (control), wtap knockdown (wtap RNAi), double knockdown of wtap and grn (wtap + grn RNAi) planarians at 7 dpa. Scale bar, 300 μm. Bottom left number, number of planarians with phenotype versus total number tested. (F) Barplot showing percentage of regenerated worms in control (control), wtap knockdown (wtap RNAi), double knockdown of wtap and grn (wtap + grn RNAi) planarians at 7 dpa. Error bars represent standard deviation. Data are the mean ± SD (n ≥ 3 independent experiments). The p values were determined using a two‐sided unpaired Student's t‐test. (G) Whole‐mount fluorescent in situ hybridization showing expressions and localizations of pc2 (red) and smedwi‐1 (green) of control (control), wtap knockdown (wtap RNAi), double knockdown of wtap and grn (wtap + grn RNAi), double knockdown of wtap and cdk7 (wtap + cdk7 RNAi) and double knockdown of wtap and cdk9 (wtap + cdk9 RNAi) planarians at 7 dpa. Dotted line, amputation plane (n ≥ 3). Scale bar, 200 μm. (H) Quantification of percentage of pc2 positive regenerated neurons in each group of (G). Error bars represent standard deviation. Data are the mean ± SD (n ≥ 3 independent experiments). The p values were determined using a two‐sided unpaired Student's t‐test. See also Figures S5–S7.

References

    1. Gierer A, Berking S, Bode H, et al. Regeneration of hydra from reaggregated cells. Nat New Biol. 1972;239:98‐101. - PubMed
    1. Poss KD, Wilson LG, Keating MT. Heart regeneration in zebrafish. Science. 2002;298:2188‐2190. - PubMed
    1. Wells JM, Watt FM. Diverse mechanisms for endogenous regeneration and repair in mammalian organs. Nature. 2018;557:322‐328. - PubMed
    1. Alvarado AS, Tsonis PA. Bridging the regeneration gap: genetic insights from diverse animal models. Nat Rev Genet. 2006;7:873‐884. - PubMed
    1. Reddien PW. The cellular and molecular basis for planarian regeneration. Cell. 2018;175:327‐345. - PMC - PubMed