. 2023 May 18;83(10):1725-1742.e12.
doi: 10.1016/j.molcel.2023.03.026. Epub 2023 Apr 20.

Proteomic discovery of chemical probes that perturb protein complexes in human cells

Affiliations

Proteomic discovery of chemical probes that perturb protein complexes in human cells

Michael R Lazear et al. Mol Cell. .

Abstract

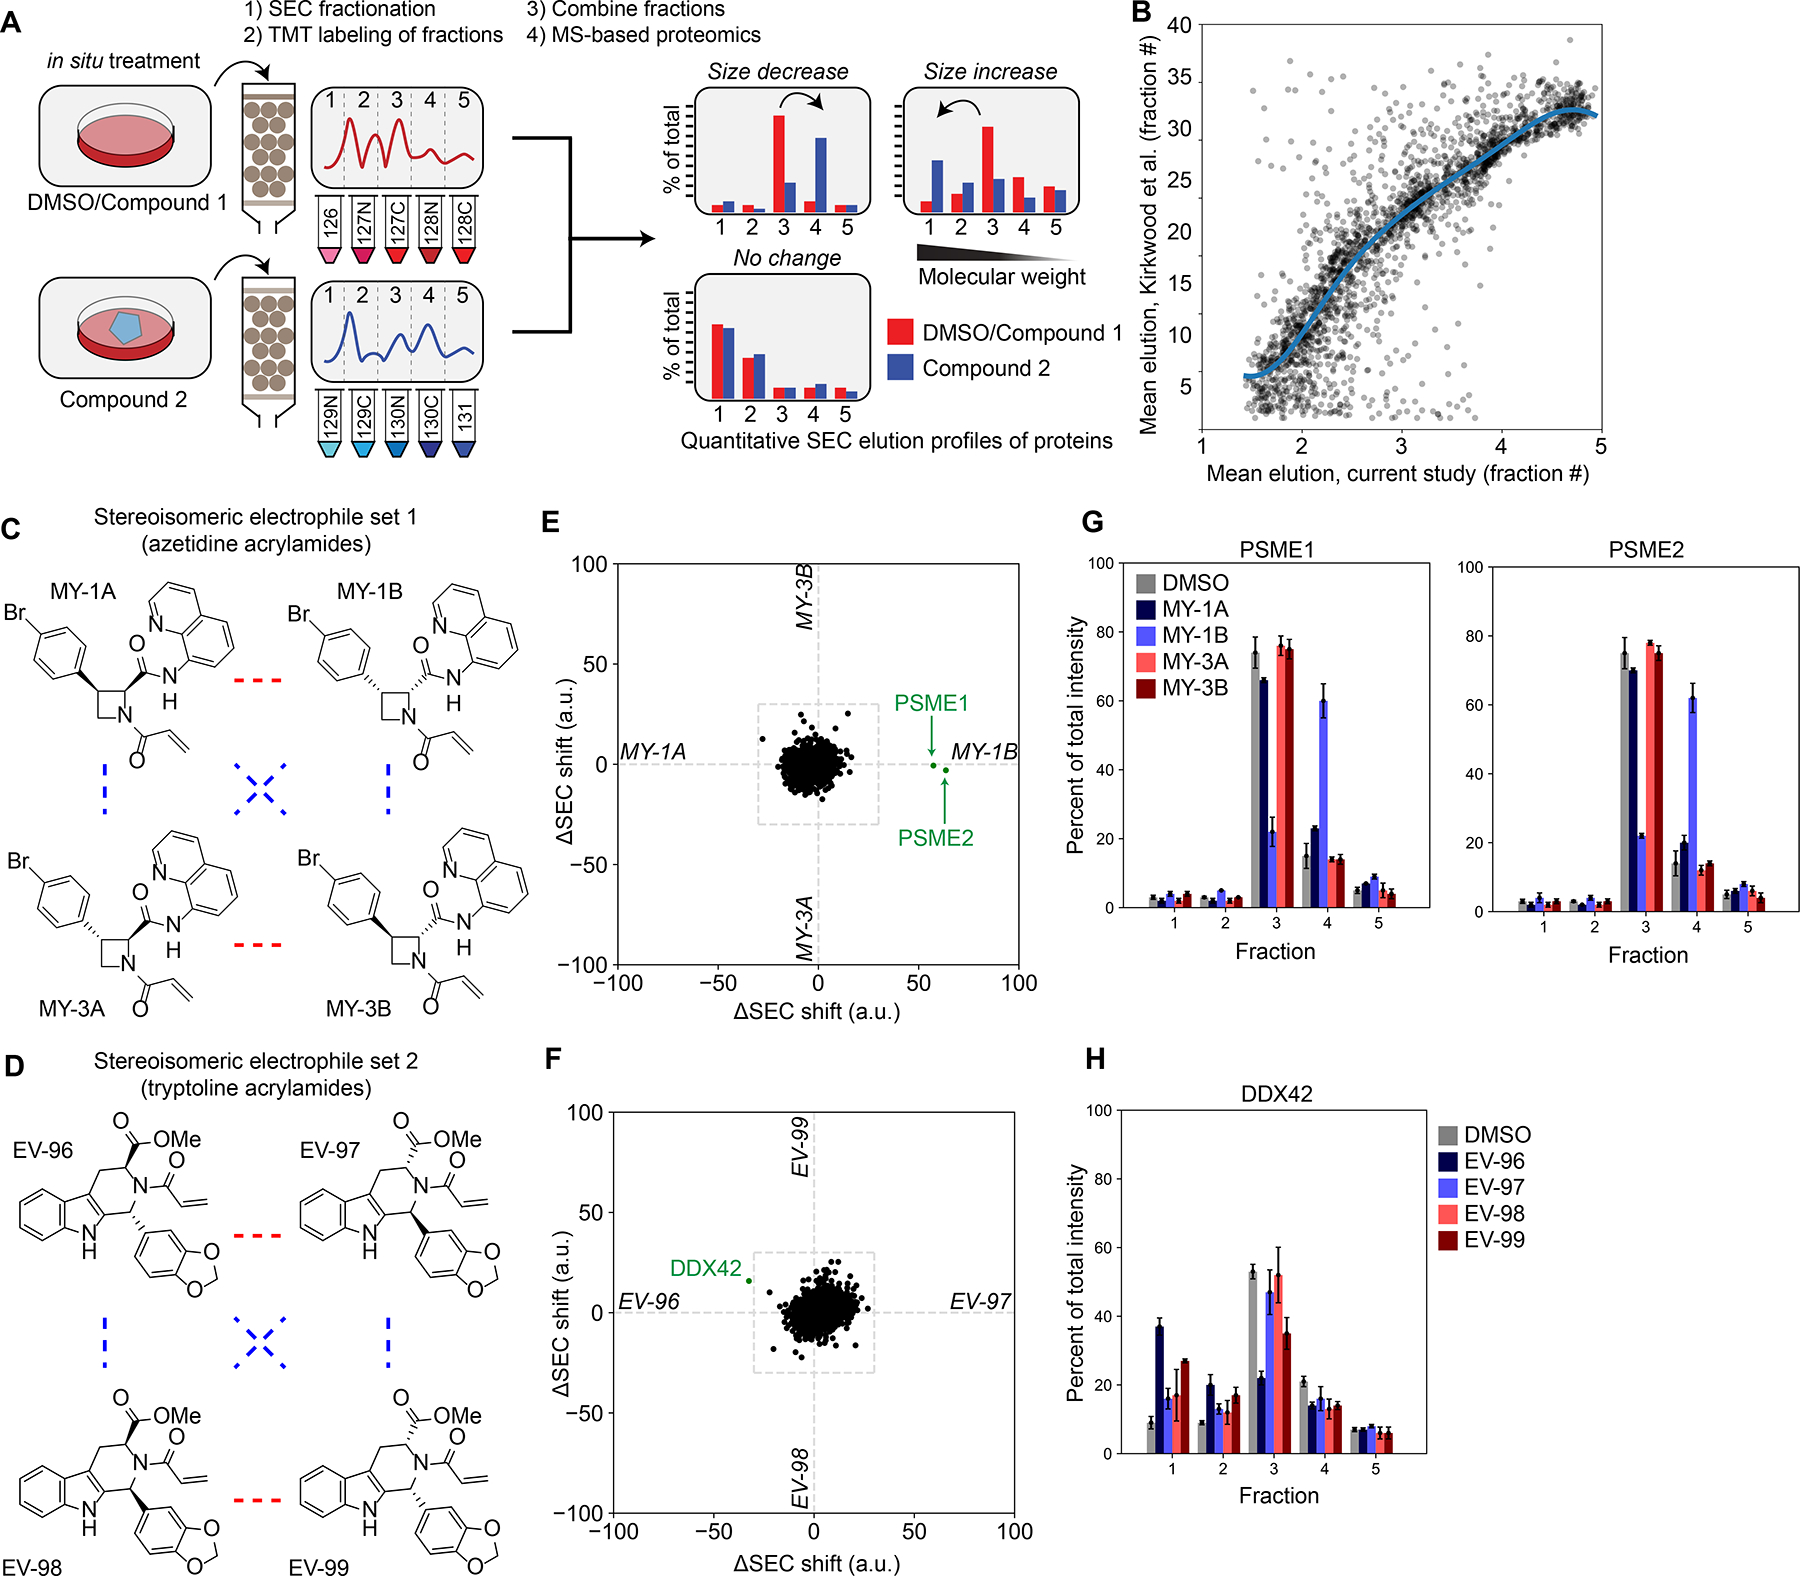
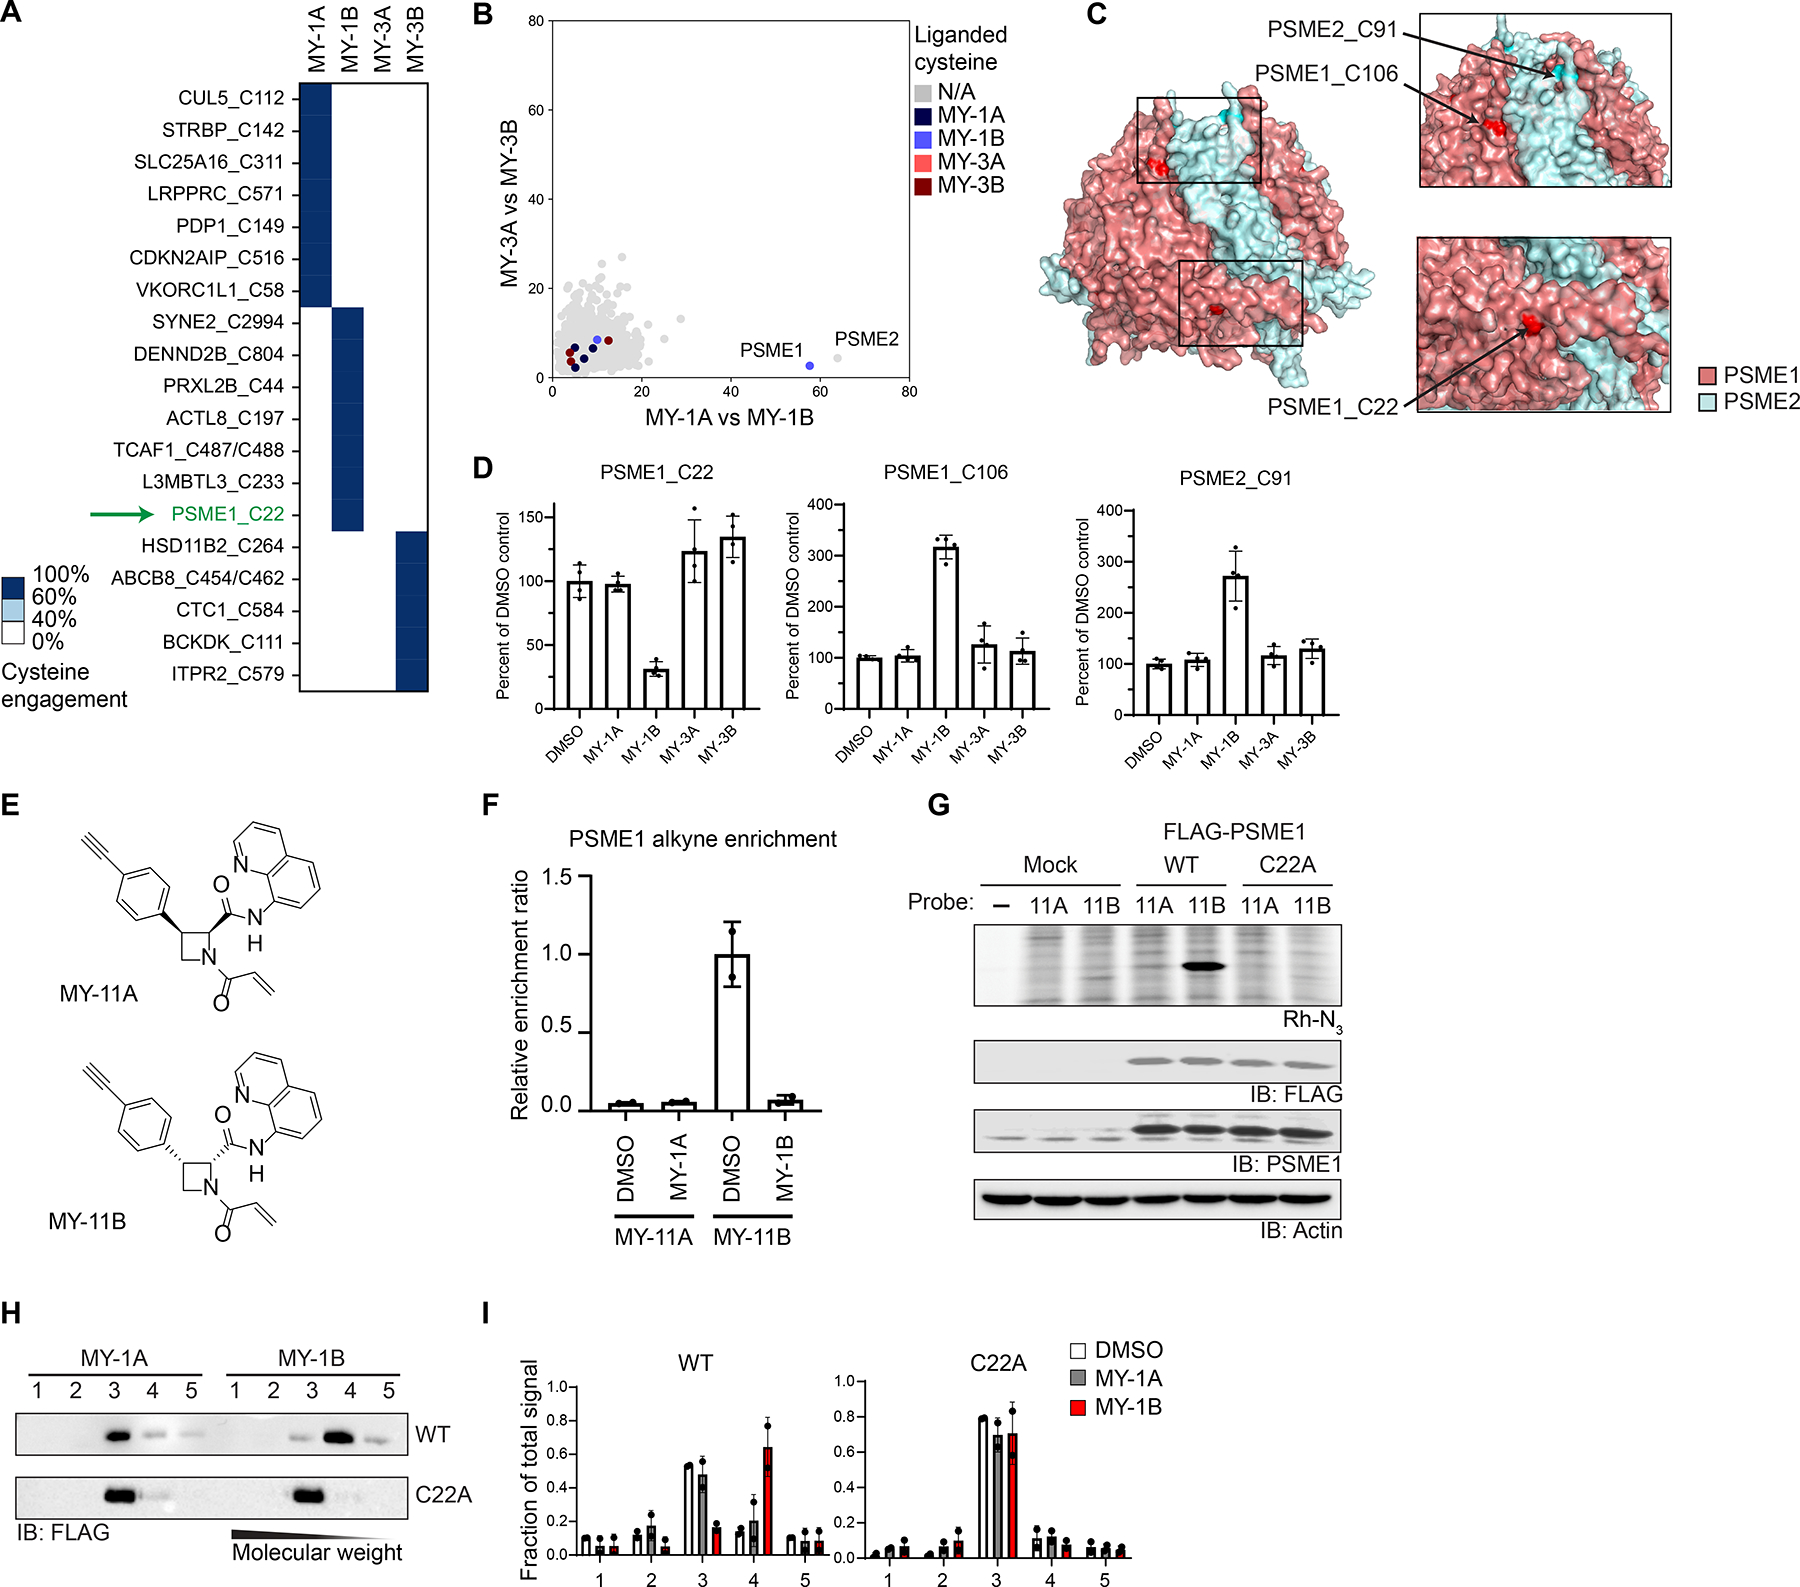
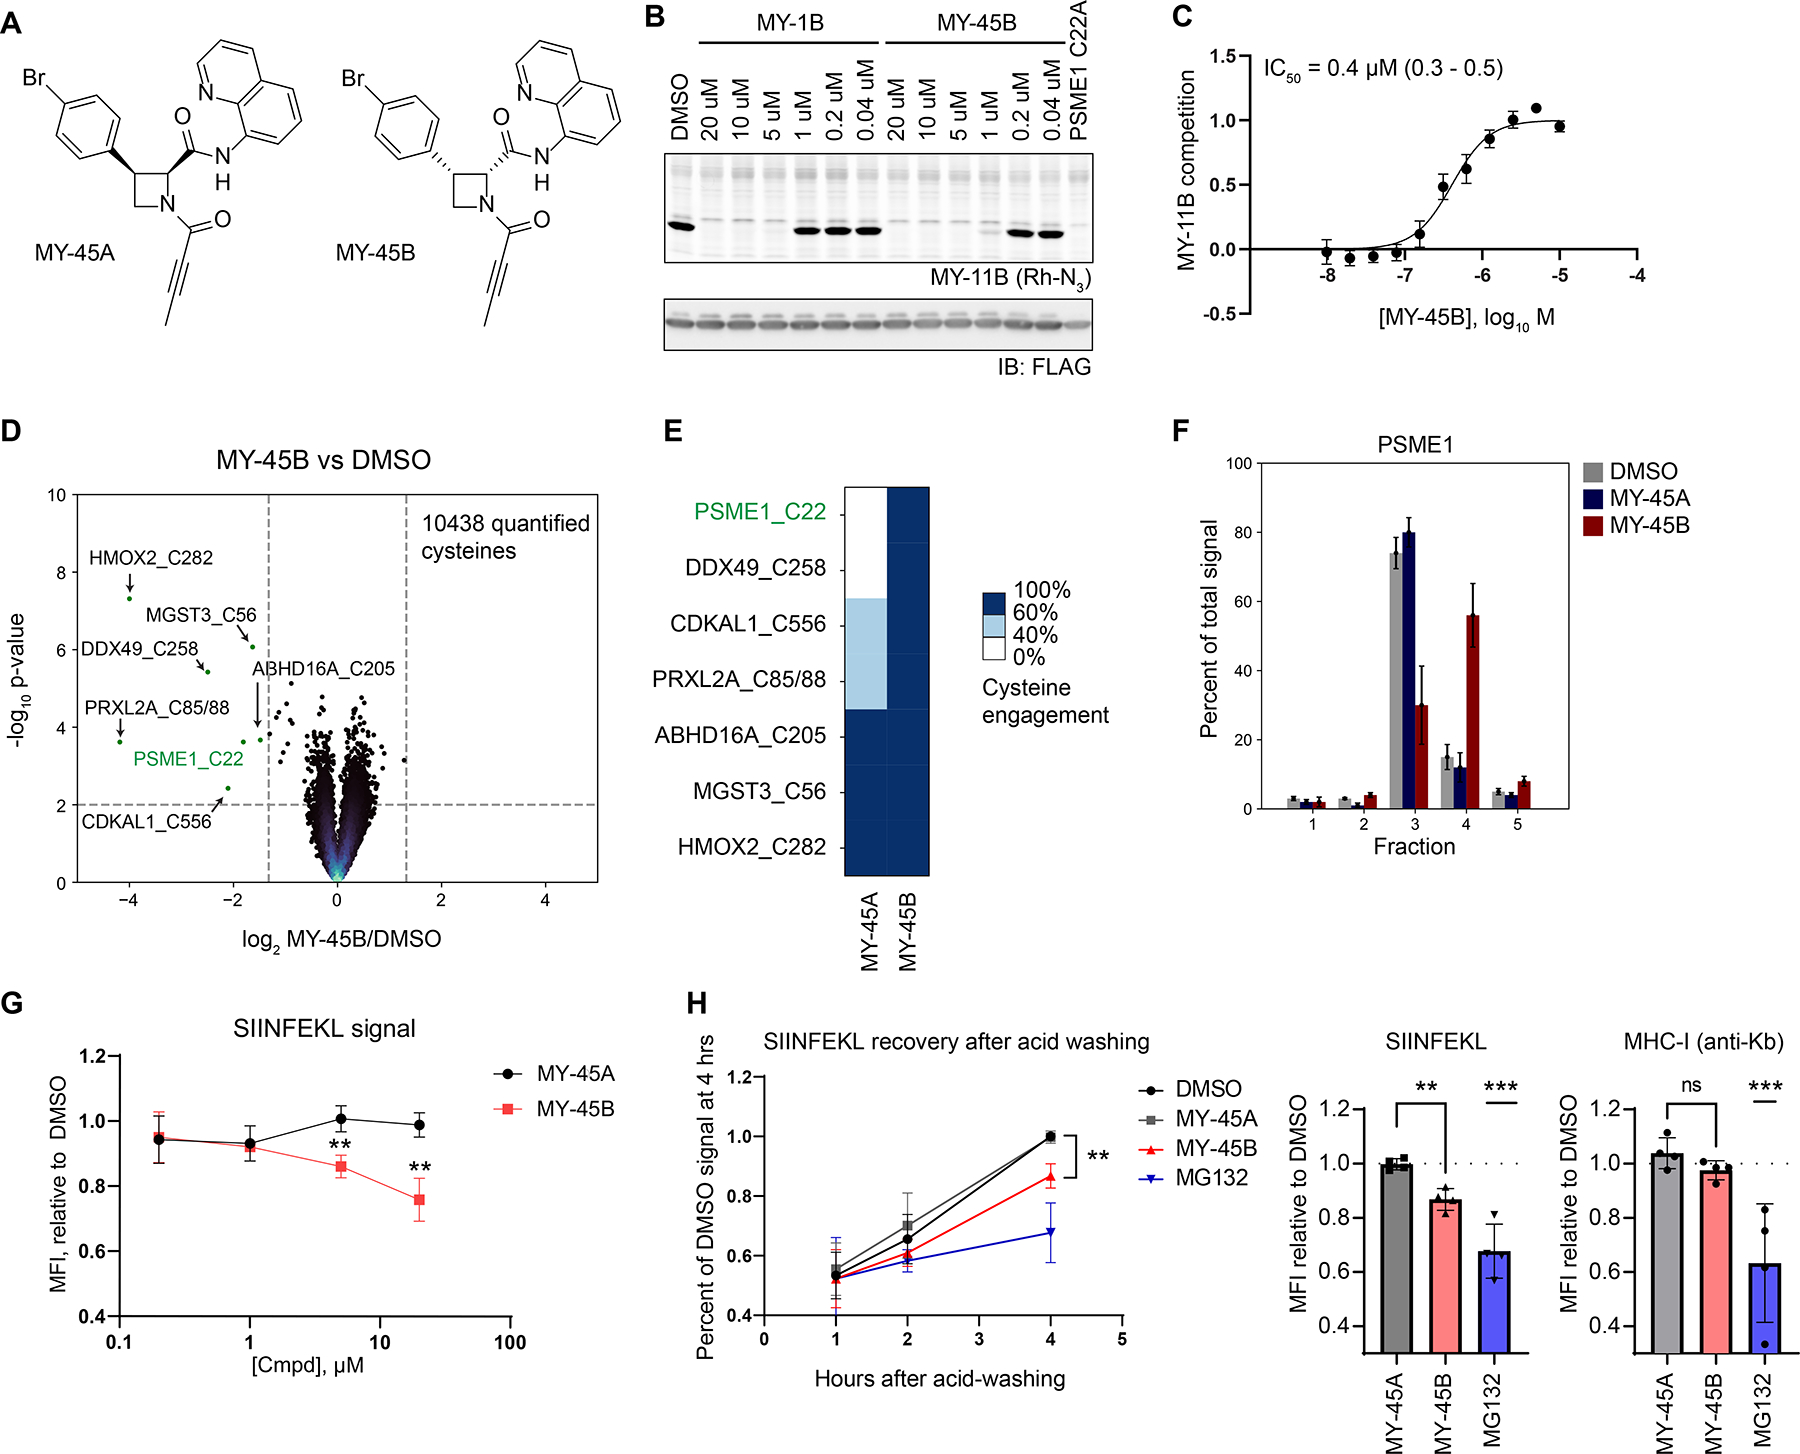
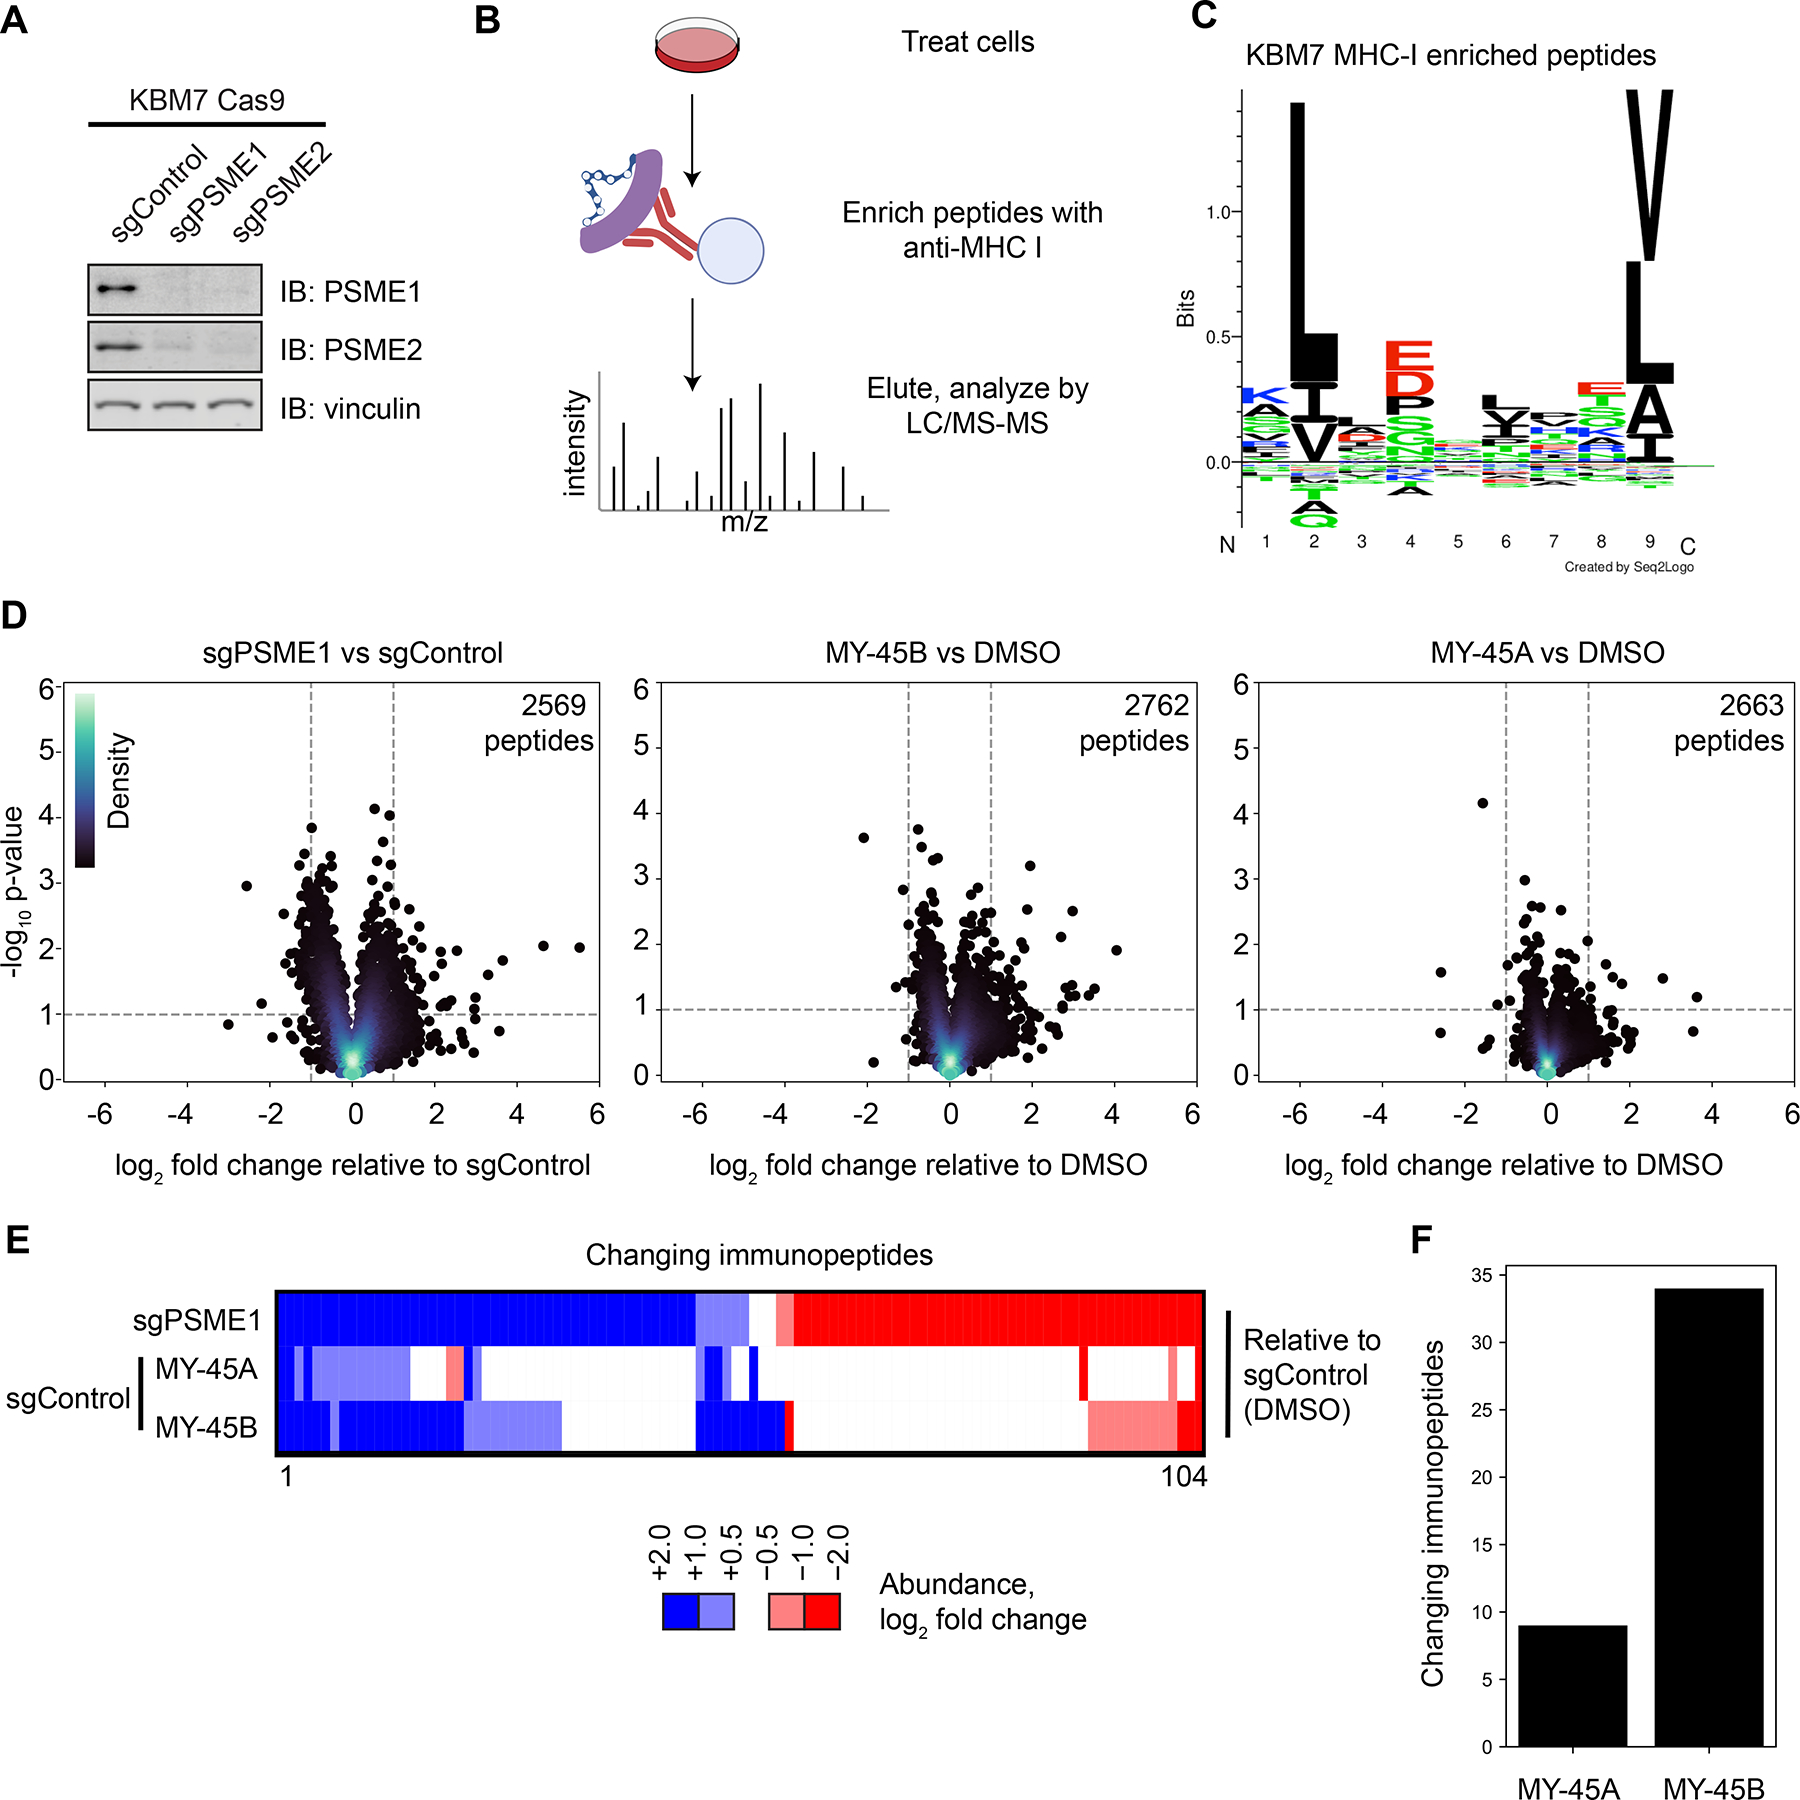
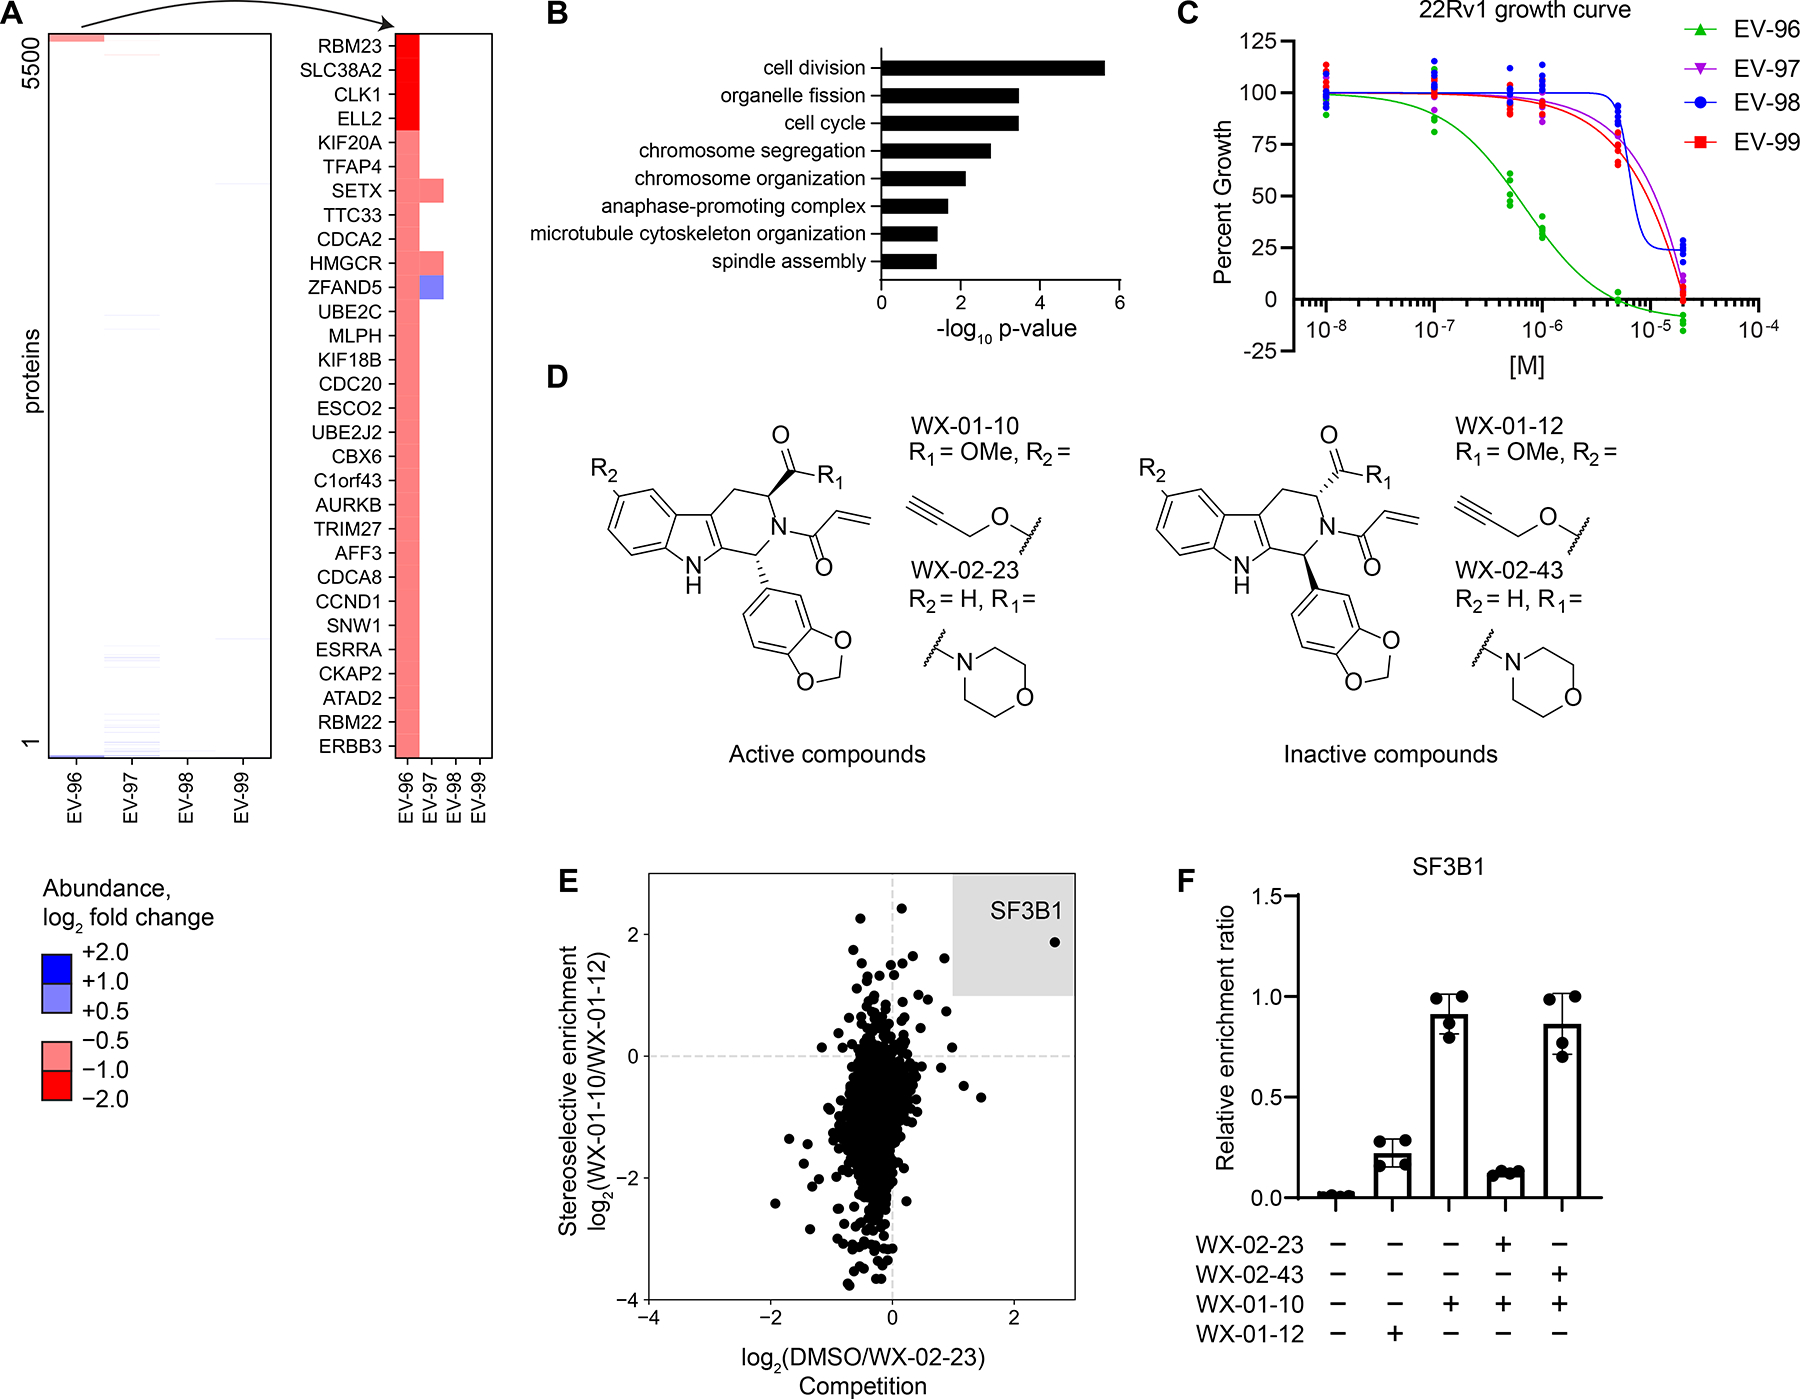
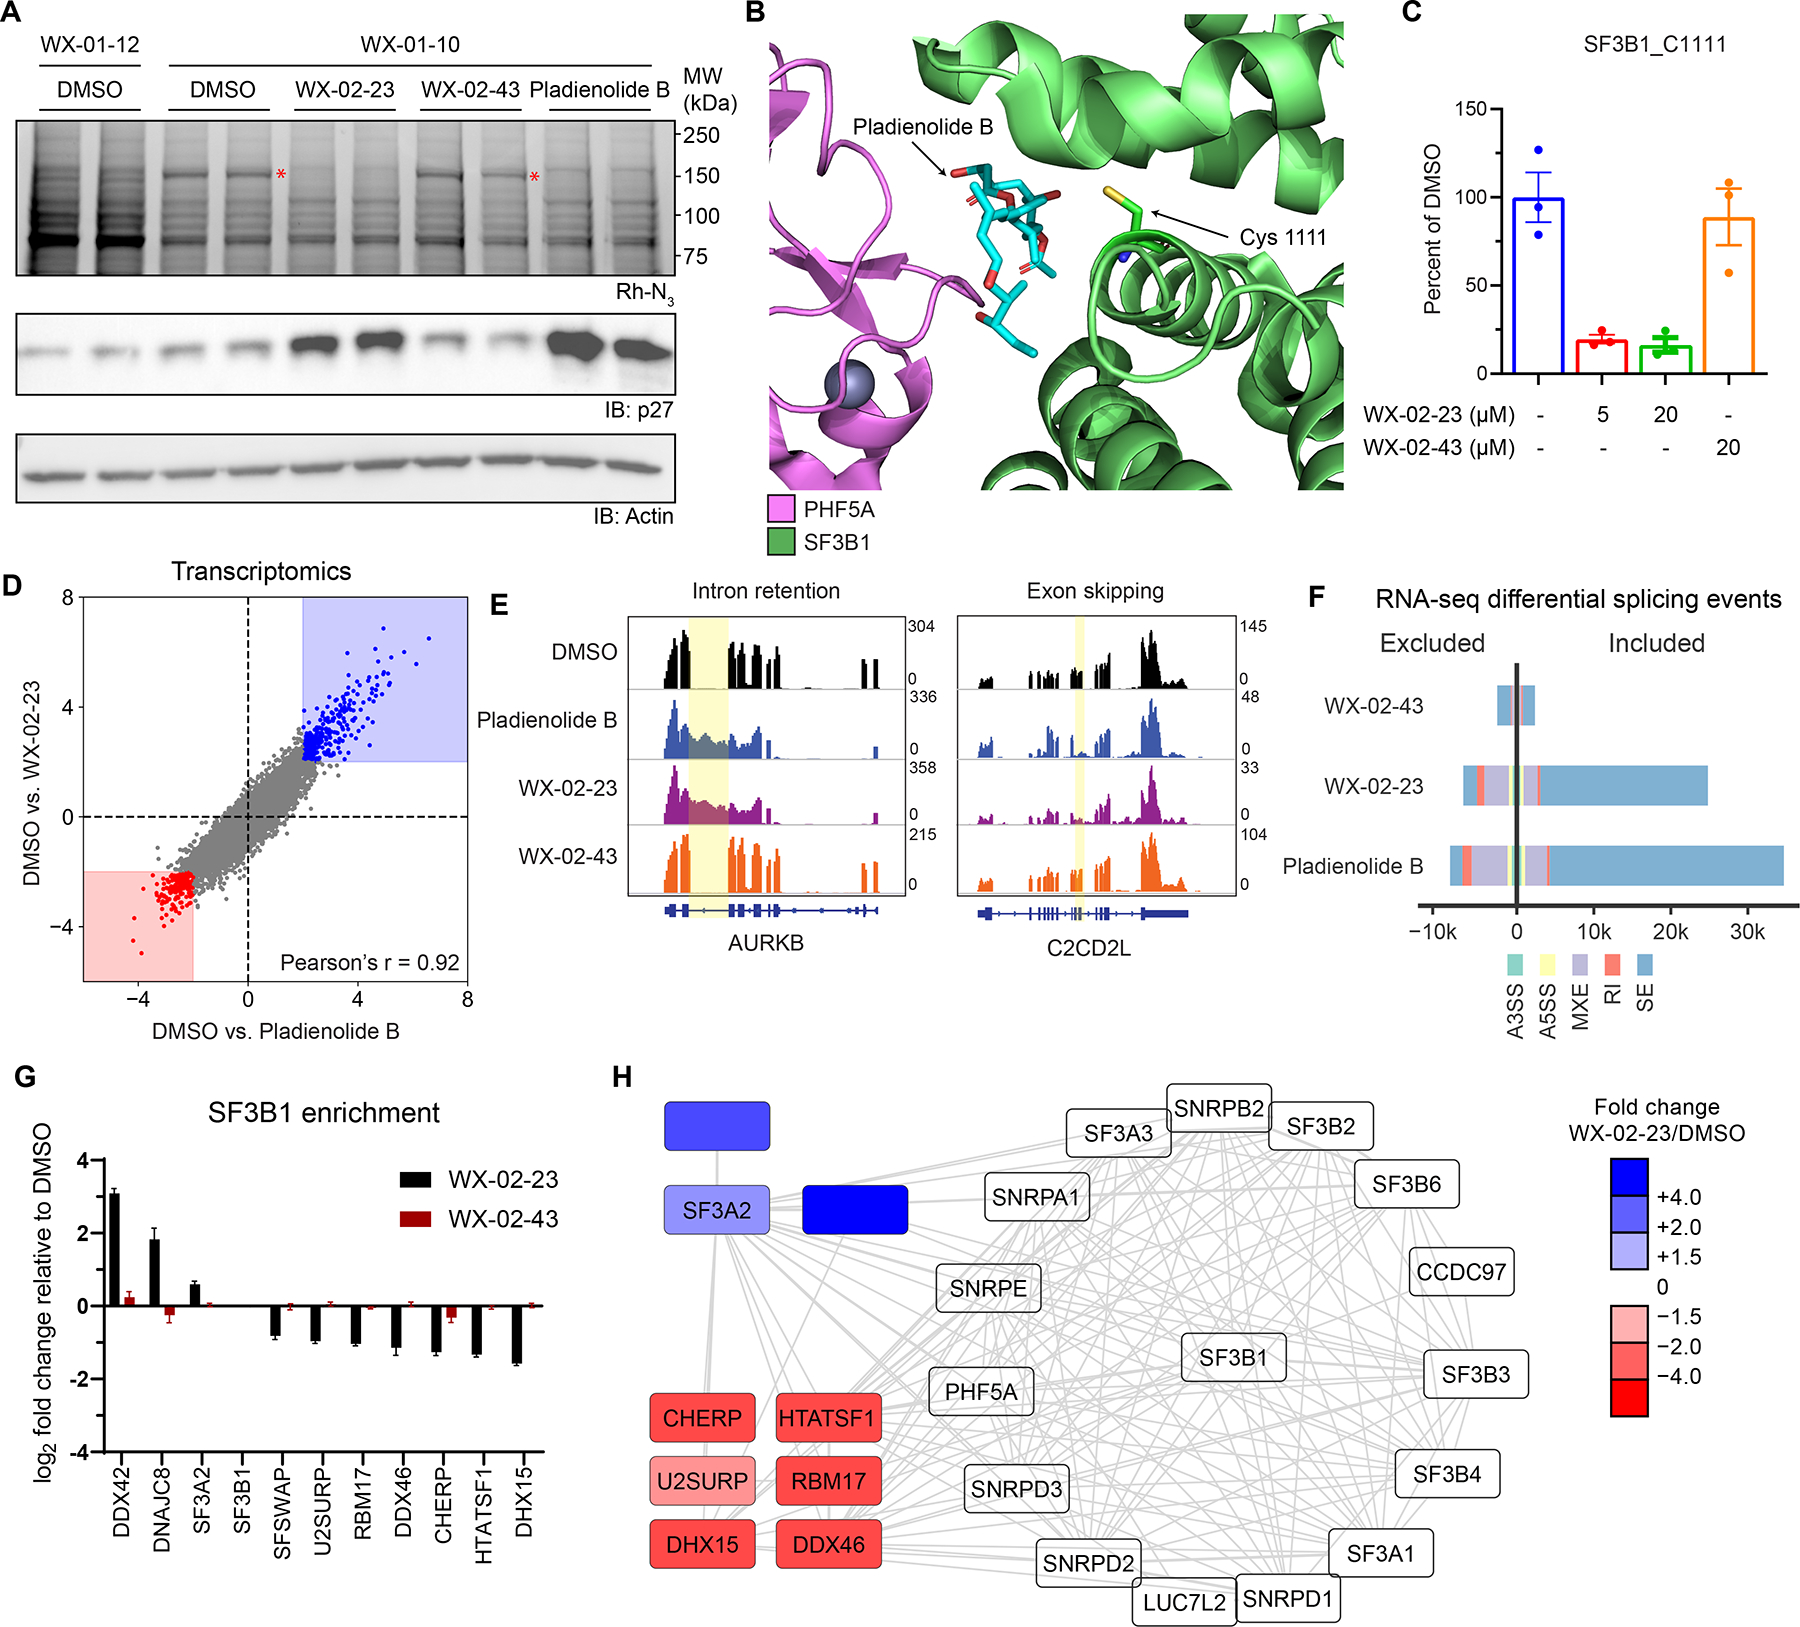
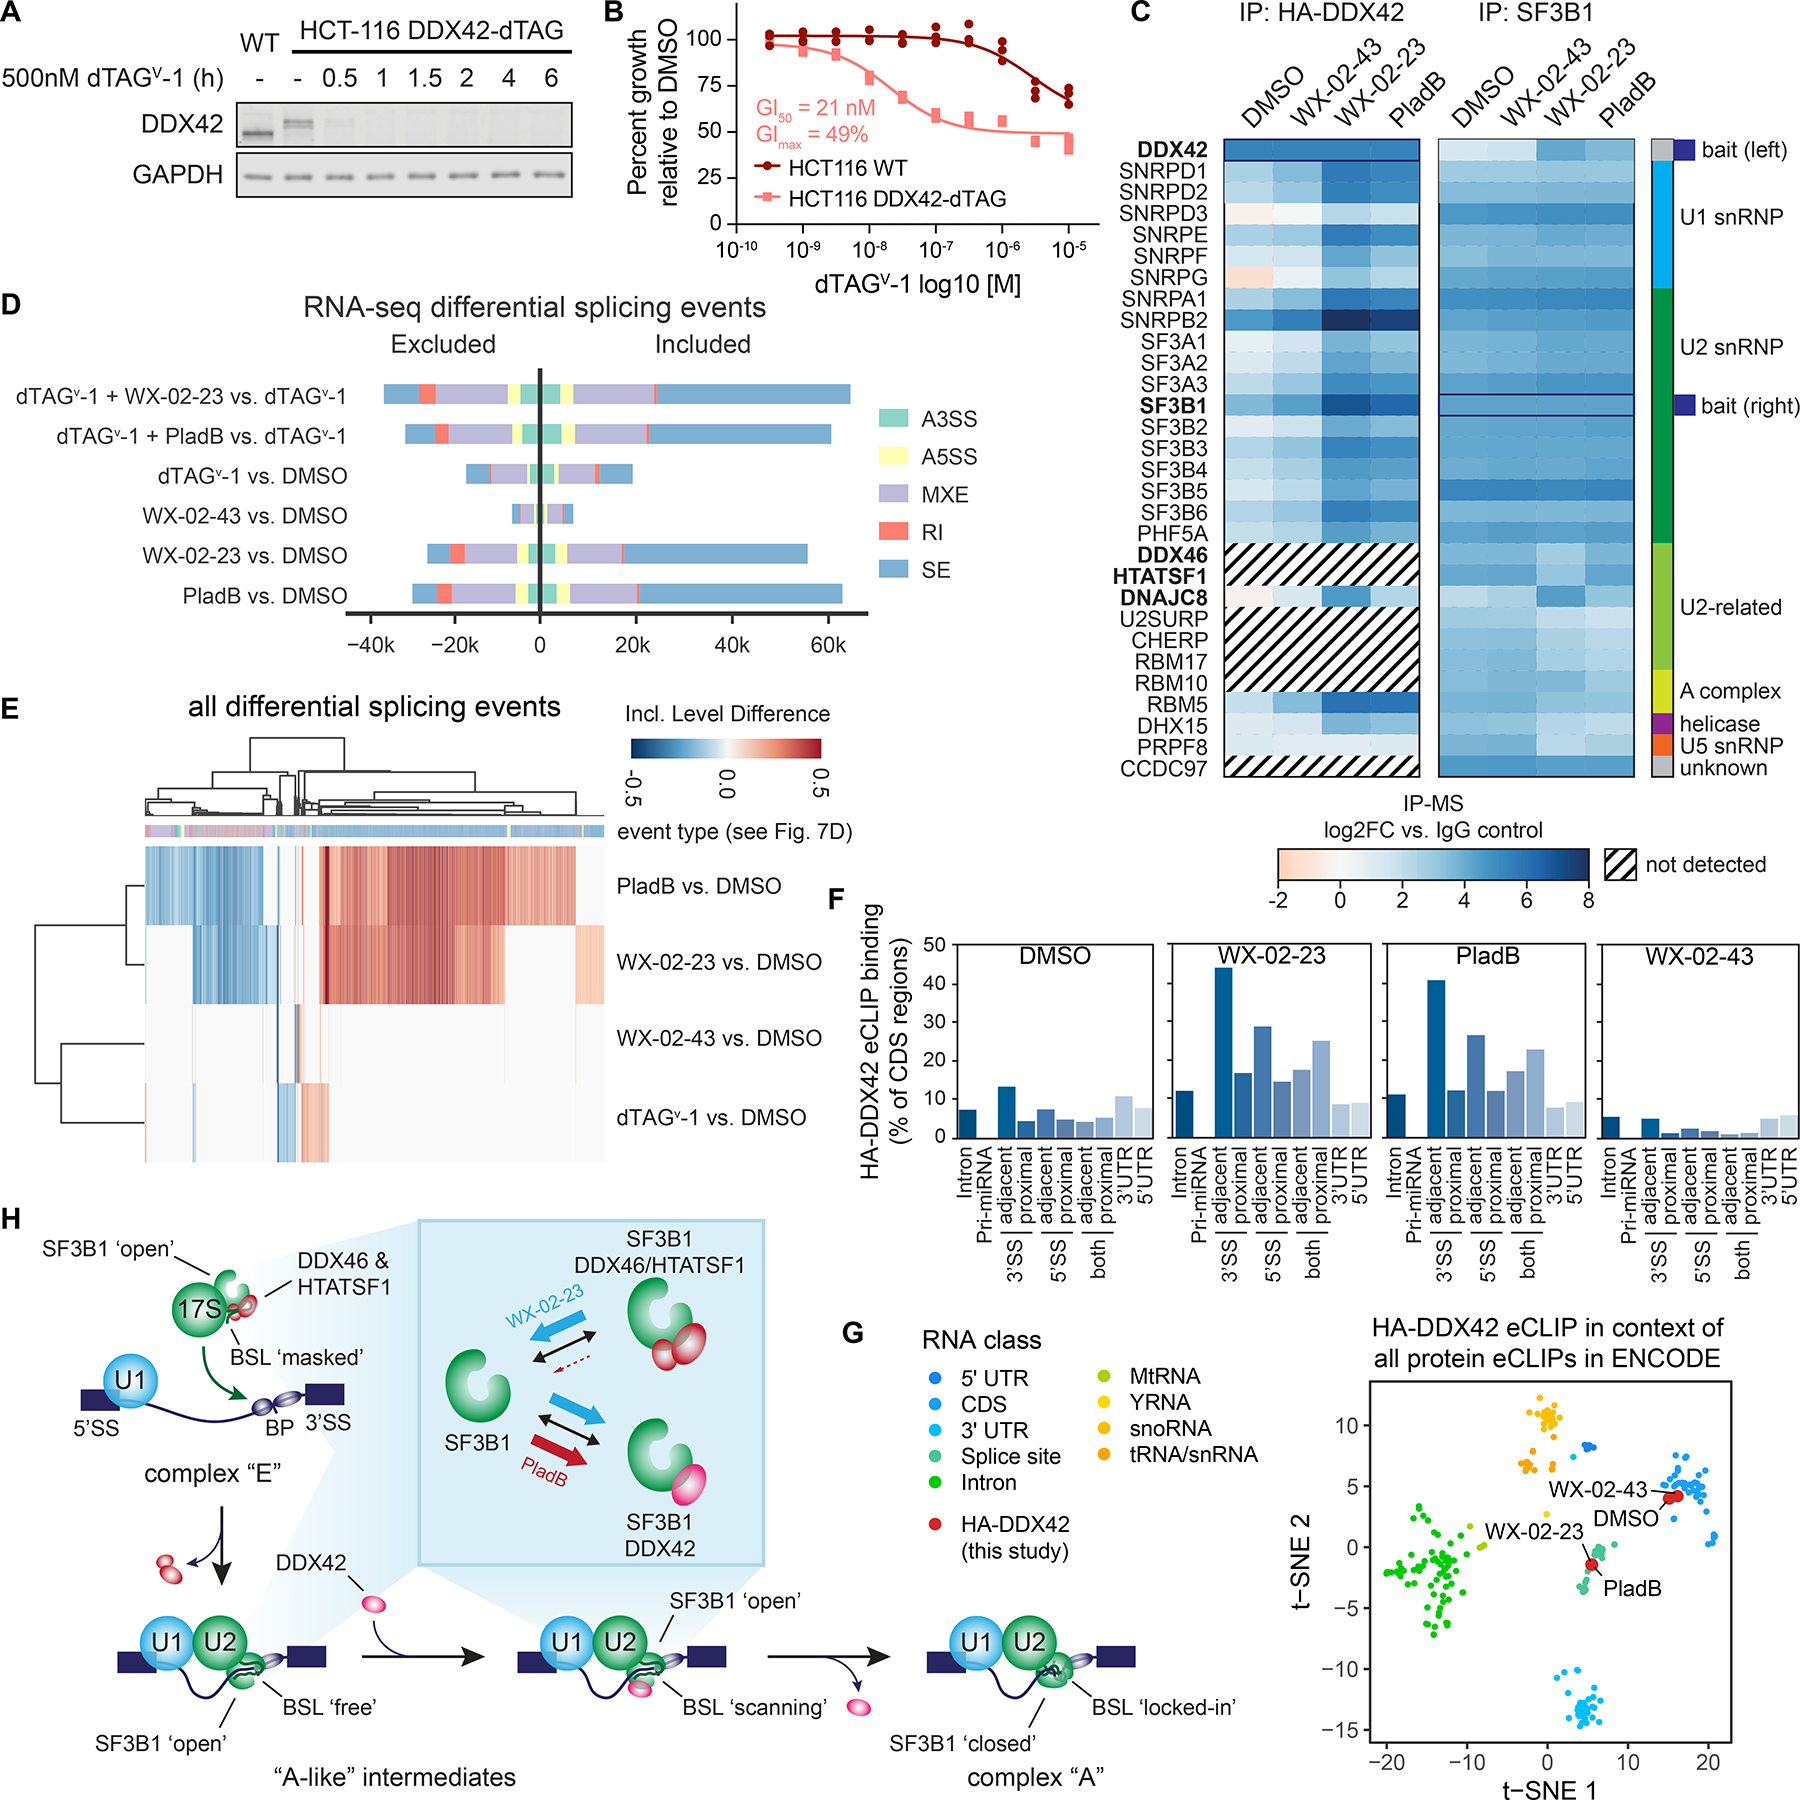
Most human proteins lack chemical probes, and several large-scale and generalizable small-molecule binding assays have been introduced to address this problem. How compounds discovered in such "binding-first" assays affect protein function, nonetheless, often remains unclear. Here, we describe a "function-first" proteomic strategy that uses size exclusion chromatography (SEC) to assess the global impact of electrophilic compounds on protein complexes in human cells. Integrating the SEC data with cysteine-directed activity-based protein profiling identifies changes in protein-protein interactions that are caused by site-specific liganding events, including the stereoselective engagement of cysteines in PSME1 and SF3B1 that disrupt the PA28 proteasome regulatory complex and stabilize a dynamic state of the spliceosome, respectively. Our findings thus show how multidimensional proteomic analysis of focused libraries of electrophilic compounds can expedite the discovery of chemical probes with site-specific functional effects on protein complexes in human cells.

Keywords: activity-based protein profiling; chemical probe; covalent; cysteine; proteasome; protein complexes; proteomics; size-exclusion chromatography; spliceosome.


Conflict of interest statement

Declaration of interests G.M.S., V.F.V., and L.R.W. are employees of Vividion Therapeutics, and B.F.C. is a founder and member of the Board of Directors of Vividion Therapeutics. G.W.Y. is a co-founder, member of the Board of Directors, on the SAB, equity holder, and paid consultant for Locanabio and Eclipse BioInnovations. G.W.Y.’s interests have been reviewed and approved by the University of California, San Diego in accordance with its conflict-of-interest policies. A US provisional patent has been filed related to the work disclosed in this manuscript.

Figures

Figure 1.
Figure 1.
A proteomic platform to discover small-molecule modulators of protein-protein interactions in human cells. A. An SEC-MS proteomic screen to determine the effects of electrophilic compounds on protein complexes in human cells (see Methods section for more details). B. Comparison of the mean elution times of proteins from SEC-MS experiments performed in this study (x-axis) versus previously (y-axis). Each dot represents a protein detected in both experiments. Data are mean elution times (weighted average) from n = 2–11 independent experiments. Support vector regression line displayed in blue. C, D. Structures for the azetidine (C) and tryptoline (D) acrylamide sets of stereoisomeric electrophilic compounds. Red lines represent enantiomers and blue lines correspond to diastereomers. E, F. Protein size shift scores (arbitrary units, a.u.) plotted for SEC-MS experiments performed with proteomes from 22Rv1 cells treated with the indicated compounds (20 μM, 3 h). X-axis represents comparison of protein size shifts caused by MY-1A and MY-1B (E) or EV-98 and EV-99 (F) (in each case, difference in SEC shifts from DMSO vs. compound, see Equation 4 in Methods). Y-axis represents comparison of protein size shifts caused by MY-3A and MY-3B (E) or EV-96 and EV-97 (F). Data are average values from n = 2–11 independent experiments. G. SEC elution profiles for PSME1 and PSME2 from 22Rv1 cells treated with azetidine acrylamides (20 μM, 3 h). Data are average values ± SEM from n = 2–11 independent experiments. H. SEC elution profile for DDX42 from 22Rv1 cells treated with tryptoline acrylamides (20 μM, 3 h). Data are average values ± SEM from n = 2–11 independent experiments.
Figure 2.
Figure 2.
Electrophilic compounds disrupt the PA28 complex by engaging C22 of PSME1. A. Heatmap showing cysteines stereoselectively liganded by azetidine acrylamides in 22Rv1 cells (20 μM compound, 1 h) as determined by cysteine-directed ABPP. Cysteines were considered stereoselectively liganded if they showed > 60% reduction in IA-DTB labeling by one stereoisomeric compound and < 40% reduction for the other three stereoisomeric compounds. Data are average values from n = 4 independent experiments. B. Graph showing size shifts of proteins in pairwise comparisons of SEC profiles for 22Rv1 cells treated with azetidine acrylamide enantiomers (MY-1A vs MY-1B, x-axis; MY-3A vs MY-3B; y-axis; reanalysis of data from Figure 1E), where proteins with stereoselectively liganded cysteines are color-coded. C. Crystal structure of PSME1 and PSME2 complex (PDB: 7DRW). D. Reactivity of cysteines in PSME1 and PSME2 quantified in cysteine-directed ABPP experiments. E. Structures of alkynylated azetidine acrylamide probes MY-11A (inactive) and MY-11B (active). F. Quantification of stereoselective enrichment of PSME1 by MY-11B (5 μM, 1 h) compared to MY-11A (5 μM, 1 h) and blockade of enrichment by MY-1A and MY-1B (20 μM, 2 h pretreatment) in Ramos cells. Data are average values ± SD normalized to MY-11B treatment group, n = 2 independent experiments. G. MY-11B, but not MY-11A (2. 5 μM 30 min), reacts with recombinantly expressed WT-PSME1, but not a C22A-PSME1 mutant expressed in HEK293T cells as determined by gel-ABPP. Top image, ABPP data (top image); bottom images, western blots. Results are from a single experiment representative of two independent experiments. H. Western blot analysis of SEC profiles for recombinant WT and C22A-PSME1 expressed in 22Rv1 cells treated with MY-1A or MY-1B (10 μM, 3 h) prior to analysis by SEC. I. Quantification of data shown in panel H. Data are average values ± SD from n = 2 independent experiments.
Figure 3.
Figure 3.
Covalent ligands targeting PSME1_C22 functionally impair MHC-I antigenic peptide presentation. A. Structures for azetidine butynamides MY-45A (inactive), and MY-45B (active). B. Comparison of potency of engagement of PSME1 by MY-1B and MY-45B (2 h, pretreatment before addition of MY-11B (2.5 μM, 30 min) as determined by gel-ABPP. Results are from a single experiment representative of two independent experiments. C. Concentration-dependent engagement of PSME1 by MY-45B as determined by gel-ABPP (see panel B). Data are average values ± SEM from n = 6 independent experiments, IC50 and 95% CI (confidence intervals) are listed. D. Volcano plot showing cysteines substantially (> 60% reduction in IA-DTB labeling) and significantly (p value < 0.01) liganded by MY-45B (5 μM, 3 h) in 22Rv1 cells as determined by cysteine-directed ABPP. Data are average values from n = 4 independent experiments. E. Heatmap displaying MY-45B-liganded cysteines (from panel D) and their reactivity with enantiomer MY-45A. F. SEC-MS elution profile for endogenous PSME1 in 22Rv1 cells treated with DMSO, MY-45A, or MY-45B (20 μM, 3 h). Data are average values ± SEM from n = 2–11 independent experiments. G. Concentration-dependent effects of MY-45B on MHC-I antigen presentation. Mouse T lymphoma cells expressing chicken ovalbumin (E.G7-Ova) were treated with DMSO or MY-45A or MY-45B for 4 h, subject to mild acid elution of MHC I-bound peptides, recovered for 4 h, and analyzed for SIINFEKL peptide presentation by FACS (MFI, mean fluorescence intensity). Data are average values ± SD from n = 3 independent experiments. **, p < 0.01 compared to MY-45A treatment. H. Time-dependent effects of MY-45B on MHC-I antigen presentation. Experiments performed as described in panel G; MG132 (10 μM). MFI for SIINFEKL peptide (left panel) and overall MHC-I (right panel, measured at 4 h post-acid wash). Data are average values ± SD from n = 4 independent experiments. **, p < 0.01, *** p < 0.001 compared to MY-45A treatment.
Figure 4.
Figure 4.
Chemical or genetic perturbation of PSME1 modulates MHC-I-immunopeptide interactions in human leukemia cells. A. Western blots of PSME1 and PSME2 in KBM7 CRISPR/Cas9 control (sgAAVS1), PSME1 (sgPSME1), or PSME2 (sgPSME2) cell lines. Results are from a single experiment representative of two independent experiments. B. Cartoon schematic for anti-MHC class I immunopeptidomics protocol. After compound treatment, cells are lysed, and MHC-I bound peptides immunoprecipitated with anti-MHC-I antibody, eluted, and analyzed by LC-MS. C. Motif analysis of peptides enriched by MHC-I co-immunoprecipitation from KBM7 cells. D. Volcano plots showing substantially (> two-fold increase or decrease) and significantly (p value < 0.05) changing MHC-I bound immunopeptides in sgPSME1 vs sgControl (sgAAVS1) cells (left), DMSO- vs MY-45B-treated sgControl cells (middle), or DMSO- vs MY-45A-treated sgControl cells (right) (10 μM compound, 8 h). Data are average values from n= 3–4 independent experiments. E. Heatmap of MHC-I-bound immunopeptides that are substantially and significantly changing in at least one comparison group (sgPSME1 vs sgControl; MY-45A- vs DMSO-treated sgControl; or MY-45B- vs DMSO-treated sgControl) as defined in panel D. F. Bar graph showing the number of MHC-I-bound immunopeptides that are substantially and significantly changing in MY-45A- vs DMSO-treated sgControl or MY-45B- vs DMSO-treated sgControl cells as defined in panel D.
Figure 5.
Figure 5.
Tryptoline acrylamides that stereoselectively engage SF3B1 alter protein abundances and block the proliferation of cancer cells. A. Left panel, Heatmap of protein abundance changes in 22Rv1 cells treated with tryptoline acrylamides (20μM, 8 h). Right panel, Blow up of heatmap showing proteins with > 33% decreases in abundance in 22Rv1 cells treated with EV-96. Data are average values from n = 4–6 independent experiments. B. Gene ontology enrichment for proteins stereoselectively decreased in abundance by EV-96 (panel A). C. Cell growth effects of tryptoline acrylamides. Cells were treated with compounds for 72 h prior to CellTiter-Glo measurement. Data are relative to DMSO control from n = 6 independent experiments. D. Structures of alkyne (WX-01-10 and WX-01-12) and morpholino amide (WX-02-23 and WX-02-43) analogues of EV-96 and EV-97. E. Chemical proteomic identification of SF3B1 as a protein that is stereoselectively enriched by WX-01-10 and stereoselectively competed in enrichment by WX-02-23. X-axis: log2 competition ratio values for proteins enriched by alkyne probe WX-01-10 (10 μM, 1 h) in 22Rv1 cells pretreated with DMSO or WX-02-23 (5 μM, 2 h pretreatment) as a competitor. Y-axis: log2 enrichment ratio values for proteins treated with active alkyne probe WX-01-10 vs inactive probe WX-01-12 (10 μM, 1 h). Data are average values from n = 4 independent experiments (See also Figure S4I for schematic of this experiment). F. Quantification of stereoselective enrichment and competition of SF3B1 by active alkyne probe (WX-01-10) and competitor (WX-02-23) vs inactive enantiomer alkyne probe (WX-01-12) and inactive enantiomer competitor (WX-02-43). Data are average values ± SD normalized to WX-01-10 treatment group for n = 4 independent experiments.
Figure 6.
Figure 6.
Tryptoline acrylamides engage C1111 of SF3B1 and stereoselectively modulate spliceosome structure and function. A. Stereoselective labeling of a 150 kDa protein (red asterisk) in 22Rv1 cells as determined by gel-ABPP. Top panel, Gel-ABPP, where cells were pre-treated with DMSO, WX-02-23 (1 μM), WX-02-43 (1 μM) or pladienolide B (10 nM) for 24 h followed by treatment with WX-01-10 or WX-01-12 (1 μM, 1 h). Lower panels, western blots. Results are from a single experiment representative of two independent experiments. B. Crystal structure of SF3B1-PHF5A complex bound to pladienolide B, highlighting the location of C1111 (PDB: 6EN4). C. Quantification of stereoselective engagement of SF3B1_C1111 by WX-02-23 as measured by targeted cysteine-directed ABPP of 22Rv1 cells treated with 5 or 20 μM compound (3 h). Data are average values ± SD from n = 2–3 independent experiments. D. Scatter plot of mRNA abundance changes in 22Rv1 cells treated with WX-02-23 (5 μM), pladienolide B (10 nM), or DMSO for 8 h. RNA-seq data are average values shown as log2 fold change relative to DMSO for n = 3 independent experiments. E. Examples of intron retention in AURKB and exon skipping in C2CD2L caused by pladienolide B and WX-02-23 in 22Rv1 cells. F. Summary of alternative splicing events caused by pladienolide B (10 nM), WX-02-23 (5 μM), and inactive enantiomer WX-02-43 (5 μM) in 22Rv1 cells (8 h) compared to DMSO treatment, as identified with rMATS by threshold of |PSI| > 0.1 and FDR < 0.05. Data represent values from three independent experiments. G. Differential co-immunoprecipitation of proteins with SF3B1 (> 1.5 fold increase or decrease) in HEK293T cells treated with DMSO, WX-02-23, or WX-02-43 (5 μM, 3 h). Co-immunoprecipitated performed with anti-SF3B1 antibody (CST #14434). Data are average log2 fold changes ± SD from n = 4–7 independent experiments. See Dataset S1 for co-immunoprecipitation data from cells treated with pladienolide B (10 nM, 3 h). H. Interactome map from STRING database filtered for proteins identified as SF3B1 interactors in the co-immunoprecipitation experiments from panel I. Data are average log2 fold changes from n = 4-7 independent experiments.
Figure 7.
Figure 7.
DDX42 facilitates spliceosome branch point selection. A. Western blot analysis of dTAGv-1 ligand-induced DDX42 degradation in DDX42-dTAG HCT-116 cells. B. Cell growth curves for DDX42-dTAG or wild-type HCT-116 cells treated with dTAGv-1 for 72 h. Data are from n = 3 independent experiments. C. Heatmap showing proteins enriched in HA-DDX42 (left) or SF3B1 (right) immunoprecipitation-MS experiments in DDX42-dTAG HCT-116 cells treated with WX-02-23 (5 μM), WX-02-43 (5 μM), pladienolide B (PladB, 10 nM), or DMSO for 3 h. Proteins were included if they were either enriched in DMSO vs. IgG (log2FC >1 for HA, >2 for SF3B1) or in WX-02-23 vs. DMSO (log2FC >2). Results are average values from 2–4 independent experiments. Interacting proteins were input into the StringDB database and the largest connected component of 30 proteins form the basis of the heatmap. Data were normalized to corresponding bait and are shown as log2 fold-enrichment vs. IgG control. Diagonal black lines indicate proteins that were not detected in HA-DDX42 IP-MS experiments. Bold type mark proteins substantially affected in interactions with SF3B1 by WX-02-23 and/or pladienolide B. D. Alternative splicing events triggered by indicated combinations of DDX42 degradation +/− treatment with pladienolide B (PladB, 10 nM), WX-02-23 (5 μM) or WX-02-43 (5 μM) in DDX42-dTAG HCT-116 cells. Cells were pre-treated for 1 h with either 500 nM dTAGv-1 or DMSO, followed by addition of either DMSO or compounds for 8 h. Splicing changes were identified with rMATS threshold of |PSI| > 0.1 and FDR < 0.05. Data represent values from three independent experiments. E. Clustered heatmap of inclusion level differences between indicated compound treatments and DMSO control for alternative splicing events from panel D. Columns are annotated by the type of alternative splicing event in the color scheme of panel D. Data represent values from three independent experiments. F. DDX42 RNA-binding profiles in DMSO- vs compound-treated DDX42-dTAG HCT-116 cells measured by eCLIP-seq using the HA-tag of the dTAG fusion. DDX42-dTAG HCT-116 cells were treated with WX-02-23 (5 μM), WX-02-43 (5 μM), or Pladienolide B (100 nM) for 3 h. Data are average values from two independent experiments. eCLIP enriched windows (FDR<0.2) w are depicted as percent binding relative to coding sequence (CDS). Proximal denotes within 500 bases and adjacent denotes within 100 bases from the annotated splice site (SS). G. tSNE of HA-DDX42 eCLIP samples in the context of all available eCLIP datasets that were generated by the ENCODE consortium. DDX42-dTAG HCT-116 cells were treated with WX-02-23 (5 μM), WX-02-43 (5 μM), or Pladienolide B (100 nM) for 3 h. Data are average values from n = 2 independent experiments. H. Proposed model for function of DDX42 in facilitating the branch point selection step of spliceosome function. Inset summarizes differential SF3B1 complexation effects caused by synthetic, covalent (WX-02-23) vs natural product, reversible (pladienolide B) SF3B1 ligands.

Comment in

References

    1. Schreiber SL (2019). A Chemical Biology View of Bioactive Small Molecules and a Binder-Based Approach to Connect Biology to Precision Medicines. Israel Journal of Chemistry 59, 52–59. 10.1002/ijch.201800113. - DOI - PMC - PubMed
    1. Lu W, Kostic M, Zhang T, Che J, Patricelli MP, Jones LH, Chouchani ET, and Gray NS (2021). Fragment-based covalent ligand discovery. RSC Chem Biol 2, 354–367. 10.1039/d0cb00222d. - DOI - PMC - PubMed
    1. Scott DE, Coyne AG, Hudson SA, and Abell C (2012). Fragment-based approaches in drug discovery and chemical biology. Biochemistry 51, 4990–5003. 10.1021/bi3005126. - DOI - PubMed
    1. Brenner S, and Lerner RA (1992). Encoded combinatorial chemistry. Proc Natl Acad Sci U S A 89, 5381–5383. 10.1073/pnas.89.12.5381. - DOI - PMC - PubMed
    1. Gironda-Martinez A, Donckele EJ, Samain F, and Neri D (2021). DNA-Encoded Chemical Libraries: A Comprehensive Review with Succesful Stories and Future Challenges. ACS Pharmacol Transl Sci 4, 1265–1279. 10.1021/acsptsci.1c00118. - DOI - PMC - PubMed

Publication types

LinkOut - more resources