. 2023 May 2;35(5):855-874.e5.
doi: 10.1016/j.cmet.2023.03.022. Epub 2023 Apr 20.

Very-long-chain fatty acids induce glial-derived sphingosine-1-phosphate synthesis, secretion, and neuroinflammation

Affiliations

Very-long-chain fatty acids induce glial-derived sphingosine-1-phosphate synthesis, secretion, and neuroinflammation

Hyung-Lok Chung et al. Cell Metab. .

Abstract

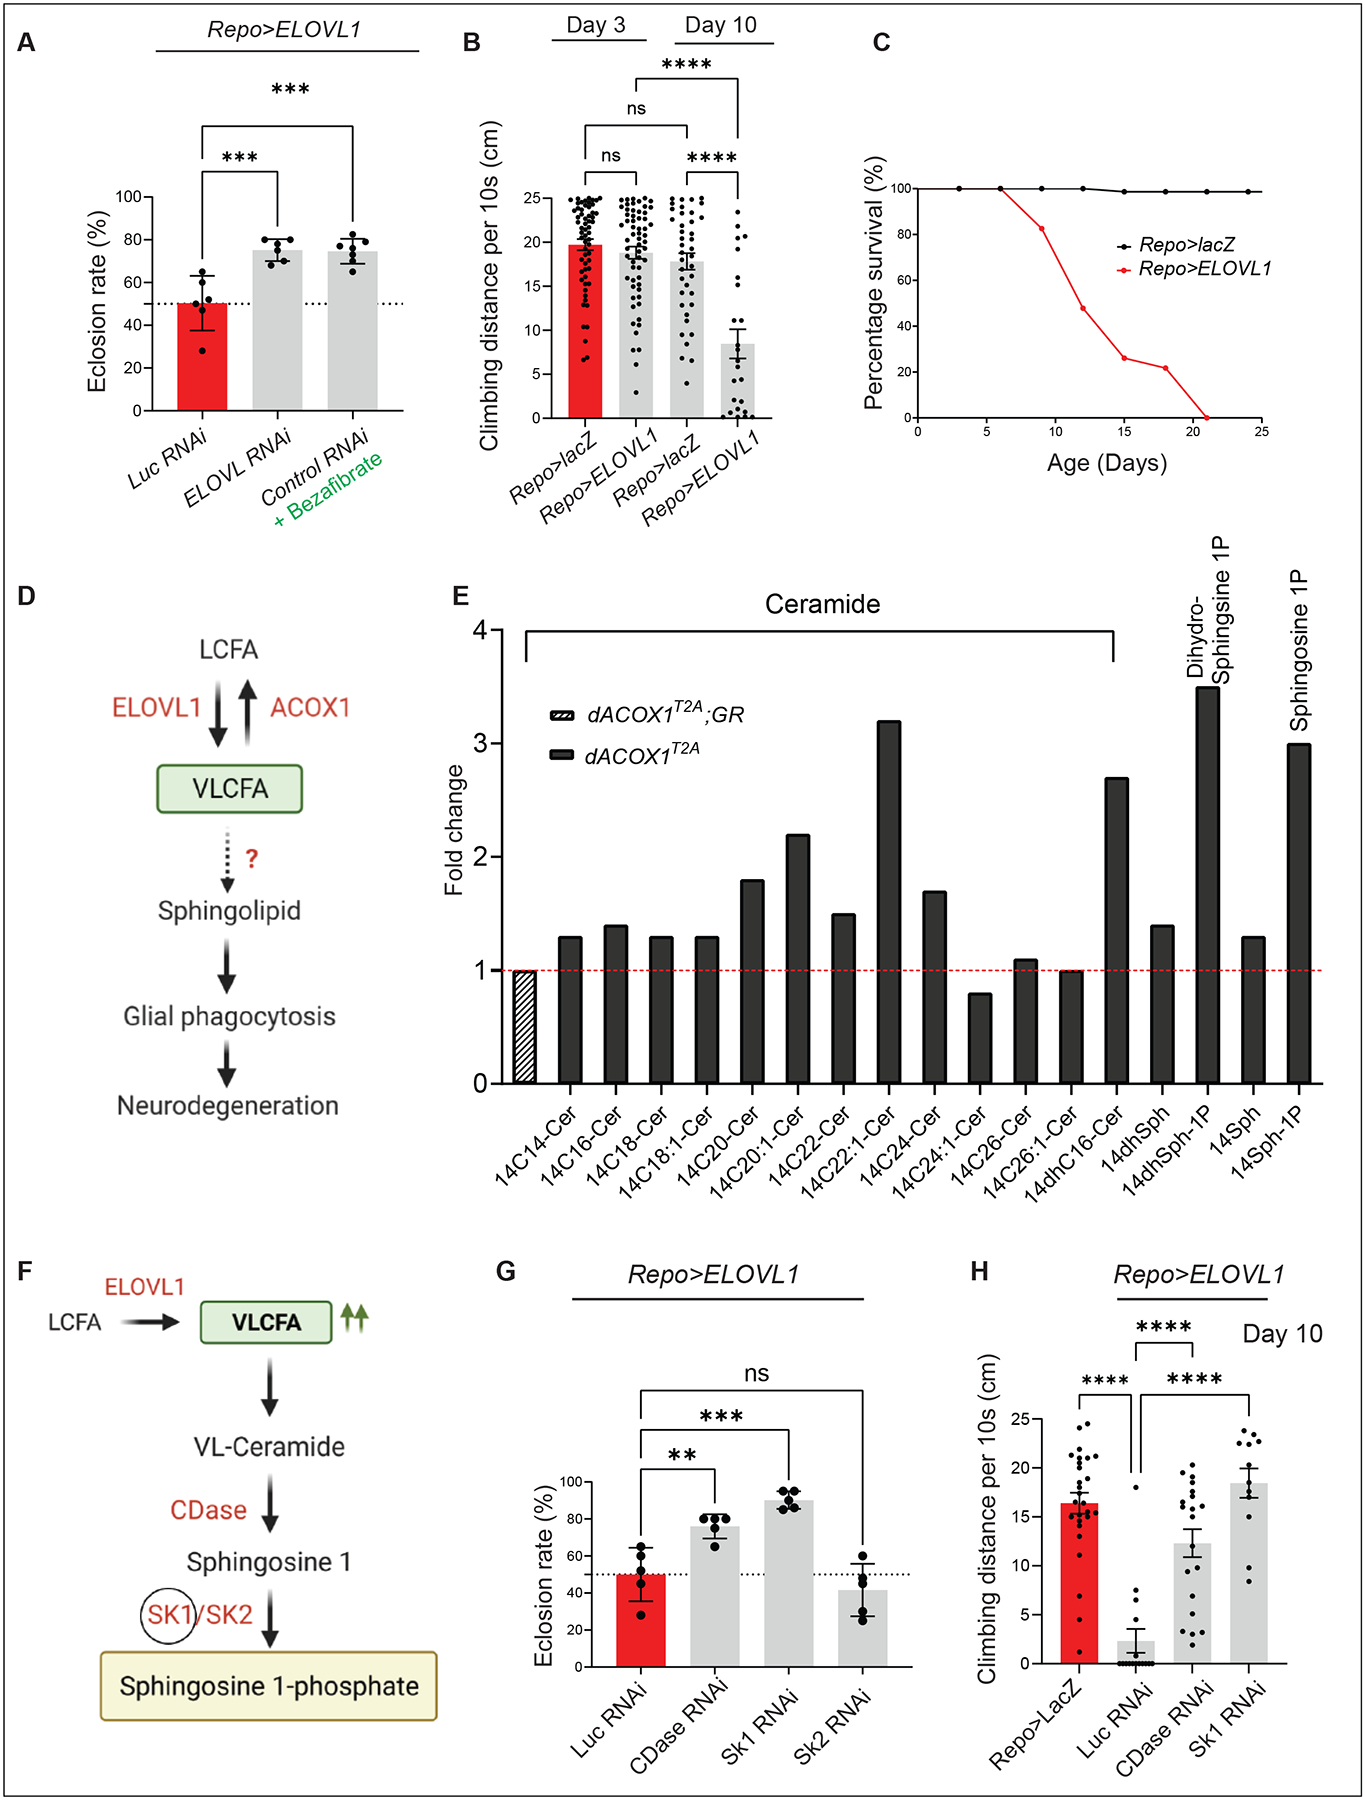
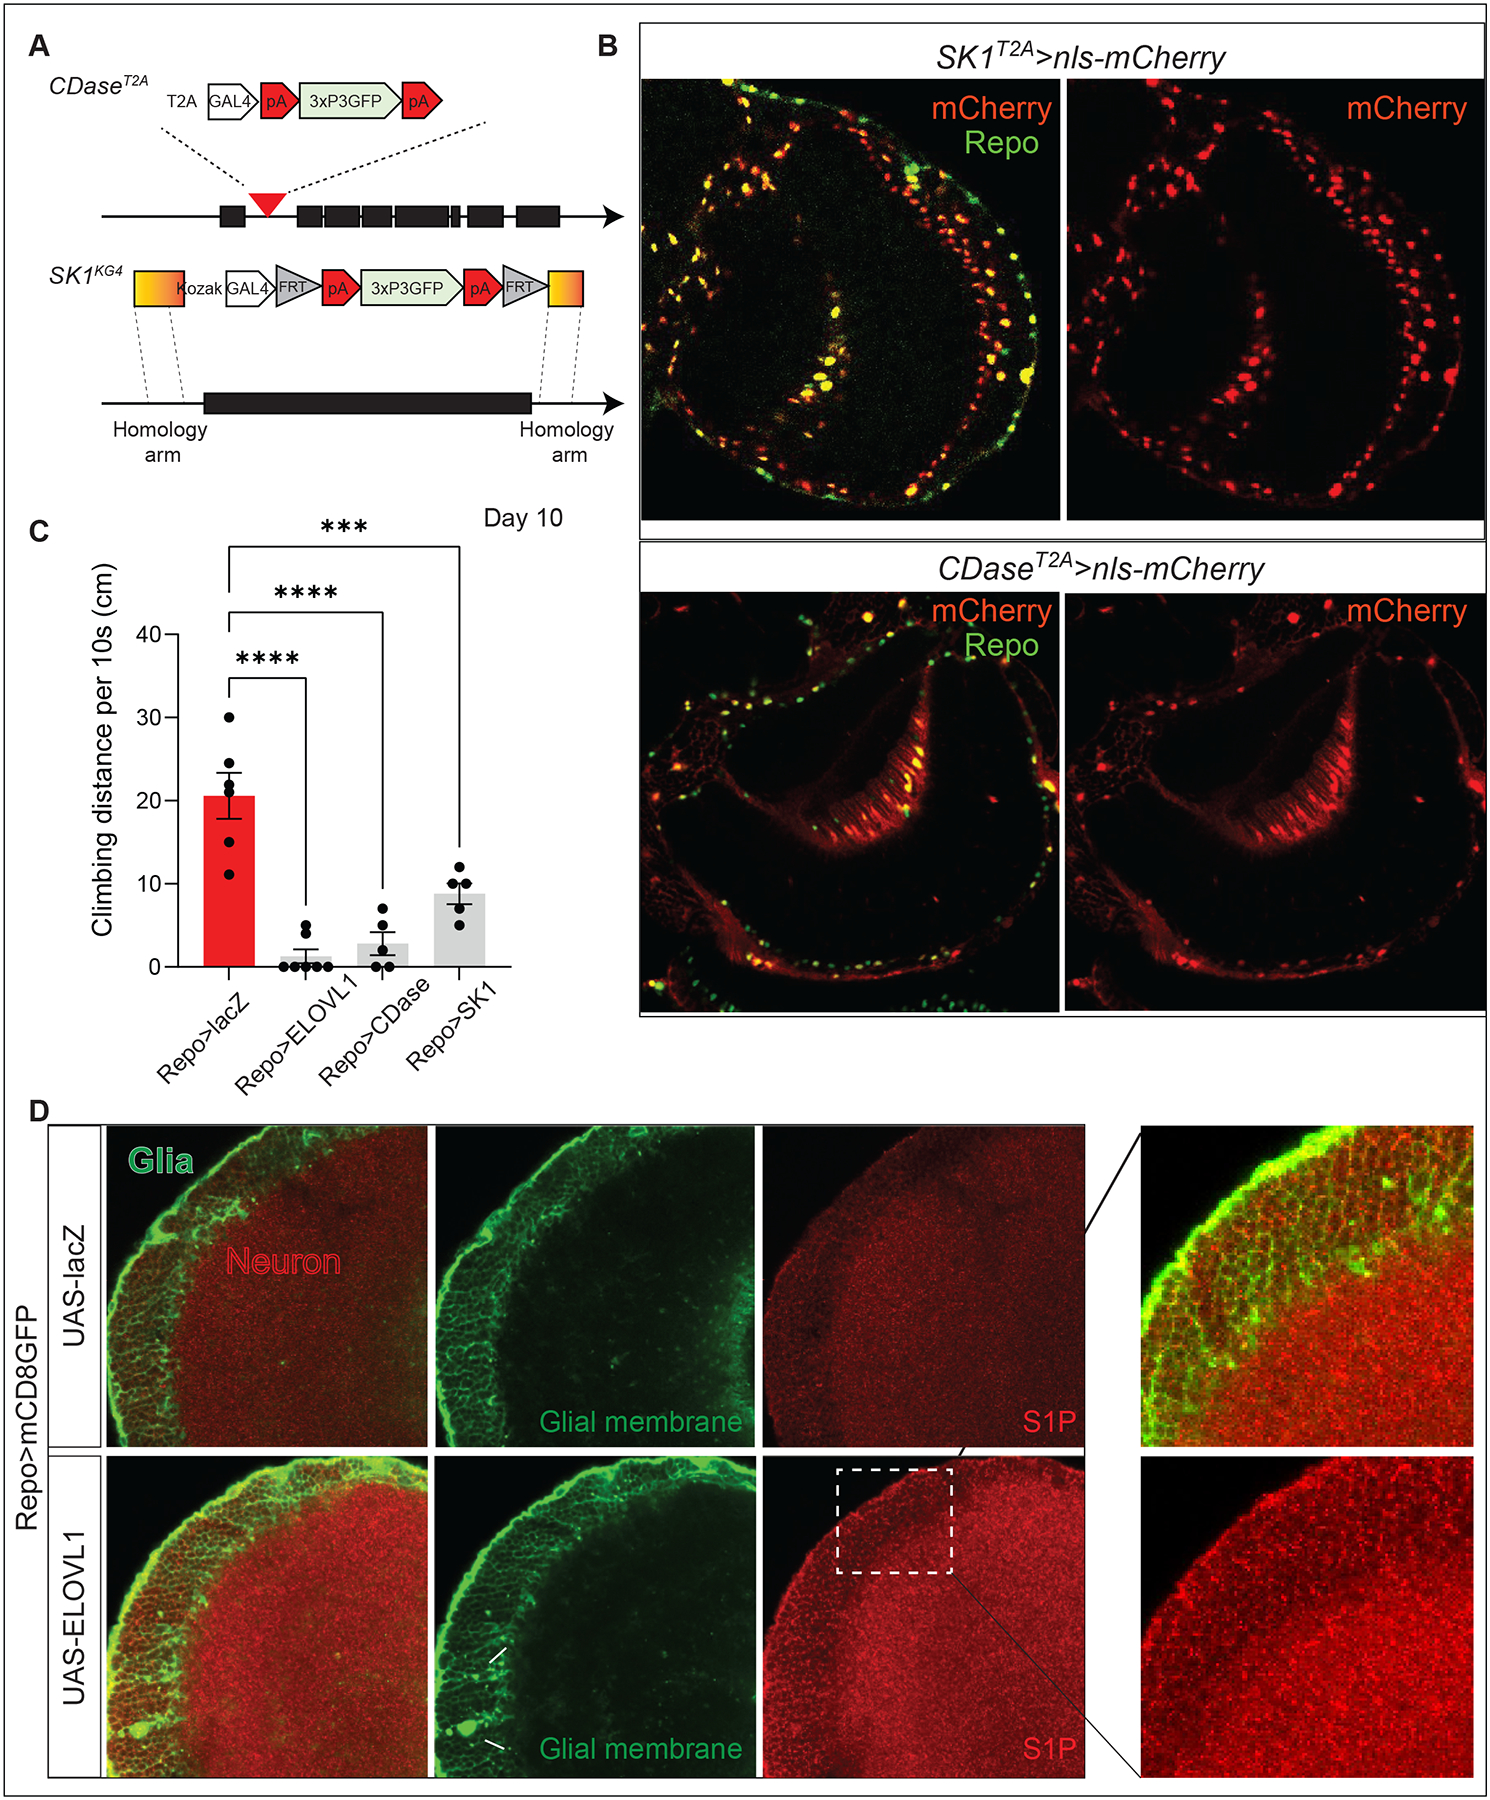
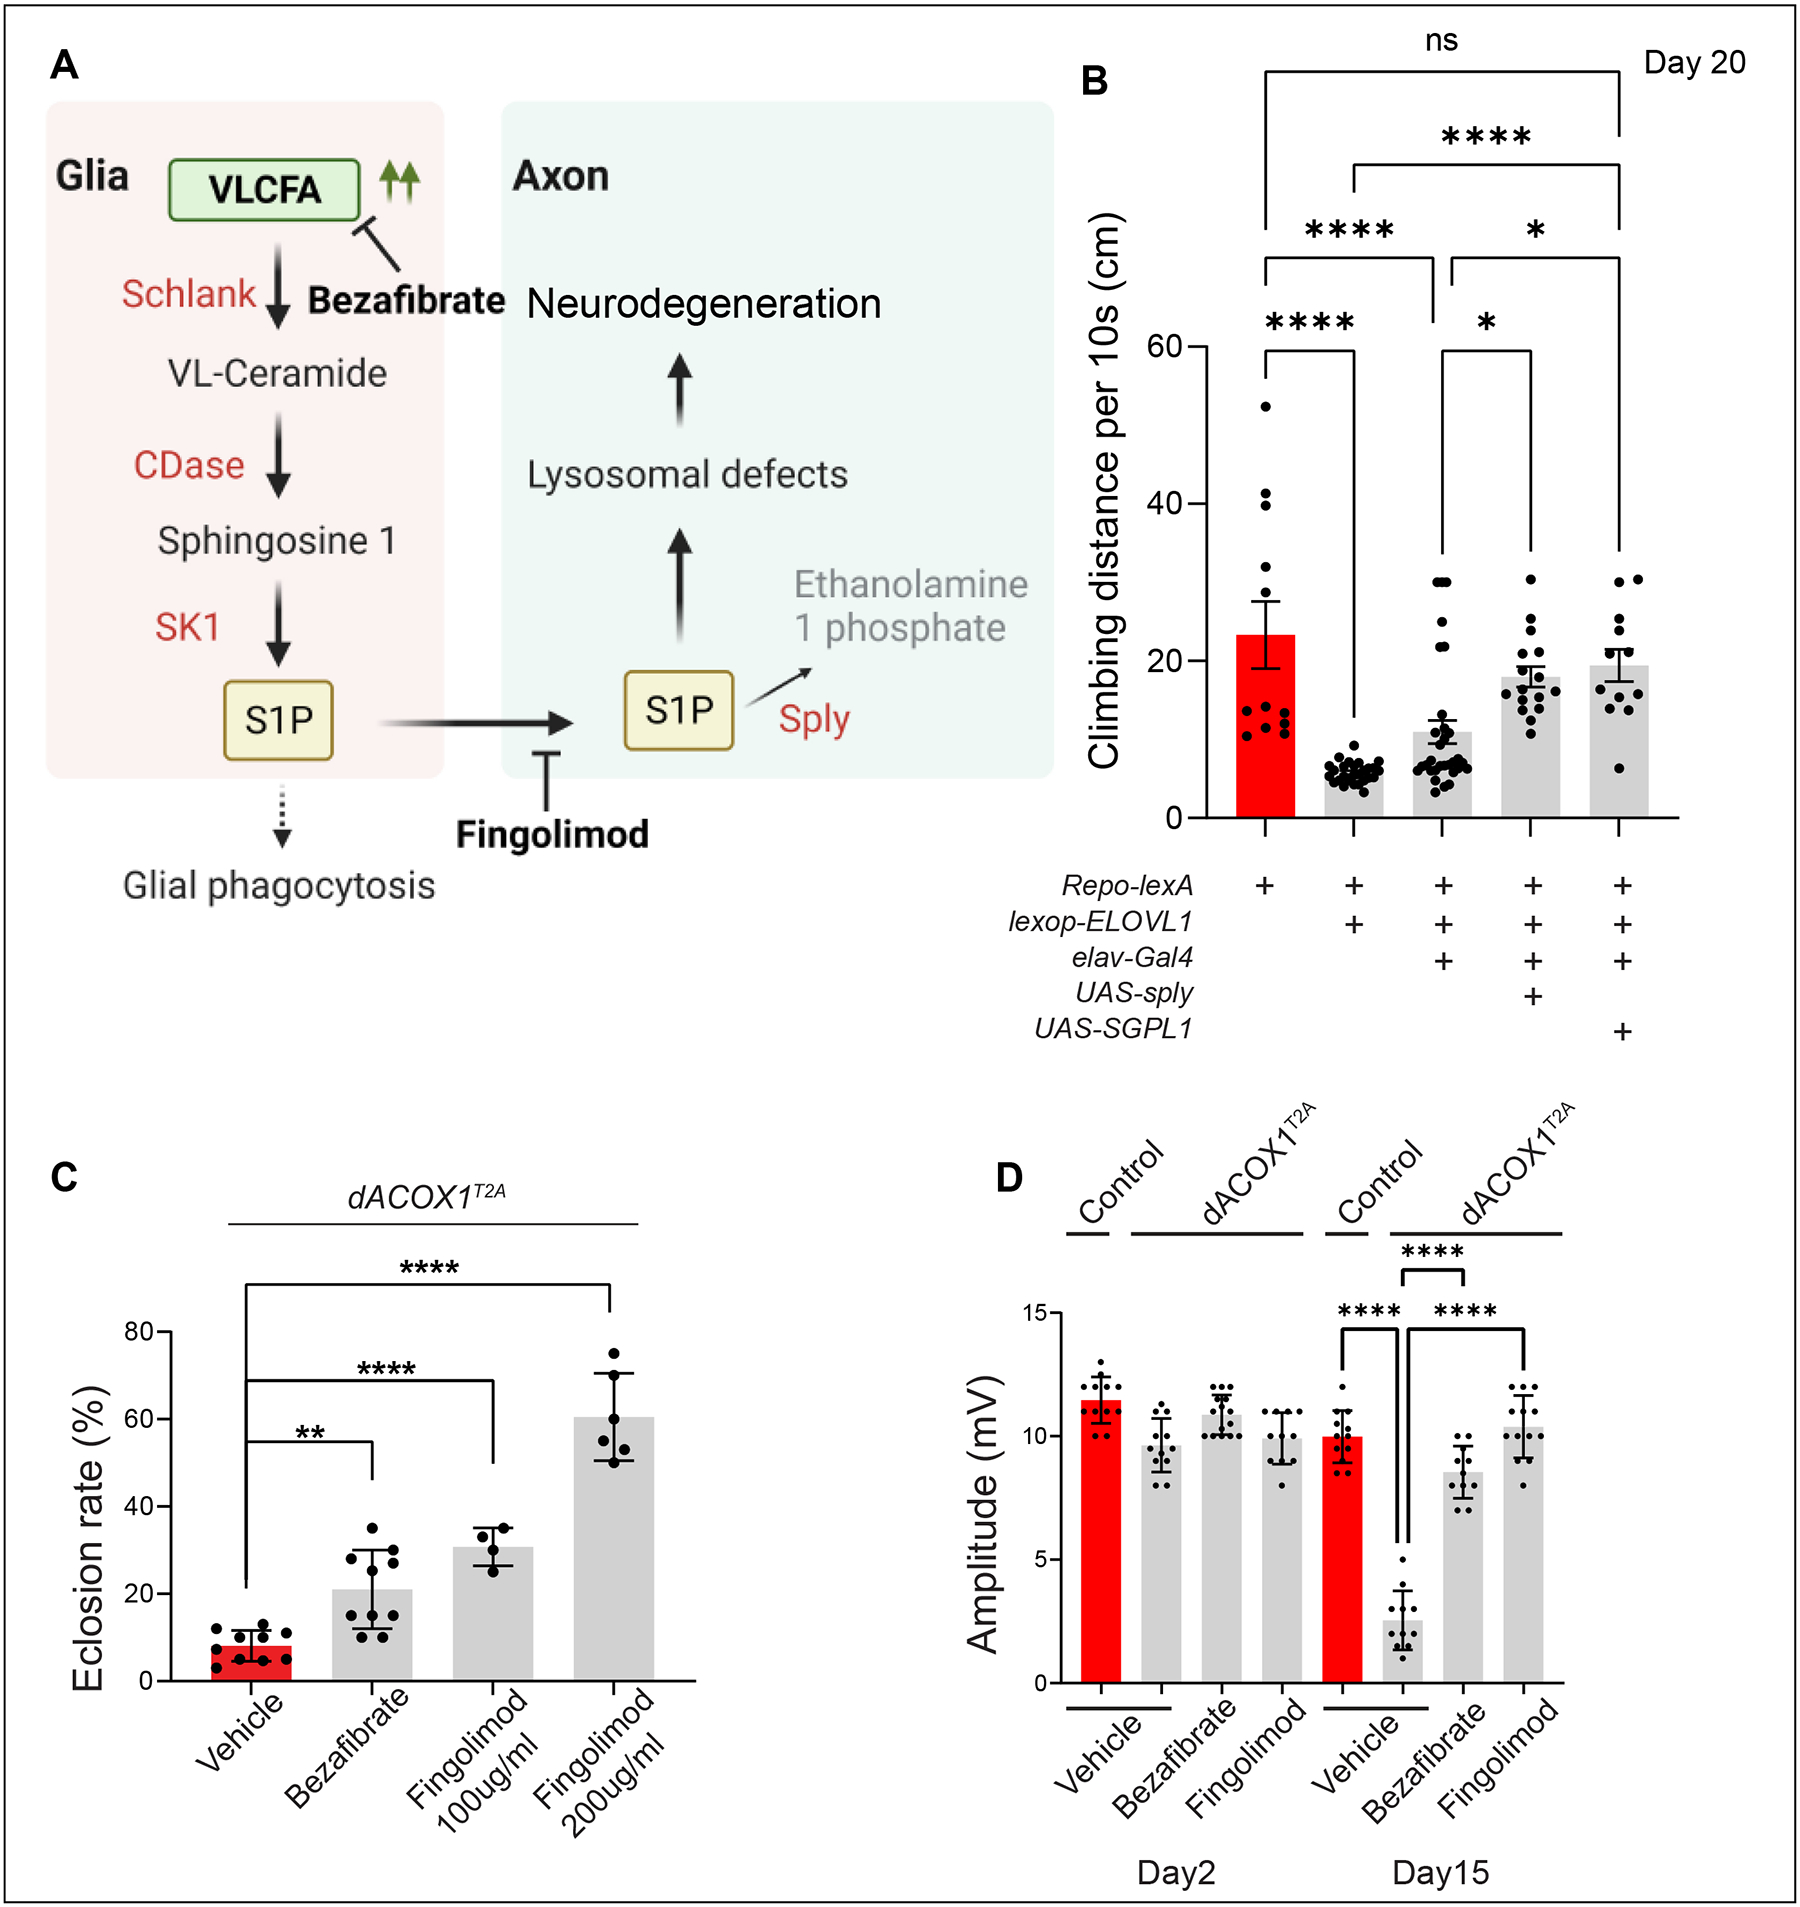
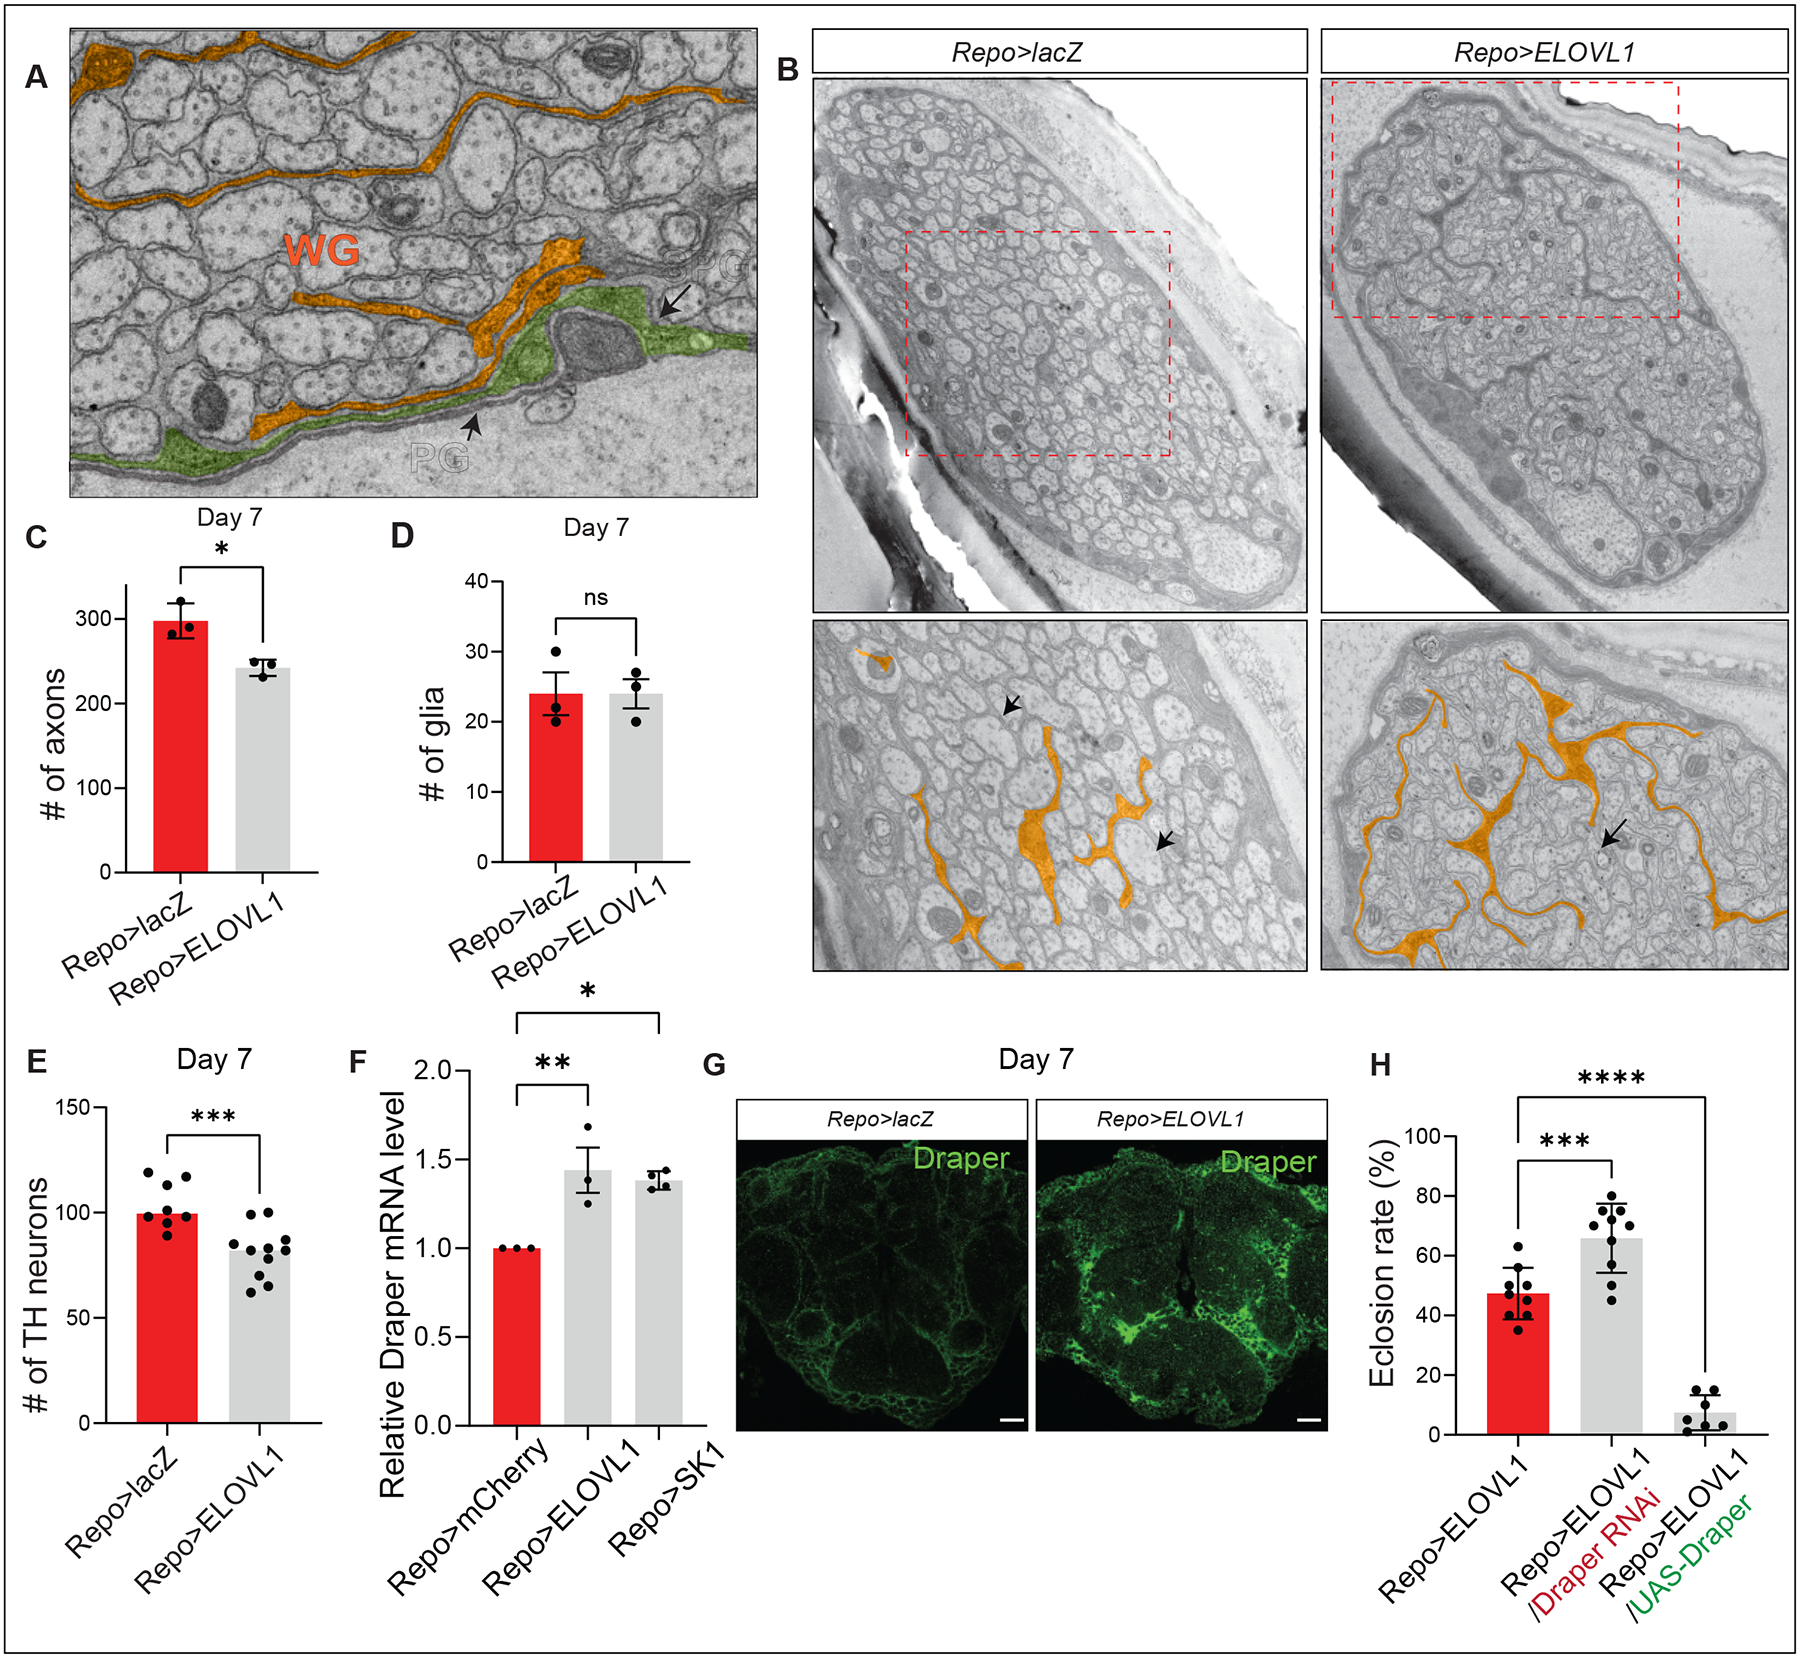
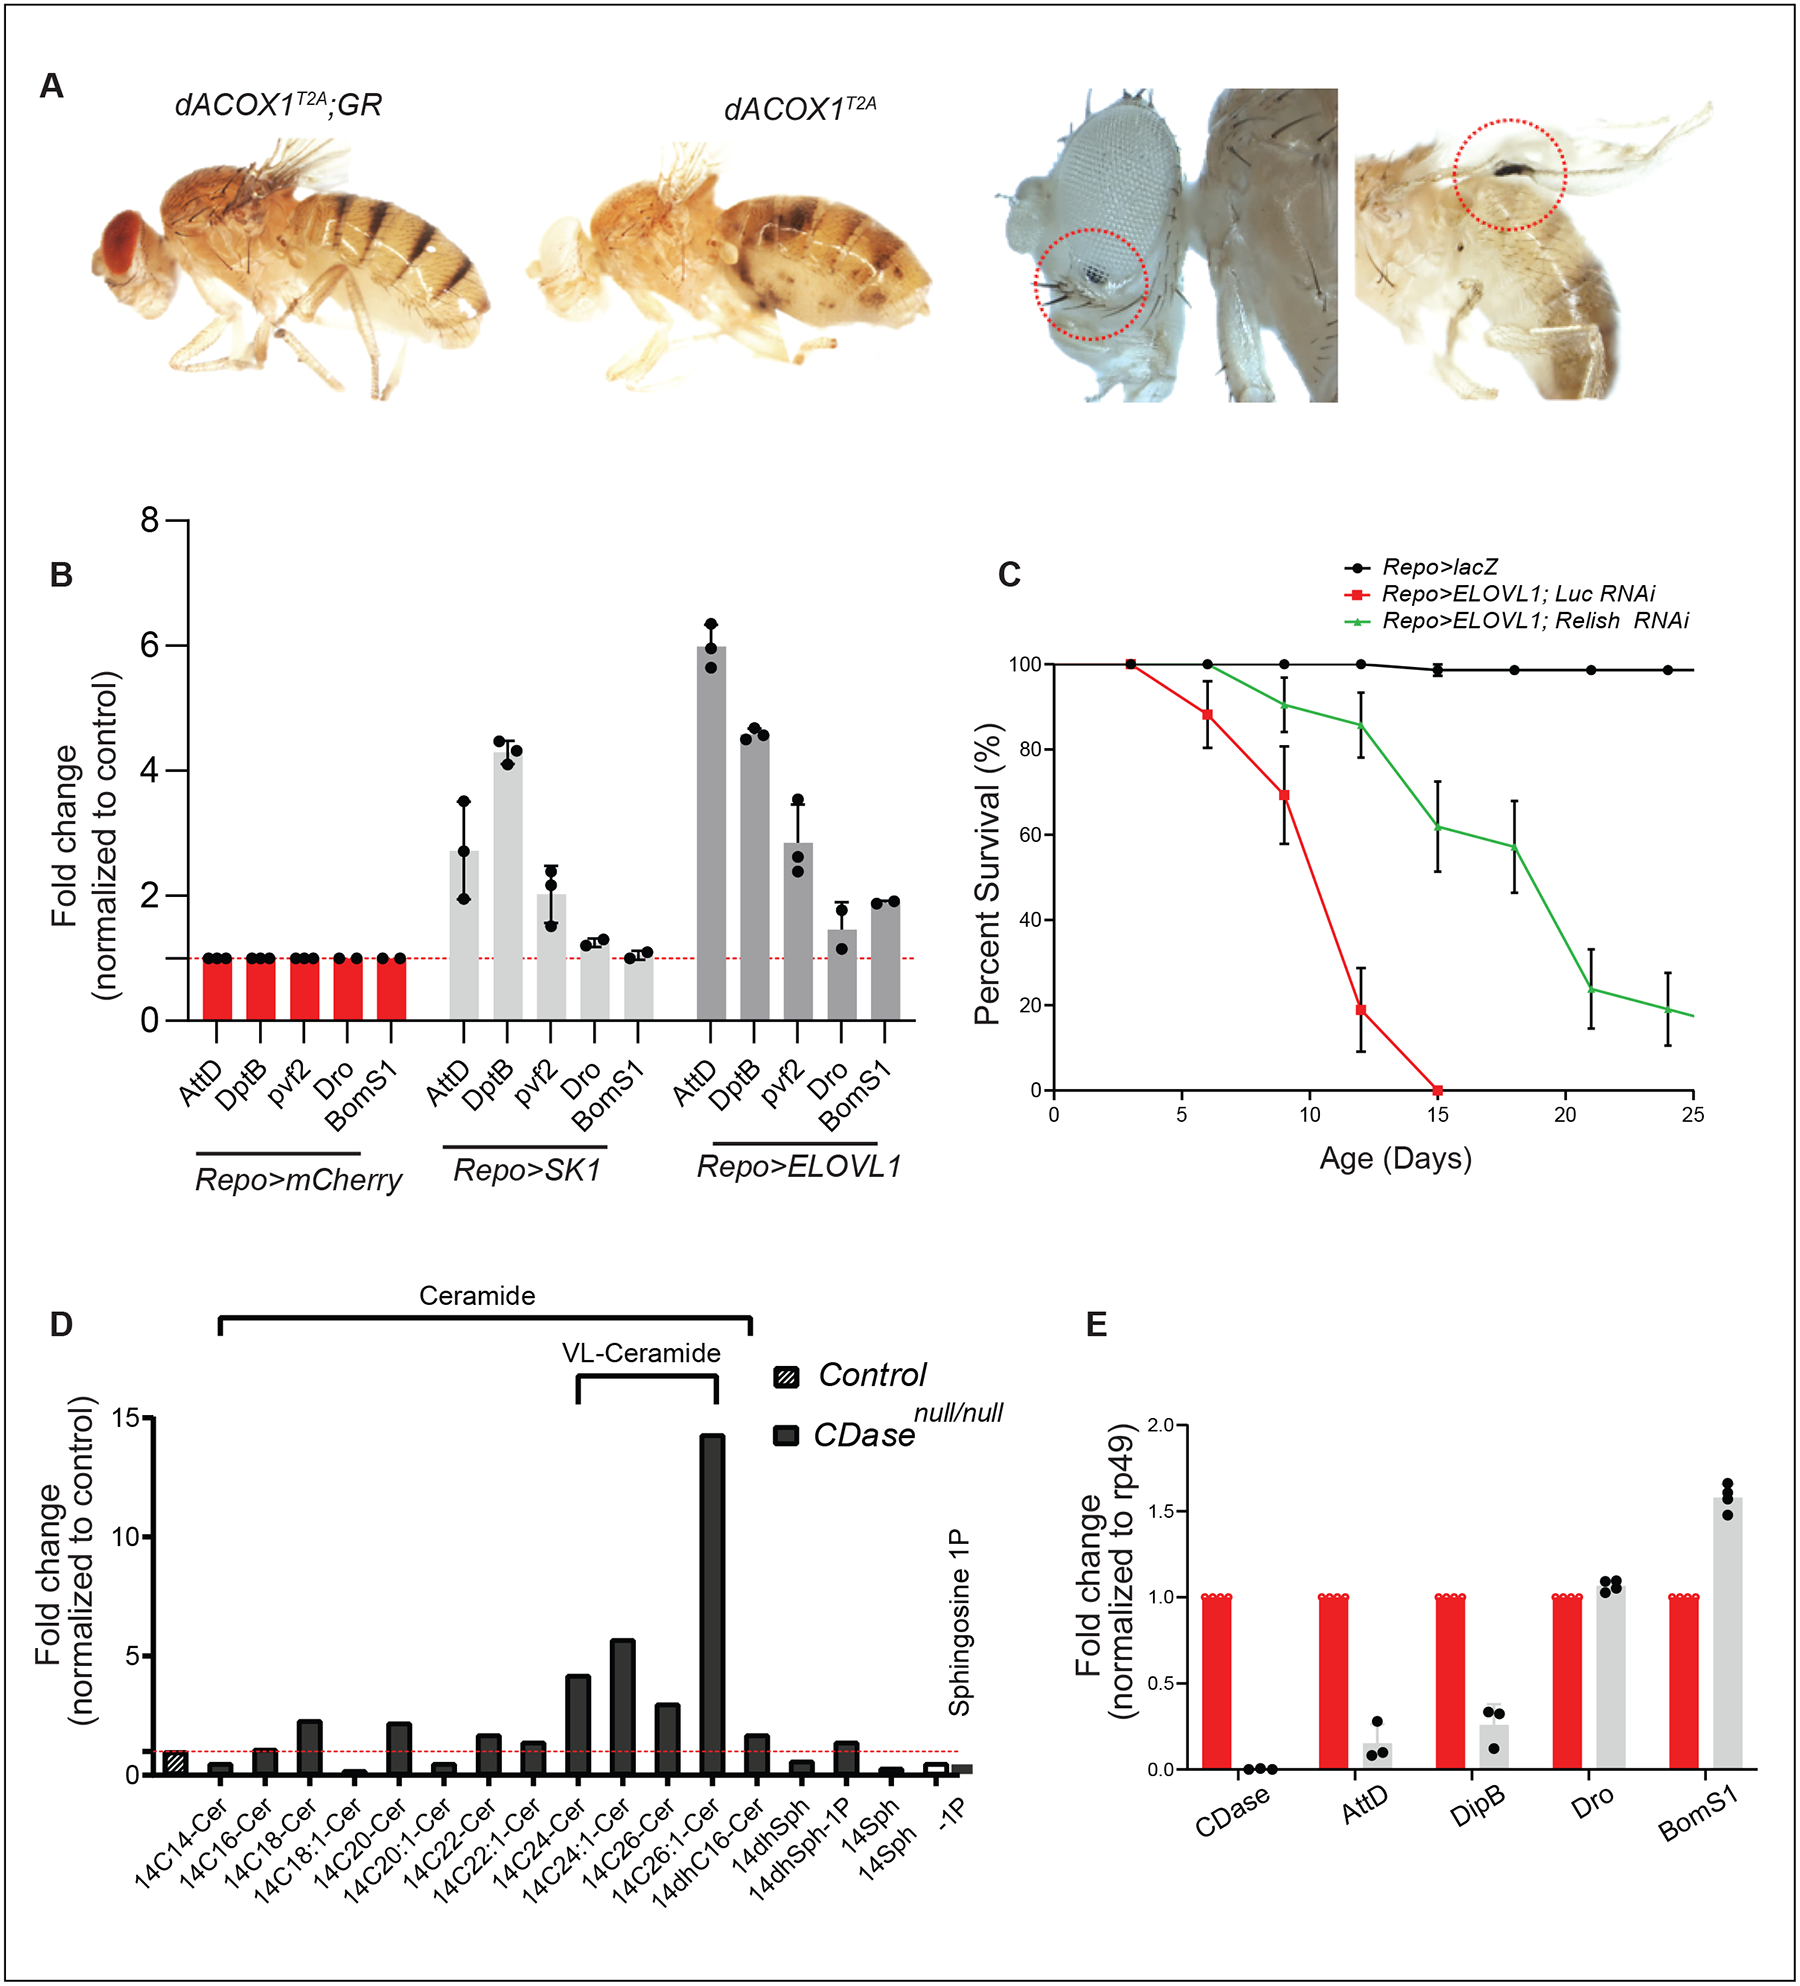
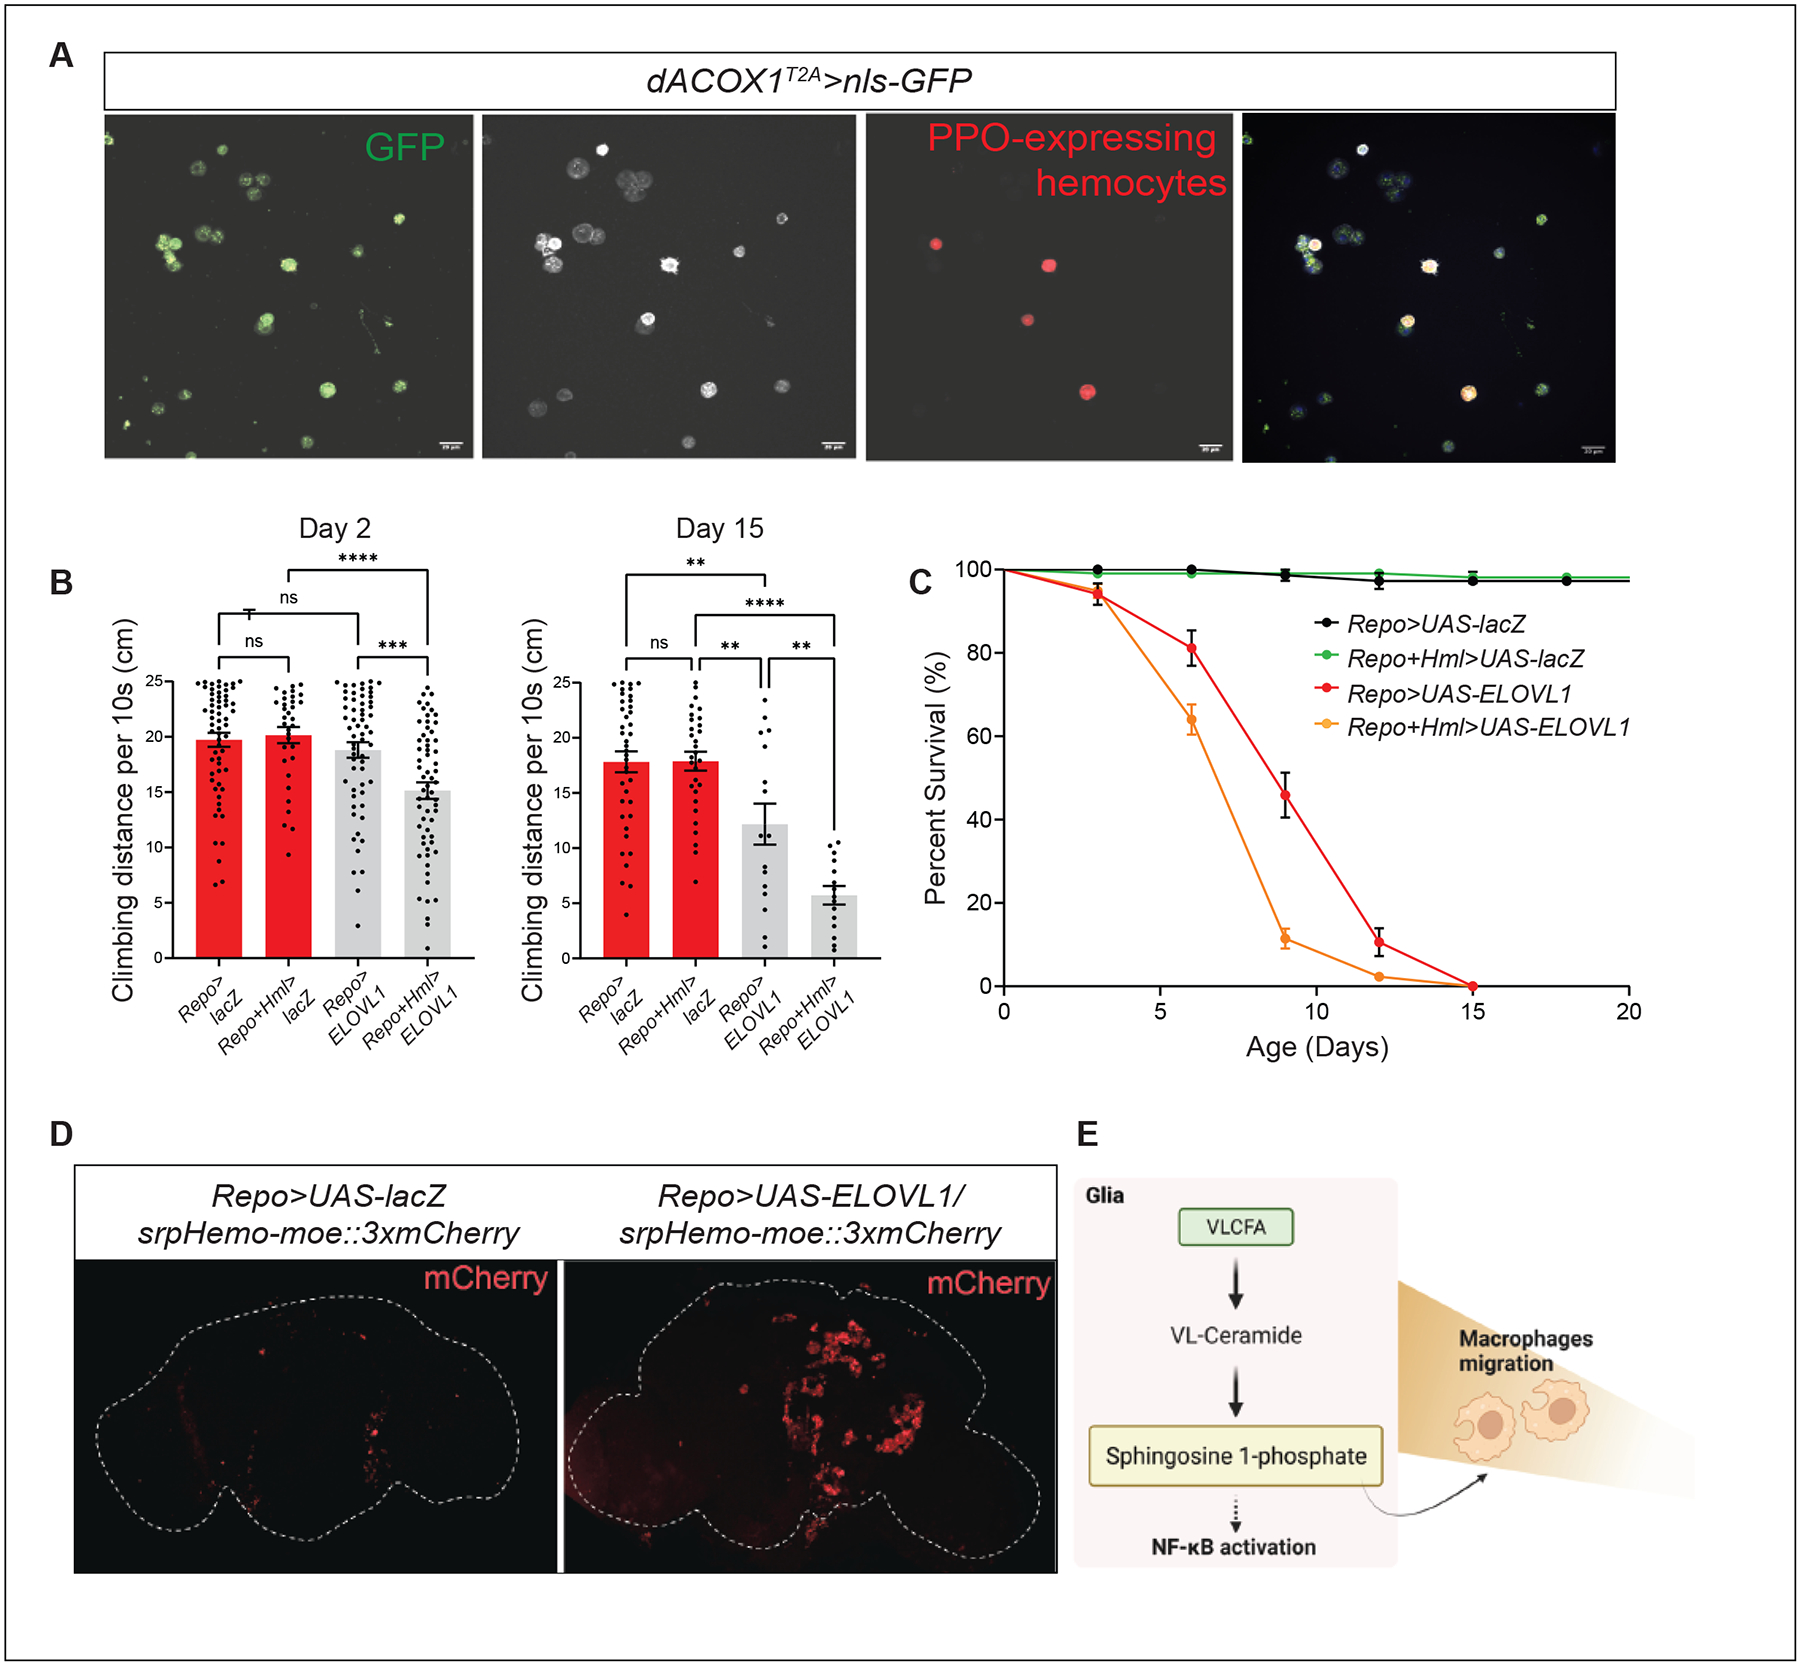
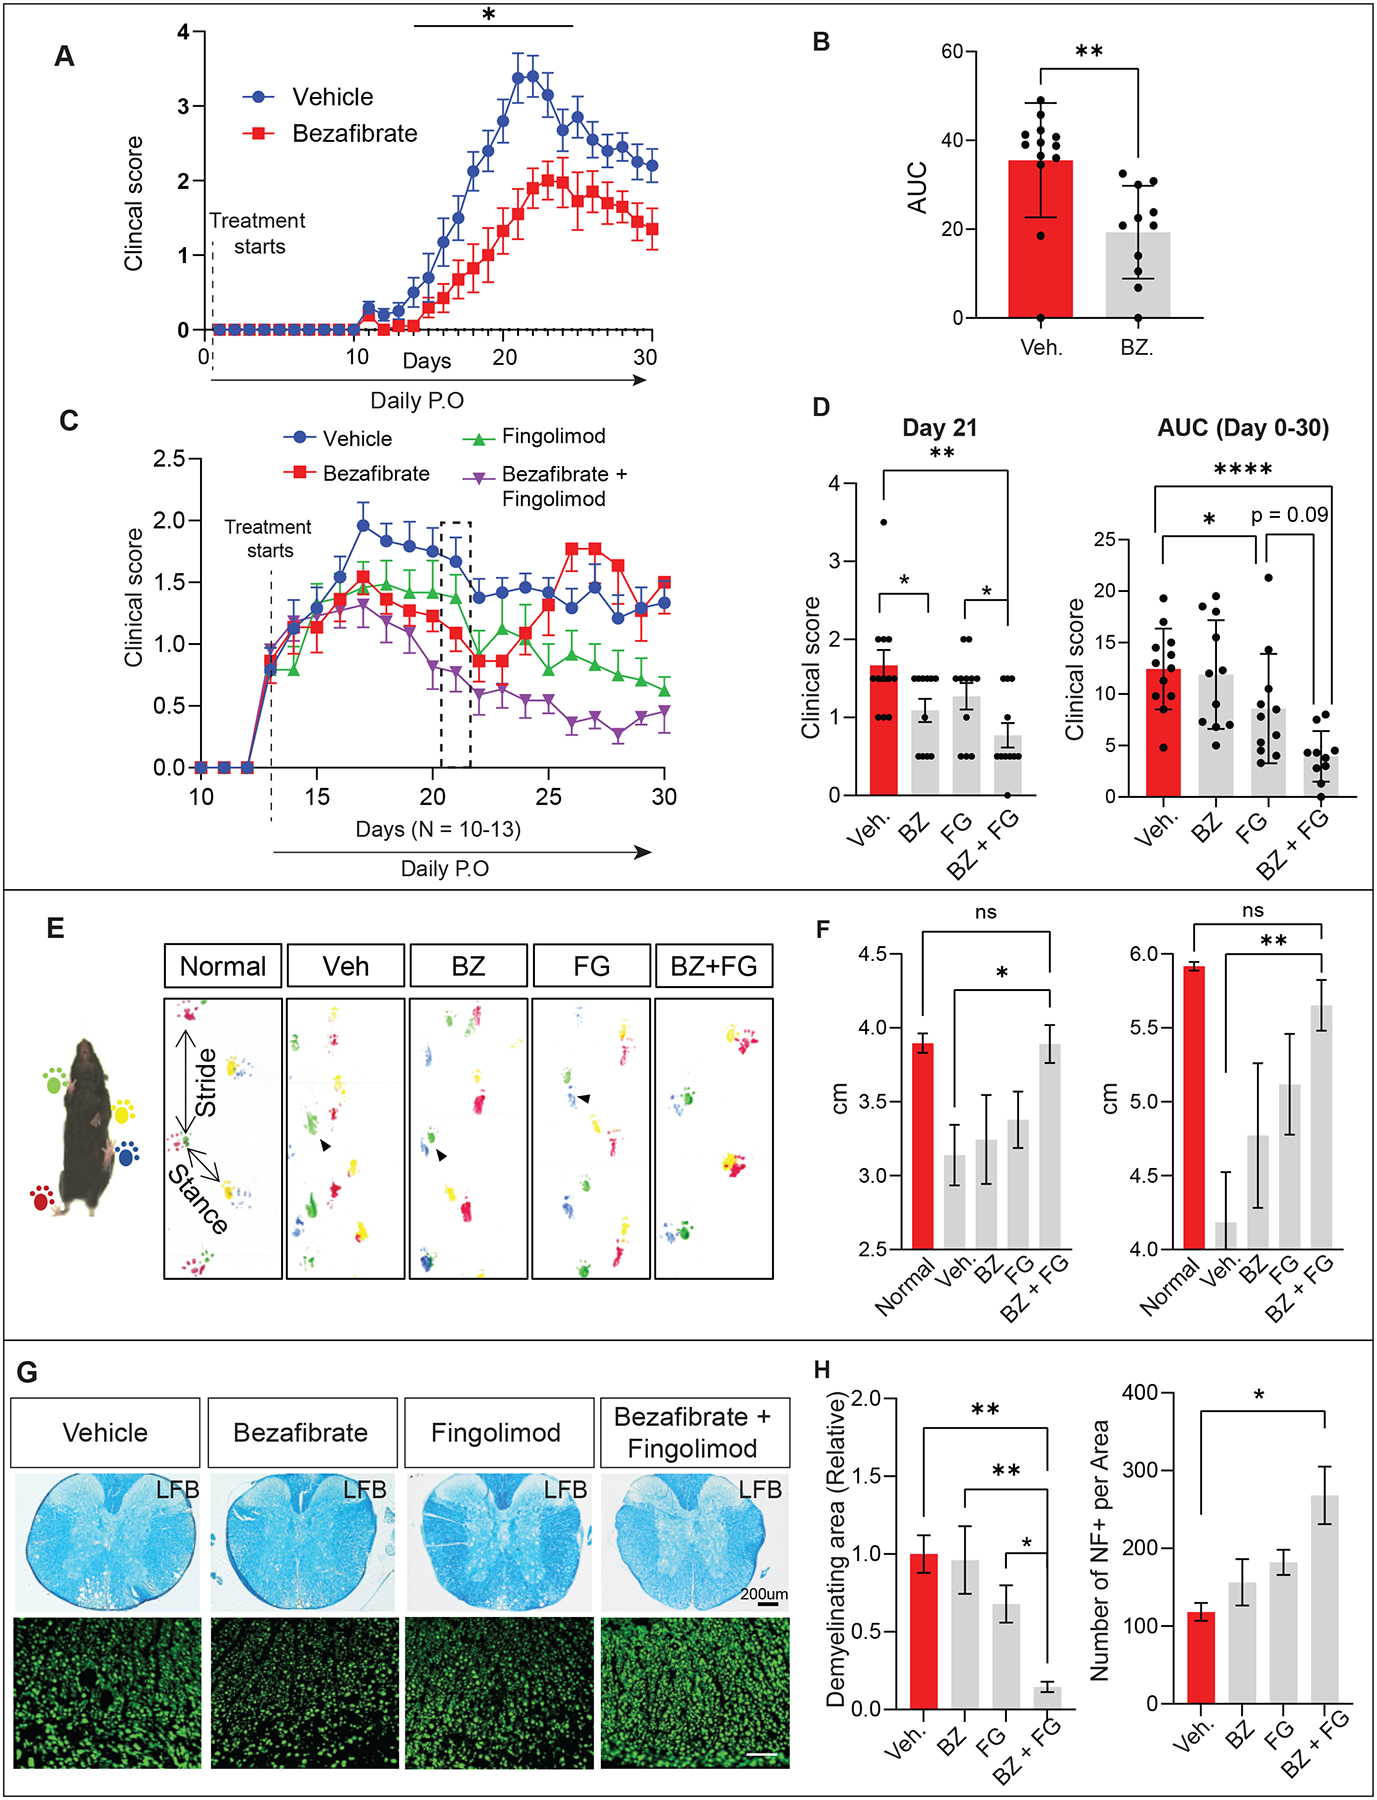
VLCFAs (very-long-chain fatty acids) are the most abundant fatty acids in myelin. Hence, during demyelination or aging, glia are exposed to higher levels of VLCFA than normal. We report that glia convert these VLCFA into sphingosine-1-phosphate (S1P) via a glial-specific S1P pathway. Excess S1P causes neuroinflammation, NF-κB activation, and macrophage infiltration into the CNS. Suppressing the function of S1P in fly glia or neurons, or administration of Fingolimod, an S1P receptor antagonist, strongly attenuates the phenotypes caused by excess VLCFAs. In contrast, elevating the VLCFA levels in glia and immune cells exacerbates these phenotypes. Elevated VLCFA and S1P are also toxic in vertebrates based on a mouse model of multiple sclerosis (MS), experimental autoimmune encephalomyelitis (EAE). Indeed, reducing VLCFA with bezafibrate ameliorates the phenotypes. Moreover, simultaneous use of bezafibrate and fingolimod synergizes to improve EAE, suggesting that lowering VLCFA and S1P is a treatment avenue for MS.

Keywords: NF-κB activation; VLCFA β-oxidation; fingolimod; lipid metabolism; multiple sclerosis; myelin lipid; neurodegeneration; neuroinflammation; sphingolipid; sphingosine 1-phosphate.


Conflict of interest statement

Declaration of interests The authors declare no competing interests.

Figures

Figure 1.
Figure 1.. Elevated levels of VLCFAs induce S1P production and neuronal dysfunction
(A) Expressing ELOVL RNAi to downregulate the fly homologue of ELOVL1 or Bezafibrate supplementation suppresses the low eclosion rate observed in Repo>ELOVL1 flies. Quantification of the percentage of expected animals per cross (n>6). (B) Glial ELOVL1 expression causes progressive climbing defects (n>24) and (C) significantly decreases lifespan (n=100 for Repo>lacZ and Repo>ELOVL1). (D) Model of the mechanisms of VLCFA leading to neurodegeneration. (E) Sphingolipid profiling in heads of dACOX1T2A mutants (n=500 per each genotype). Cer: Ceramide, Sph: Sphingsoine, dhSph: dihydro Sphingosine, Sph-1P: Sphingosine 1-phosphate, dhSph-1P: dehydro sphingosine 1-phosphate. GR: Genomic Rescue construct (F) Pathway to convert VLCFAs into S1P. (G) A decrease in the levels of CDase or SK1 but not SK2 significantly suppresses the lethality observed in Repo>ELOVL1 flies. Quantification of the percentage of expected animals per cross (n=5 per each genotype) (H) A decrease in the levels of CDase or SK1 significantly suppresses the progressive climbing defects observed in Repo>ELOVL1 flies (n>11). Statistical analyses are one-way ANOVA followed by a Tukey post hoc test. Results are mean ± s.e.m. (****p < 0.0001, ***p < 0.001, **p < 0.01; n.s., not significant).
Figure 2.
Figure 2.. S1P is synthesized in glia and transported to neurons
(A) Scheme of the structure of the CDaseT2A and SK1T2A alleles. (B) Both CDase and SK1 are expressed in glia of the adult CNS. Expression of CDaseT2A>nls-mCherry (red) colocalized with anti-Repo (green), marking the glia nuclei in adult CNS (Top). Expression of SK1T2A>nls-mCherry (red) colocalized with anti-Repo (green) (Bottom). Scale bar: 5 μm. (C) Increased synthesis of S1P results in severe climbing defects on Day 10 at 29°C degree (n>5). (D) Expression of ELOVL1 in glia increases the level of S1P in neurons. mCD8-GFP (green) labels the glial membrane, and anti-S1P (red) documents the expression pattern of S1P in the adult CNS. White arrows indicate abnormal glial membranes caused by glial ELOVL1 expression. The white dotted box indicates the region that is enlarged. Scale bar: 5 μm
Figure 3.
Figure 3.. Lowering S1P production or signaling improves neuronal function
(A) Schematic illustrating how VLCFA in glia may lead to neurodegeneration. (B) Neuronal expression of either UAS-sply or UAS-SGPL1 suppresses the progressive climbing defects observed in flies (Repo-lexA/lexop-ELOVL1) at Day 20 (n>12). (C) Supplementation of either Bezafibrate or Fingolimod can significantly suppress the lethality observed in dACOX1T2A mutant flies. Quantification of the percentage of expected animals per cross (n>4). (D) Bezafibrate and Fingolimod rescued the ERG amplitude defects of homozygous dACOX1T2A flies at Day 15 (n>10 per genotype). Statistical analyses are one-way ANOVA followed by a Tukey post hoc test. Results are mean ± s.e.m. (****p < 0.0001, ***p < 0.001, **p < 0.01; n.s., not significant).
Figure 4.
Figure 4.. Elevated S1P induces phagocytosis through Draper
(A) Image of a section of the wing nerve showing the three types of glia: Perineurial (PG), Subperineurial (SPG), and wrapping glia (WG). (B) Glial ELOVL1 expression leads to extended and expanded glial membranes. (C) The number of axons is significantly reduced in the wing margin nerves of Repo>ELOVL1 flies at Day 7 (n=3 per each genotype), however the (D) number of glia is not altered (E) The number of TH neurons is significantly reduced in CNS of Repo>ELOVL1 flies (n=6 for Repo>lacZ, n=11 for Repo>ELOVL1). (F) The relative Draper mRNA levels are significantly increased in the CNS of Repo>ELOVL1 and Repo>SK1 flies (n=3 per each genotype). (G) Draper protein levels are increased in Repo>ELOVL1 fly heads. (H) Eclosion rates of Repo>ELOVL1 flies are modulated by Draper expression. Quantification of the percentage of expected animals per cross (n>7). Statistical analyses are one-way ANOVA followed by a Tukey post hoc test. Results are mean ± s.e.m. (****p < 0.0001, ***p < 0.001, **p < 0.01; n.s., not significant).
Figure 5.
Figure 5.. Glial VLCFA/S1P accumulation induces a robust immune response via the IMD pathway
(A) Melanization is observed in numerous tissues of dACOX1 mutant flies (dACOX1T2A). These are not observed in control flies (dACOX1T2A;GR). (B) Repo>ELOVL1 and Repo>SK1 induce a robust elevation of the AntiMicrobacterial Peptides (AMPs) dependent on the IMD pathway but not the Toll pathway in adult heads (80> heads of flies were used per genotype. n=3). (C) Expression of Relish RNAi suppresses the short life span (n>50 per genotype) observed in Repo>ELOVL1 flies. (D) Sphingolipid profiling in heads of yw (control) and CDase mutants (yw;CDasenull) (n=500 for each genotype). (E) Fold changes of the levels of AMPs in control (yw), CDase null flies (yw;CDasenull) (n>30 heads of flies were used per genotype. n=3).
Figure 6.
Figure 6.. An elevation of S1P in glia or immune cells promotes neuroinflammation
(A) dACOX1 is expressed in immune cells. Green (mCD8GFP) marks the dACOX1-expressing cells. White labels all immune cells (Hemese+). Red (BcF6-mCherry) indicates crystal cells (PPO1+). Scale bar: 20 μm. (B-C) Concurrent expression of ELOVL1 in both glia and immune cells (Repo+Hml>ELOVL1) leads to significantly enhanced progressive climbing defects on both Day 2 and 15 (n>35 per genotype) (B) and a life-span decrease (C) when compared to controls (n>50 per genotype). (D) Expression of ELOVL1 in glia (Repo>ELOVL1) induces hemocyte infiltration into the CNS when compared to control brains (Repo>UAS-LacZ). (E) Schematic showing that VLCFA accumulation leads to hemocytes recruitment into the CNS. Statistical analyses are one-way ANOVA followed by a Tukey post hoc test. Results are mean ± s.e.m. (****p < 0.0001, ***p < 0.001, **p < 0.01; n.s., not significant).
Figure 7.
Figure 7.. Co-treatment of EAE mice with Bezafibrate and Fingolimod synergistically improves behavior and cellular pathology
(A) The clinical score during EAE progression was recorded and statistically analyzed using two-way ANOVA, followed by Sidak post-hoc analysis; n = 10–13 per group. (B) Overall disease severity of EAE mice was compared by calculating the area under the curve (AUC) between day 14–30, followed by unpaired Student’s t-test; n = 10–13 per group (C-D) EAE mice were randomly divided into 4 groups based on the clinical score at the onset of EAE (Day 13) and treated with Bezafibrate (100 mg/kg), Fingolimod (3mg/kg), a combination of Bezafibrate (100 mg/kg) and Fingolimod (3mg/kg) or vehicle by daily oral gavage. Clinical scores were compared with vehicle control (n = 11–12 per group). Overall disease severity of EAE mice was compared by calculating the area under the curve (AUC) between day 18–30, followed by unpaired Student’s t-test; n = 11–12 per group. Data were statistically analyzed using two-way ANOVA, followed by Sidak post-hoc analysis,; (E-F) EAE mice were subjected to footprint analysis on Day 30. For normal non-EAE wt mice, green and red mark the right feet, and yellow and blue mark the left feet. For the experimental mice (Veh, BZ, FG, and BZ+FG), red and yellow mark the right feet, and green and blue mark the left feet. Stride and stance distance were measured to indicate fine motor function and were statistically analyzed using two-way ANOVA, followed by Sidak post-hoc analysis. (G) Spinal cord sections from the EAE mice were stained by Luxol fast blue (LFB) to assess demyelination and stained for neurofilament (NF) to assess neuronal loss (n =4–6 per group). (H) Quantifications of LFB and NF staining. Values were normalized to vehicle-treated control and statistically analyzed by using two-way ANOVA, followed by Sidak post-hoc analysis, * p < 0.05, ** p < 0.01, *** p < 0.001, **** p < 0.0001. Data in all figures are represented as mean ± SEM.

References

    1. Nave KA (2010). Myelination and support of axonal integrity by glia. Nature 468, 244–252. 10.1038/nature09614. - DOI - PubMed
    1. Chrast R, Saher G, Nave KA, and Verheijen MH (2011). Lipid metabolism in myelinating glial cells: lessons from human inherited disorders and mouse models. J Lipid Res 52, 419–434. 10.1194/jlr.R009761. - DOI - PMC - PubMed
    1. Williams KA, and Deber CM (1993). The structure and function of central nervous system myelin. Crit Rev Clin Lab Sci 30, 29–64. 10.3109/10408369309084665. - DOI - PubMed
    1. O’Brien JS (1965). Stability of the Myelin Membrane. Science 147, 1099–1107. 10.1126/science.147.3662.1099. - DOI - PubMed
    1. Norton WT, and Poduslo SE (1973). Myelination in rat brain: changes in myelin composition during brain maturation. J Neurochem 21, 759–773. 10.1111/j.1471-4159.1973.tb07520.x. - DOI - PubMed

Publication types

MeSH terms