. 2023 May 8;41(5):853-870.e13.
doi: 10.1016/j.ccell.2023.03.021. Epub 2023 Apr 20.

Transcriptional-translational conflict is a barrier to cellular transformation and cancer progression

Affiliations

Transcriptional-translational conflict is a barrier to cellular transformation and cancer progression

Sujata Jana et al. Cancer Cell. .

Abstract

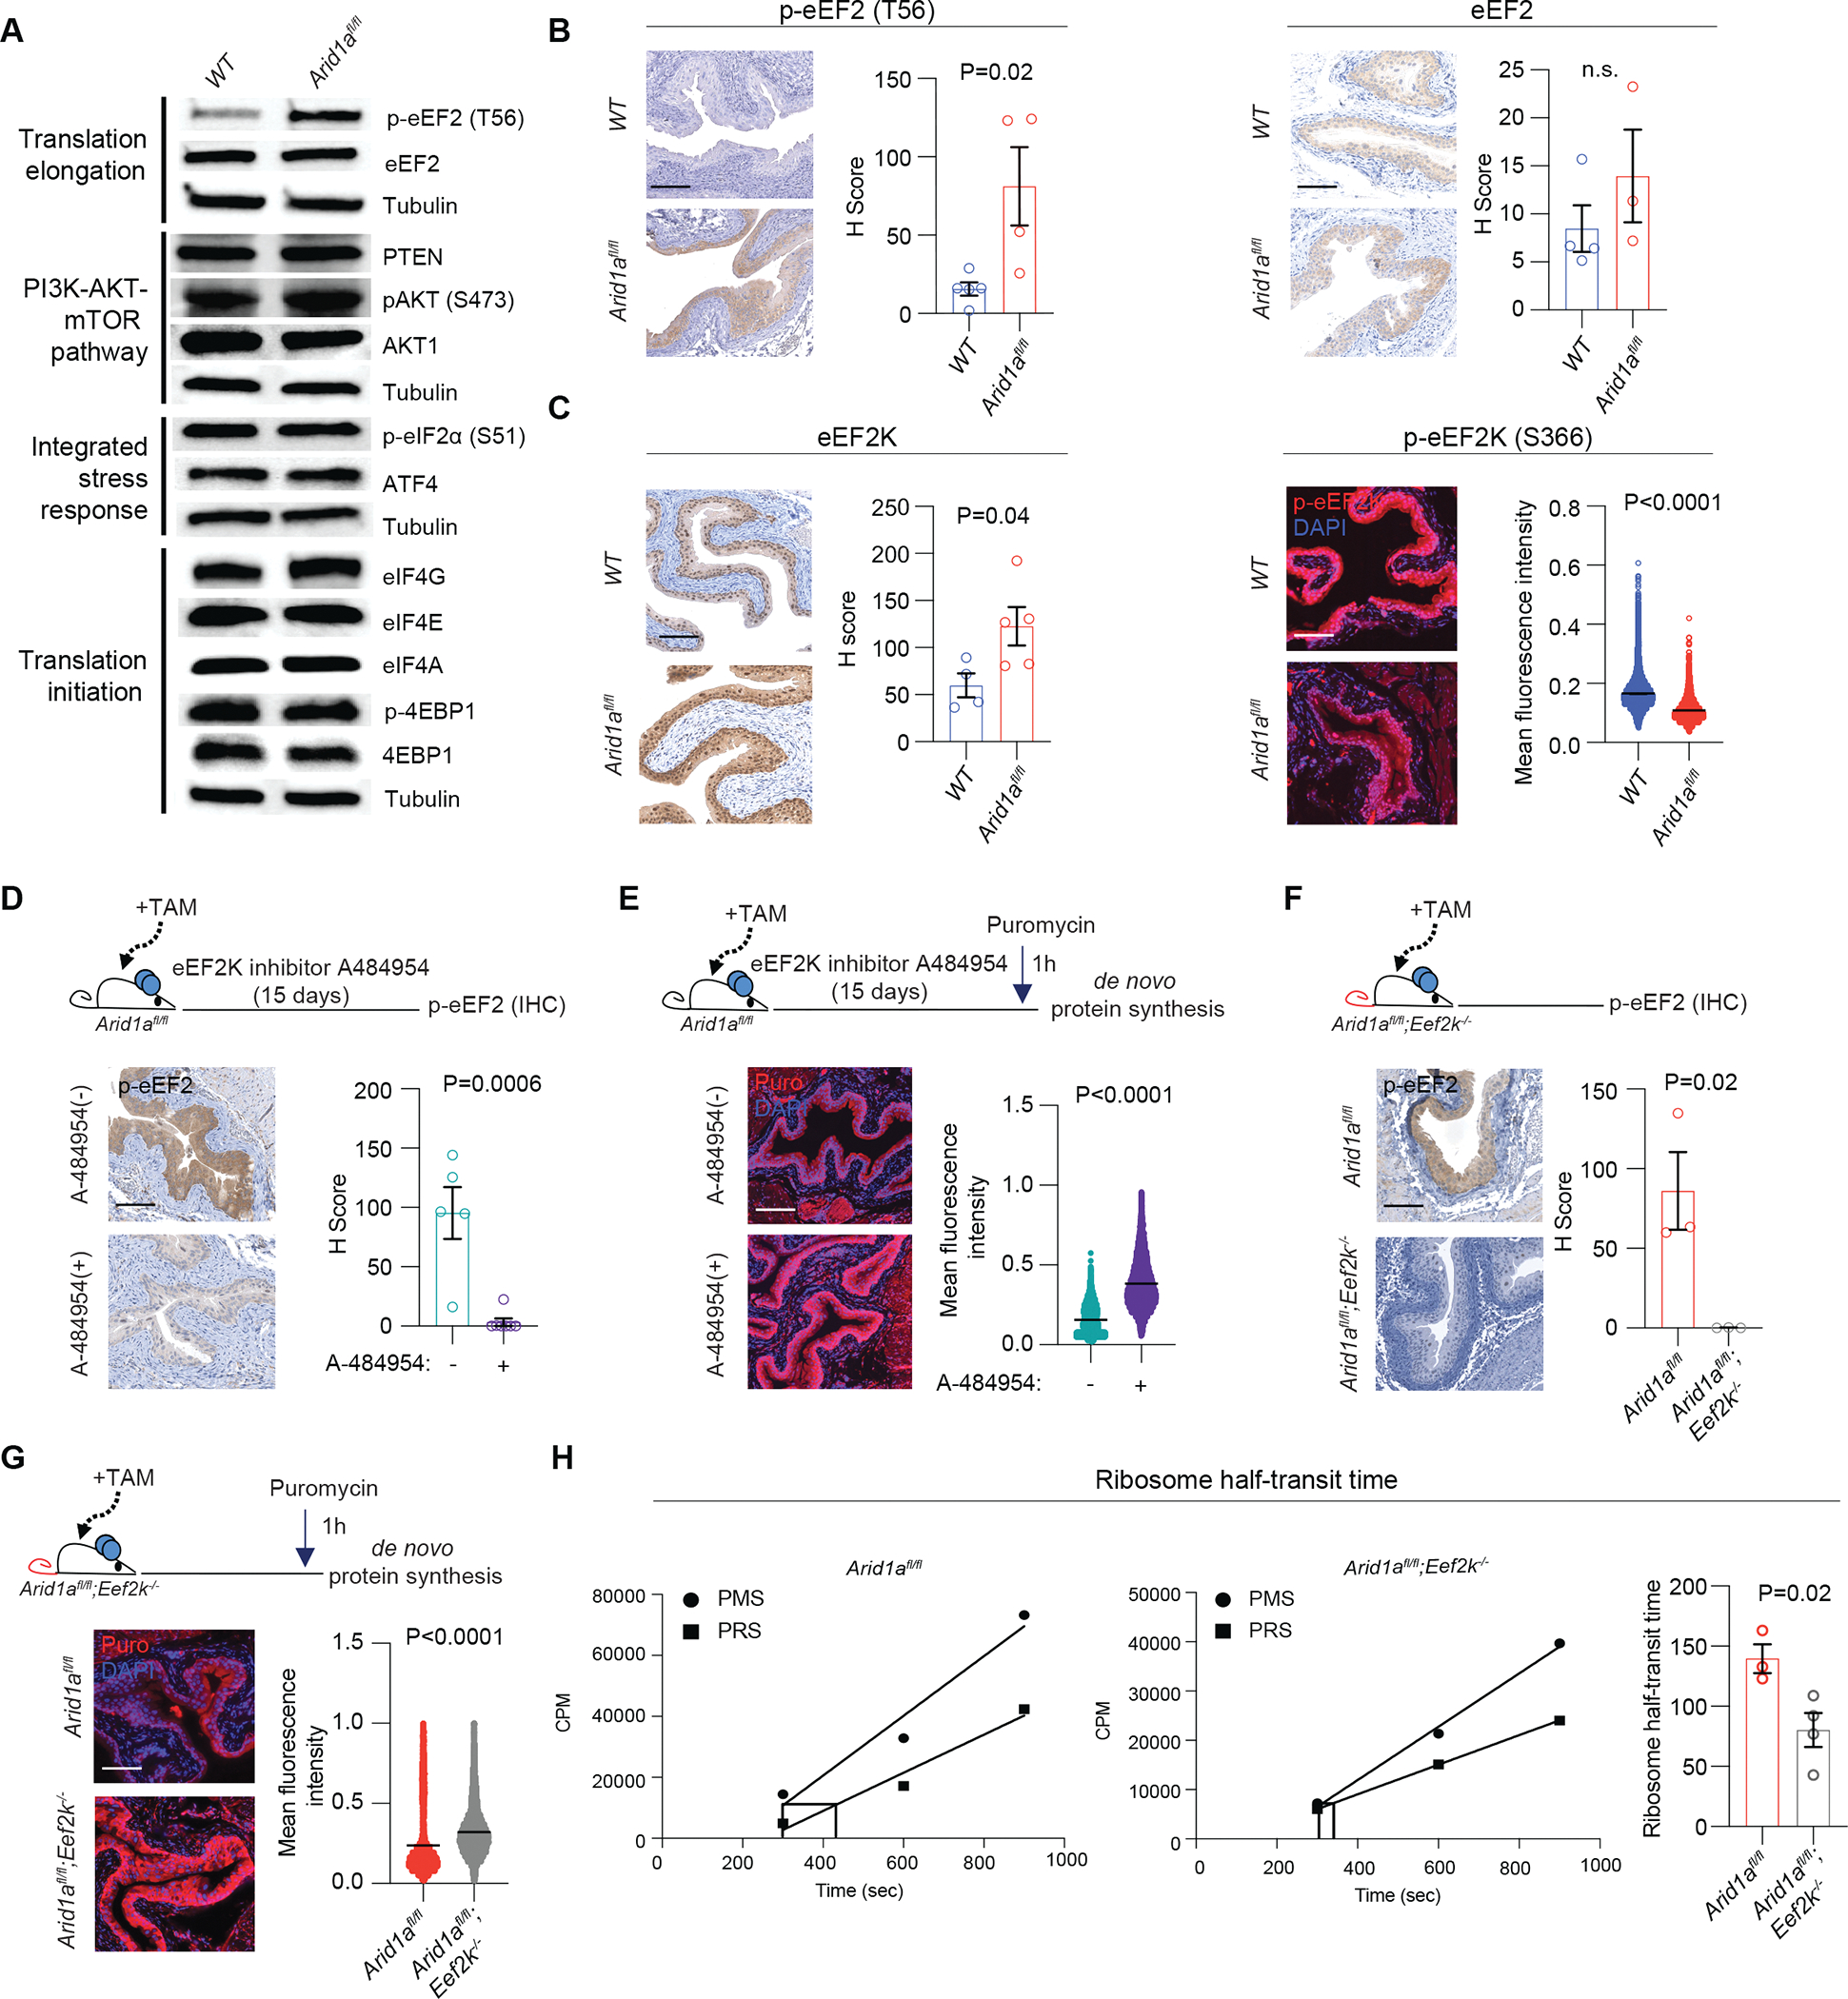
We uncover a tumor-suppressive process in urothelium called transcriptional-translational conflict caused by deregulation of the central chromatin remodeling component ARID1A. Loss of Arid1a triggers an increase in a nexus of pro-proliferation transcripts, but a simultaneous inhibition of the eukaryotic elongation factor 2 (eEF2), which results in tumor suppression. Resolution of this conflict through enhancing translation elongation speed enables the efficient and precise synthesis of a network of poised mRNAs resulting in uncontrolled proliferation, clonogenic growth, and bladder cancer progression. We observe a similar phenomenon in patients with ARID1A-low tumors, which also exhibit increased translation elongation activity through eEF2. These findings have important clinical implications because ARID1A-deficient, but not ARID1A-proficient, tumors are sensitive to pharmacologic inhibition of protein synthesis. These discoveries reveal an oncogenic stress created by transcriptional-translational conflict and provide a unified gene expression model that unveils the importance of the crosstalk between transcription and translation in promoting cancer.

Keywords: ARID1A; MAP kinase; RASGRP1; SWI/SNF; bladder cancer; eEF2; eEF2K; homoharringtonine; transcription; translation elongation.


Conflict of interest statement

Declaration of interests The authors declare no competing interests.

Figures

Figure 1.
Figure 1.. Loss of ARID1A leads to gene-specific transcriptional-translational conflict.
(A) Schema of UBC-CreERT and K5-CreERT Arid1afl/fl models. (B) Pathway enrichment analysis of 262 mRNAs upregulated in the context of ARID1A loss. (C) Heat map showing a subset of pro-proliferation upregulated mRNAs from Arid1afl/fl mice (>1.2 Log2 fold change, FDR<0.05). (D) Hematoxylin and eosin (H&E) staining (left with keratin 5 inset) and quantification (right) of mouse bladder urothelial thickness (total [n=4/genotype] and basal cells [n=3/genotype]) in 400-day old WT and Arid1afl/fl mice. t-test. (E) Immunohistochemistry (IHC) of ARID1A (left) and parallel sectioning and immunofluorescence (IF) of puromycin incorporation (right) in WT and Arid1afl/fl urothelium (DAPI=nuclei). n>6/genotype, >8,900 cells/genotype, t-test. (F) Puromycin immunoblot of WT and Arid1afl/fl urothelial organoids (replicate of 3). (G) Schema of the polysome profiling assay (top). Polysome tracing showing an increase in polysome accumulation (left) and quantification showing an increase in the polysome (P) to sub-polysome (S) ratio (mean +/− S.E.M.). n=2/genotype, t-test. (H) Waterfall plot showing polysome (P) to sub-polysome (S) ratio of 262 upregulated oncogenic mRNAs in Arid1afl/fl mice. (I) Volcano plot of TMT mass spectrometry showing that 70% of upregulated mRNAs (105 out of 150 – only 150 of the 262 genes were detected by TMT mass spectrometry) identified by RNA-seq (Figure 1C and Table S1) do not increase in protein abundance (<0.67 log2 fold change and/or FDR >0.05, green dots) in Arid1afl/fl mice. Vertical lines demarcate log2 fold change +/−0.67 and horizontal line demarcate FDR < or >0.05. All scale bars = 100 μm. Also see Figure S1.
Figure 2.
Figure 2.. ARID1A is a positive regulator of mRNA translation elongation.
(A) Immunoblots of regulators of mRNA translation in WT and Arid1afl/fl urothelial organoids (replicate of 3). (B) IHC and quantification of phospho-eEF2 (T56) and total eEF2, levels in WT and Arid1afl/fl bladder urothelium. n≥3/genotype, t-test. (C) IHC or IF, and quantification of total eEF2K and phospho-eEF2K (S366) levels in WT and Arid1afl/fl bladder urothelium. Violin plot represents >9500 cells per genotype. n≥4/genotype, t-test. (D+E) IHC analysis of phospho-eEF2 (T56) and IF analysis of puromycin incorporation after treatment with A-484954 in Arid1afl/fl mice. Violin plot represents >7700 cells/genotype. n≥4/treatment arm, t-test. (F+G) IHC analysis of phospho-eEF2 (T56) and IF analysis of puromycin incorporation in Arid1afl/fl and Arid1afl/fl;Eef2k−/− mice. Violin plot represents >6000 cells/genotype. n≥5/genotype, t-test. (H) Ribosome half-transit time in Arid1afl/fl and Arid1afl/fl;Eef2k−/− organoids (linear regression, left panels). Bar graph (right) represents the average ribosome half-transit time of 3 independent experiments. PMS= post mitochondrial supernatants [complete + nascent proteins]. PRS= post ribosomal supernatant [complete proteins]. t-test. n.s. = not significant, scale bar = 100 μm, mean ± SEM. Also see Figure S2.
Figure 3.
Figure 3.. ARID1A regulates mRNA translation elongation through RASGRP1.
(A) Schematic of upstream signaling pathways that activate (AMPK pathway) or deactivate (PI3K and MAPK pathways) eEF2K. (B) IHC and quantification of phospho-MEK1/2, phospho-ERK1/2, and phospho-p90RSK in WT and Arid1afl/fl urothelium. n≥4/genotype, t-test. (C) RNA-seq mRNA expression of upstream MAPK regulators in WT and Arid1afl/fl urothelial cells. n=3/genotype, t-test. (D) RASGRP1 IHC and quantification in WT and Arid1afl/fl mice. n≥5/genotype, t-test. (E) Arid1a ChIP QPCR of the Rasgrp1 promoter in WT and Arid1afl/fl organoids. n=2/genotype, t-test. (F+G) IHC of RASGRP1 (top) and phospho-eEF2 (T56) (bottom) in WT and Rasgrp1−/− mice. n≥3/genotype, t-test. (H) H3K27me3 CUT&Tag from WT (blue) and Arid1afl/fl (red) organoids. Black arrows=Rasgrp1 promoter. (I) QPCR of Rasgrp1 in Arid1afl/fl organoids after treatment with GSK126 (12.5μM). t-test. (J) RASGRP1 IF in Arid1afl/fl organoids after treatment with GSK126. n=4/genotype, >50,000 cells/genotype, t-test. (K) Immunoblot analysis of phospho-eEF2 and total eEF2 in Arid1afl/fl organoids +/− GSK126. Each blot is representative of three biological replicates. n.s. = not significant, scale bar = 100 μm, mean ± SEM. Also see Figure S3.
Figure 4.
Figure 4.. Transcriptional-translational conflict is a tumor suppressive barrier.
(A) FACS analysis of Arid1a recombined cells (YFP+) in Arid1afl/fl, and Arid1afl/fl;Eef2k−/− urothelial organoids over 9 successive passages (P2-P9). Representative ARID1A immunoblot from Arid1afl/fl and Arid1afl/fl;Eef2k−/− urothelial organoids after two passages (P2) and 9 passages (P9). (B) H&E (left) and urothelial thickness (right) in WT, Eef2k−/−, Arid1afl/fl, and Arid1afl/fl;Eef2k−/− mice 400 days after tamoxifen. n≥4/genotype, t-test. (C) Clonogenic assay of Arid1afl/fl;Eef2k−/− urothelial cells treated with an anti-FGFR3 antibody or the ODC1 inhibitor DFMO. n=8 biological replicates, t-test. (D) Kaplan-Meier survival curve of WT and Arid1afl/fl mice treated with BBN followed by tamoxifen. WT=13 mice, Arid1afl/fl=16 mice, Logrank test. (E) IF and quantification of puromycin incorporation in WT and Arid1afl/fl mice treated with BBN followed by tamoxifen (Figure 4D). n=4/genotype, >30,000 cells/genotype. (F) Ki67 staining and quantification in WT and Arid1afl/fl tumors (Figure 4D). n=4/genotype, t-test. (G) Immunoblots of AURKB, KIF22, ODC1 and SKA1 in WT and Arid1afl/fl tumors (replicate of 3). (H) RNA-seq analysis of normal and cancer urothelial cells in WT and Arid1afl/fl backgrounds. Up (red) or down (blue) regulated mRNAs are unique to ARID1A loss (DEGs = differentially expressed genes). (I) IHC and quantification of phospho-eEF2 (T56) in WT and Arid1afl/fl tumors. n≥5/genotype, t-test. (J) Representative images and quantification of human muscle invasive bladder cancer (MIBC) from the University of Washington showing high and low ARID1A protein levels (left panel) and corresponding phospho-eEF2 (T56). n(ARID1A high)=26; n(ARID1A low)=15, t-test. (K) Representative images and quantification of MIBC obtained from the University of British Columbia showing high and low ARID1A protein levels (left panel) and corresponding phospho-eEF2 (T56). n(ARID1A high)=17; n(ARID1A low)=16, t-test. (L+M) Clinical staging and post-neoadjuvant chemotherapy pathologic staging of Figures 4J–K patients separated by ARID1A and p-eEF2 levels (n-low=31, n-high=43). Chi-square test. n.s. = not significant, scale bar = 100 μm, mean ± SEM. Also see Figure S4.
Figure 5.
Figure 5.. Pharmacologic inhibition of translation elongation initiation inhibits growth of ARID1A-deficient, but not proficient tumors.
(A) Mechanism of action of homoharringtonine (HHT). (B) WT and Arid1afl/fl tumor organoids cell viability after treatment with HHT (CellTiter-Glo 2.0). n≥3/genotype, t-test. (C) Cell viability of ARID1A proficient and deficient human bladder cancer cell lines treated with HHT. n=3/genotype, t-test. (D) Schematic of patient derived xenograft (PDX) model generation. Representative ARID1A IHC from PDX1 (ARID1A low), PDX2 (ARID1A medium) and PDX3 (ARID1A high) tumor tissues. (E-G) Tumor growth rate in PDX1, PDX2, and PDX3 models treated with HHT (0.7mg/kg; twice/day). n≥10/treatment arm. (H) HHT or vehicle (PBS) PDX1 Kaplan-Meier survival curve. n=10/arm, Logrank test. (I) Percent CC3 positive cells from the PDX1 group treated with HHT or vehicle (PBS). n=6/arm, t-test. (J) Percent Ki67 positive cells from the PDX1 group treated with HHT or vehicle (PBS). n=6/treatment arm, t-test. n.s. = not significant, mean ± SEM. Also see Figure S5.
Figure 6.
Figure 6.. ARID1A loss leads to a decrease in the translation of DNA damage response mRNAs.
(A) Volcano plot showing 278 translationally stalled mRNAs (orange dots, increased P/S ratio), which include Brca2, Ercc1, Ercc2, and Fancc (FDR<0.05). (B+C) Protein (replicate of 2) and mRNA (replicate of 3) levels of DNA damage response genes in WT and Arid1afl/fl urothelial cells. (D) Protein levels of DNA damage response genes in Arid1afl/fl and Arid1afl/fl;Eef2k−/− urothelial cells (replicate of 3). (E+F) γH2AX or CC3 staining and quantification in WT and Arid1afl/fl mice after tamoxifen administration followed by 9 days of BBN treatment. Urothelium is marked with red dotted lines. n≥4/genotype, t-test. (G) Representative comet assay showing increased DNA damage (tail length) in Arid1afl/fl organoids compared to WT organoids treated with BCPN. (H) Mass spectrometry measurements of urine BCPN in WT and Arid1afl/fl mice after 9 days of BBN treatment (n≥3/genotype). (I) Pie chart showing tumor outcome in WT and Arid1afl/fl mice treated with BBN for 150 days after ARID1A deletion (WT= 11 and Arid1afl/fl=12). (J) H&E of tumors from WT and Arid1afl/fl mice after 150 days of BBN treatment. Tumor area is marked with yellow dotted lines. WT=6 tumors and Arid1afl/fl=5 tumors, t-test. (K) ARID1A IHC of Arid1afl/fl tumors after tamoxifen followed by 150 days of BBN treatment (Figure 6I). Tumor area is marked with yellow dotted lines. n.s. = not significant, scale bar = 100 μm, mean ± SEM. Also see Figure S6.
Figure 7.
Figure 7.. Restoration of translation elongation is necessary to enable carcinogenesis in ARID1A-deficient urothelium.
(A+B) γH2AX and CC3 staining and quantification in Arid1afl/fl and Arid1afl/fl;Eef2k−/− mouse urothelium (outlined in red) after tamoxifen administration followed by 9 days of BBN treatment. n≥6/genotype, t-test. (C+D) γH2AX and CC3 staining and quantification in Arid1afl/fl mouse urothelium (outlined in red) after tamoxifen administration and pre-treatment with A-484954 followed by a 9-day BBN treatment. n≥4/ arm, t-test. (E) Tumor size after tamoxifen followed by 150 days of BBN treatment in Arid1afl/fl and Arid1afl/fl;Eef2k−/− mice. n≥6/genotype, t-test. (F) Percent ARID1A (+) cells in Arid1afl/fl and Arid1afl/fl;Eef2k−/− mice after tamoxifen followed by 150 days of BBN treatment. n≥6/genotype, t-test. (G) ARID1A IHC of Arid1afl/fl;Eef2k−/− tumors after tamoxifen followed by 150 days of BBN treatment. This demonstrates the presence of ARID1A-null tumors compared to Figure 6K. Scale bar = 100 μm, mean ± SEM. Also see Figure S7.

Similar articles

Cited by

References

    1. Marcel V, Ghayad SE, Belin S, Therizols G, Morel AP, Solano-Gonzalez E, Vendrell JA, Hacot S, Mertani HC, Albaret MA, et al. (2013). p53 acts as a safeguard of translational control by regulating fibrillarin and rRNA methylation in cancer. Cancer cell 24, 318–330. 10.1016/j.ccr.2013.08.013. - DOI - PMC - PubMed
    1. Hsieh AC, Liu Y, Edlind MP, Ingolia NT, Janes MR, Sher A, Shi EY, Stumpf CR, Christensen C, Bonham MJ, et al. (2012). The translational landscape of mTOR signalling steers cancer initiation and metastasis. Nature 485, 55–61. 10.1038/nature10912. - DOI - PMC - PubMed
    1. Faller WJ, Jackson TJ, Knight JR, Ridgway RA, Jamieson T, Karim SA, Jones C, Radulescu S, Huels DJ, Myant KB, et al. (2015). mTORC1-mediated translational elongation limits intestinal tumour initiation and growth. Nature 517, 497–500. 10.1038/nature13896. - DOI - PMC - PubMed
    1. Yang HS, Jansen AP, Komar AA, Zheng X, Merrick WC, Costes S, Lockett SJ, Sonenberg N, and Colburn NH (2003). The transformation suppressor Pdcd4 is a novel eukaryotic translation initiation factor 4A binding protein that inhibits translation. Mol Cell Biol 23, 26–37. 10.1128/mcb.23.1.26-37.2003. - DOI - PMC - PubMed
    1. Sun X, Wang SC, Wei Y, Luo X, Jia Y, Li L, Gopal P, Zhu M, Nassour I, Chuang JC, et al. (2017). Arid1a Has Context-Dependent Oncogenic and Tumor Suppressor Functions in Liver Cancer. Cancer cell 32, 574–589 e576. 10.1016/j.ccell.2017.10.007. - DOI - PMC - PubMed

Publication types