. 2023 Jul:73:101728.
doi: 10.1016/j.molmet.2023.101728. Epub 2023 Apr 19.

Non-alcoholic fatty liver disease is characterised by a reduced polyunsaturated fatty acid transport via free fatty acids and high-density lipoproteins (HDL)

Affiliations

Non-alcoholic fatty liver disease is characterised by a reduced polyunsaturated fatty acid transport via free fatty acids and high-density lipoproteins (HDL)

Gabriele Mocciaro et al. Mol Metab. 2023 Jul.

Abstract

Background and objectives: Non-alcoholic fatty liver disease (NAFLD) develops due to impaired hepatic lipid fluxes and is a risk factor for chronic liver disease and atherosclerosis. Lipidomic studies consistently reported characteristic hepatic/VLDL "lipid signatures" in NAFLD; whole plasma traits are more debated. Surprisingly, the HDL lipid composition by mass spectrometry has not been characterised across the NAFLD spectrum, despite HDL being a possible source of hepatic lipids delivered from peripheral tissues alongside free fatty acids (FFA). This study characterises the HDL lipidomic signature in NAFLD, and its correlation with metabolic and liver disease markers.

Methods: We used liquid chromatography-mass spectrometry to determine the whole serum and HDL lipidomic profile in 89 biopsy-proven NAFLD patients and 20 sex and age-matched controls.

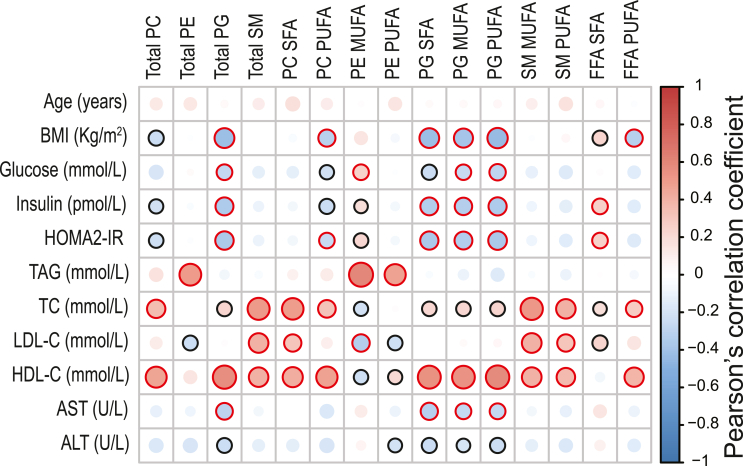
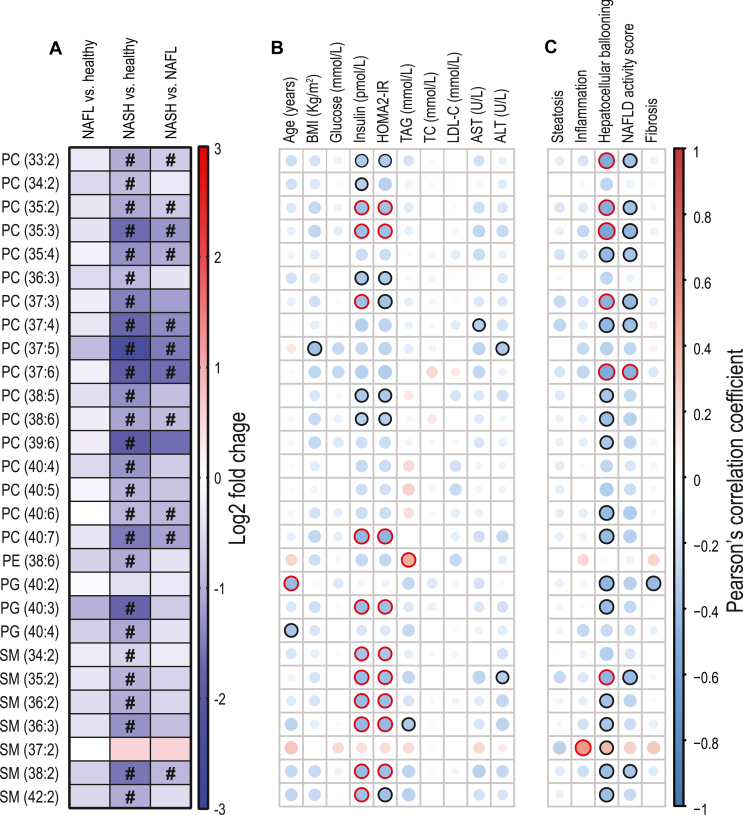
Results: In the whole serum of NAFLD versus controls, we report a depletion in polyunsaturated (PUFA) phospholipids (PL) and FFA; with PUFA PL being also lower in HDL, and negatively correlated with BMI, insulin resistance, triglycerides, and hepatocyte ballooning. In the HDL of the NAFLD group we also describe higher saturated ceramides, which positively correlate with insulin resistance and transaminases.

Conclusion: NAFLD features lower serum lipid species containing polyunsaturated fatty acids; the most affected lipid fractions are FFA and (HDL) phospholipids; our data suggest a possible defect in the transfer of PUFA from peripheral tissues to the liver in NAFLD. Mechanistic studies are required to explore the biological implications of our findings addressing if HDL composition can influence liver metabolism and damage, thus contributing to NAFLD pathophysiology.

Keywords: LC-MS; Lipidomics; Lipoprotein metabolism; Non-alcoholic fatty liver disease (NAFLD); Obesity.


Figures

Image 1
Changes in HDL and FFA composition occurring in NAFLD.
Figure 1
Figure 1
Whole serum levels of major lipid classes in healthy volunteers and NAFLD patients. (A,B) PC, (C,D) PE, (E,F) PG, (G,H) SM were lower across the NAFLD spectrum compared to controls. (I,J) FFA were higher in SFA and lower in PUFA in NAFLD as compared to controls. All lipid species were analysed by LC-MS. Statistical significance was assessed using three-way ANOVA controlling for sex, presence of type 2 diabetes mellitus (T2DM) and interaction between sex, T2DM and disease state, with a p-value <0.05 considered significant. Tukey HSD post hoc test was used to estimate the statistical significance among groups. Lowercase red letters indicate post hoc analysis significance: “a” means different from controls “CTRL”, and “b” means different from NAFL. Data are represented as mean ± standard deviation; expression data of participants are represented as dot plots. In Supplementary Table 2 are reported all the specific lipid species analysed. Abbreviations: PC, phosphatidylcholines; PE, phosphatidylethanolamines; PG, phosphatidylglycerols; SM, sphingomyelins; FFA, free fatty acids; SFA, saturated fatty acids; MUFA, monounsaturated fatty acids; PUFA, polyunsaturated fatty acids.
Figure 2
Figure 2
Correlations between significant whole-serum lipid species and clinical data. Heatmap representing a correlation matrix among significantly different whole serum lipid species and clinical data in healthy volunteers and NAFLD patients: colour represents the Pearson correlation coefficient (red: positive; blue: negative), and the size of the circle represents significance (black bold borders highlight correlations with p < 0.05; red bold borders highlight correlations with p < 0.01). Abbreviations: PC, phosphatidylcholines; PE, phosphatidylethanolamines; PG, phosphatidylglycerols; SM, sphingomyelins; FFA, free fatty acids; SFA, saturated fatty acids; MUFA, monounsaturated fatty acids; PUFA, polyunsaturated fatty acids; BMI, body mass index; HOMA2-IR, Homeostasis Model Assessment 2 of Insulin Resistance; TAG, triglycerides; TC, total cholesterol; LDL-C, low-density lipoprotein cholesterol; HDL-C, high-density lipoprotein cholesterol; AST, aspartate aminotransaminase; ALT, alanine aminotransaminase.
Figure 3
Figure 3
HDL levels of major lipid classes in healthy volunteers and NAFLD patients, and their correlation with clinical and liver histological data. (A,B) PC were lower in NAFLD as compared to controls. (C–-E) SM and PG were lower across the NAFLD spectrum as compared to controls. (F,G) Total and SFA Cer were higher in NASH compared to controls. Statistical significance was assessed using two-way ANOVA controlling for presence of type 2 diabetes mellitus (T2DM) and interaction between T2DM and disease state, with a p-value <0.05 considered significant. Tukey HSD post hoc test was used to estimate the statistical significance among groups. Lowercase red letters indicate post hoc analysis significance: “a” means different from controls “CTRL”, and “b” means different from NAFL. Data are represented as mean ± standard deviation; expression data of participants are represented as dot plots. In Supplementary Table 6 are reported all the specific lipid species analysed within the HDL fraction. (H) Heatmap representing a correlation matrix among significantly different HDL lipid species and clinical data in healthy volunteers and NAFLD patients: colour represents the Pearson correlation coefficient (red: positive; blue: negative), and the size of the circle represents significance (black bold borders highlight correlations with p < 0.05; red bold borders highlight correlations with p < 0.01). (I) Heatmap representing a correlation matrix among significantly different HDL lipid species and liver histological data in NAFLD patients (n = 31): colour represents the Pearson correlation coefficient (red: positive; blue: negative), and the size of the circle represents significance (black bold borders highlight correlations with p < 0.05; red bold borders highlight correlations with p < 0.01). All lipid species were analysed by LC-MS and normalised to its internal standard (IS) as with whole serum (list of IS used reported in the method section), in addition to the ApoA-I concentration (Supplementary Fig. 2). Abbreviations: PC, phosphatidylcholines; SM, sphingomyelins; PG, phosphatidylglycerols; Cer, ceramides; SFA, saturated fatty acids; MUFA, monounsaturated fatty acids; PUFA, polyunsaturated fatty acids.
Figure 4
Figure 4
Significantly lower PUFA-containing phospholipids within HDL, and their correlations with clinical and liver histological data. (A) Log2 fold change among the significantly different HDL PUFA in healthy volunteers (CTRL) versus NAFLD patients, with “#” indicating a Tukey HSD post hoc significant difference p < 0.05 (details in Supplementary Table 6). (B) Heatmap representing a correlation matrix among significantly different HDL PUFA species and clinical data in healthy volunteers and NAFLD patients: colour represents the Pearson correlation coefficient (red: positive; blue: negative), and the size of the circle represents significance (black bold borders highlight correlations with p < 0.05; red bold borders highlight correlations with p < 0.01). (C) Heatmap representing a correlation matrix among significantly different HDL PUFA species and liver histological data in NAFLD patients (n = 31): colour represents the Pearson correlation coefficient (red: positive; blue: negative), and the size of the circle represents significance (black bold borders highlight correlations with p < 0.05; red bold borders highlight correlations with p < 0.01). Abbreviations: PC, phosphatidylcholine; PE, phosphatidylethanolamine; PG, phosphatidylglycerol; SM, sphingomyelin; SFA, saturated fatty acids; MUFA, monounsaturated fatty acids; PUFA, polyunsaturated fatty acids; BMI, body mass index; HOMA2-IR, Homeostasis Model Assessment 2 of Insulin Resistance; TAG, triglycerides; TC, total cholesterol; LDL-C, low-density lipoprotein cholesterol; AST, aspartate aminotransaminase; ALT, alanine aminotransaminase.

References

    1. Azzu V., Vacca M., Virtue S., Allison M., Vidal-Puig A. Adipose tissue-liver cross talk in the control of whole-body metabolism: implications in nonalcoholic fatty liver disease. Gastroenterology. 2020;158(7):1899–1912. - PubMed
    1. Younossi Z., Anstee Q.M., Marietti M., Hardy T., Henry L., Eslam M., et al. Global burden of NAFLD and NASH: trends, predictions, risk factors and prevention. Nat Rev Gastroenterol Hepatol. 2018;15(1):11–20. - PubMed
    1. Younossi Z.M., Koenig A.B., Abdelatif D., Fazel Y., Henry L., Wymer M. Global epidemiology of nonalcoholic fatty liver disease-Meta-analytic assessment of prevalence, incidence, and outcomes. Hepatology. 2016;64(1):73–84. - PubMed
    1. Targher G., Byrne C.D., Tilg H. NAFLD and increased risk of cardiovascular disease: clinical associations, pathophysiological mechanisms and pharmacological implications. Gut. 2020;69(9):1691–1705. - PubMed
    1. Mantovani A., Csermely A., Petracca G., Beatrice G., Corey K.E., Simon T.G., et al. Non-alcoholic fatty liver disease and risk of fatal and non-fatal cardiovascular events: an updated systematic review and meta-analysis. Lancet Gastroenterol Hepatol. 2021;6(11):903–913. - PubMed

Publication types