

Consensus guide on CT-based prediction of stopping-power ratio using a Hounsfield look-up table for proton therapy
- PMID: 37084884
- PMCID: PMC10351362
- DOI: 10.1016/j.radonc.2023.109675
Consensus guide on CT-based prediction of stopping-power ratio using a Hounsfield look-up table for proton therapy
Abstract
Background and purpose: Studies have shown large variations in stopping-power ratio (SPR) prediction from computed tomography (CT) across European proton centres. To standardise this process, a step-by-step guide on specifying a Hounsfield look-up table (HLUT) is presented here.
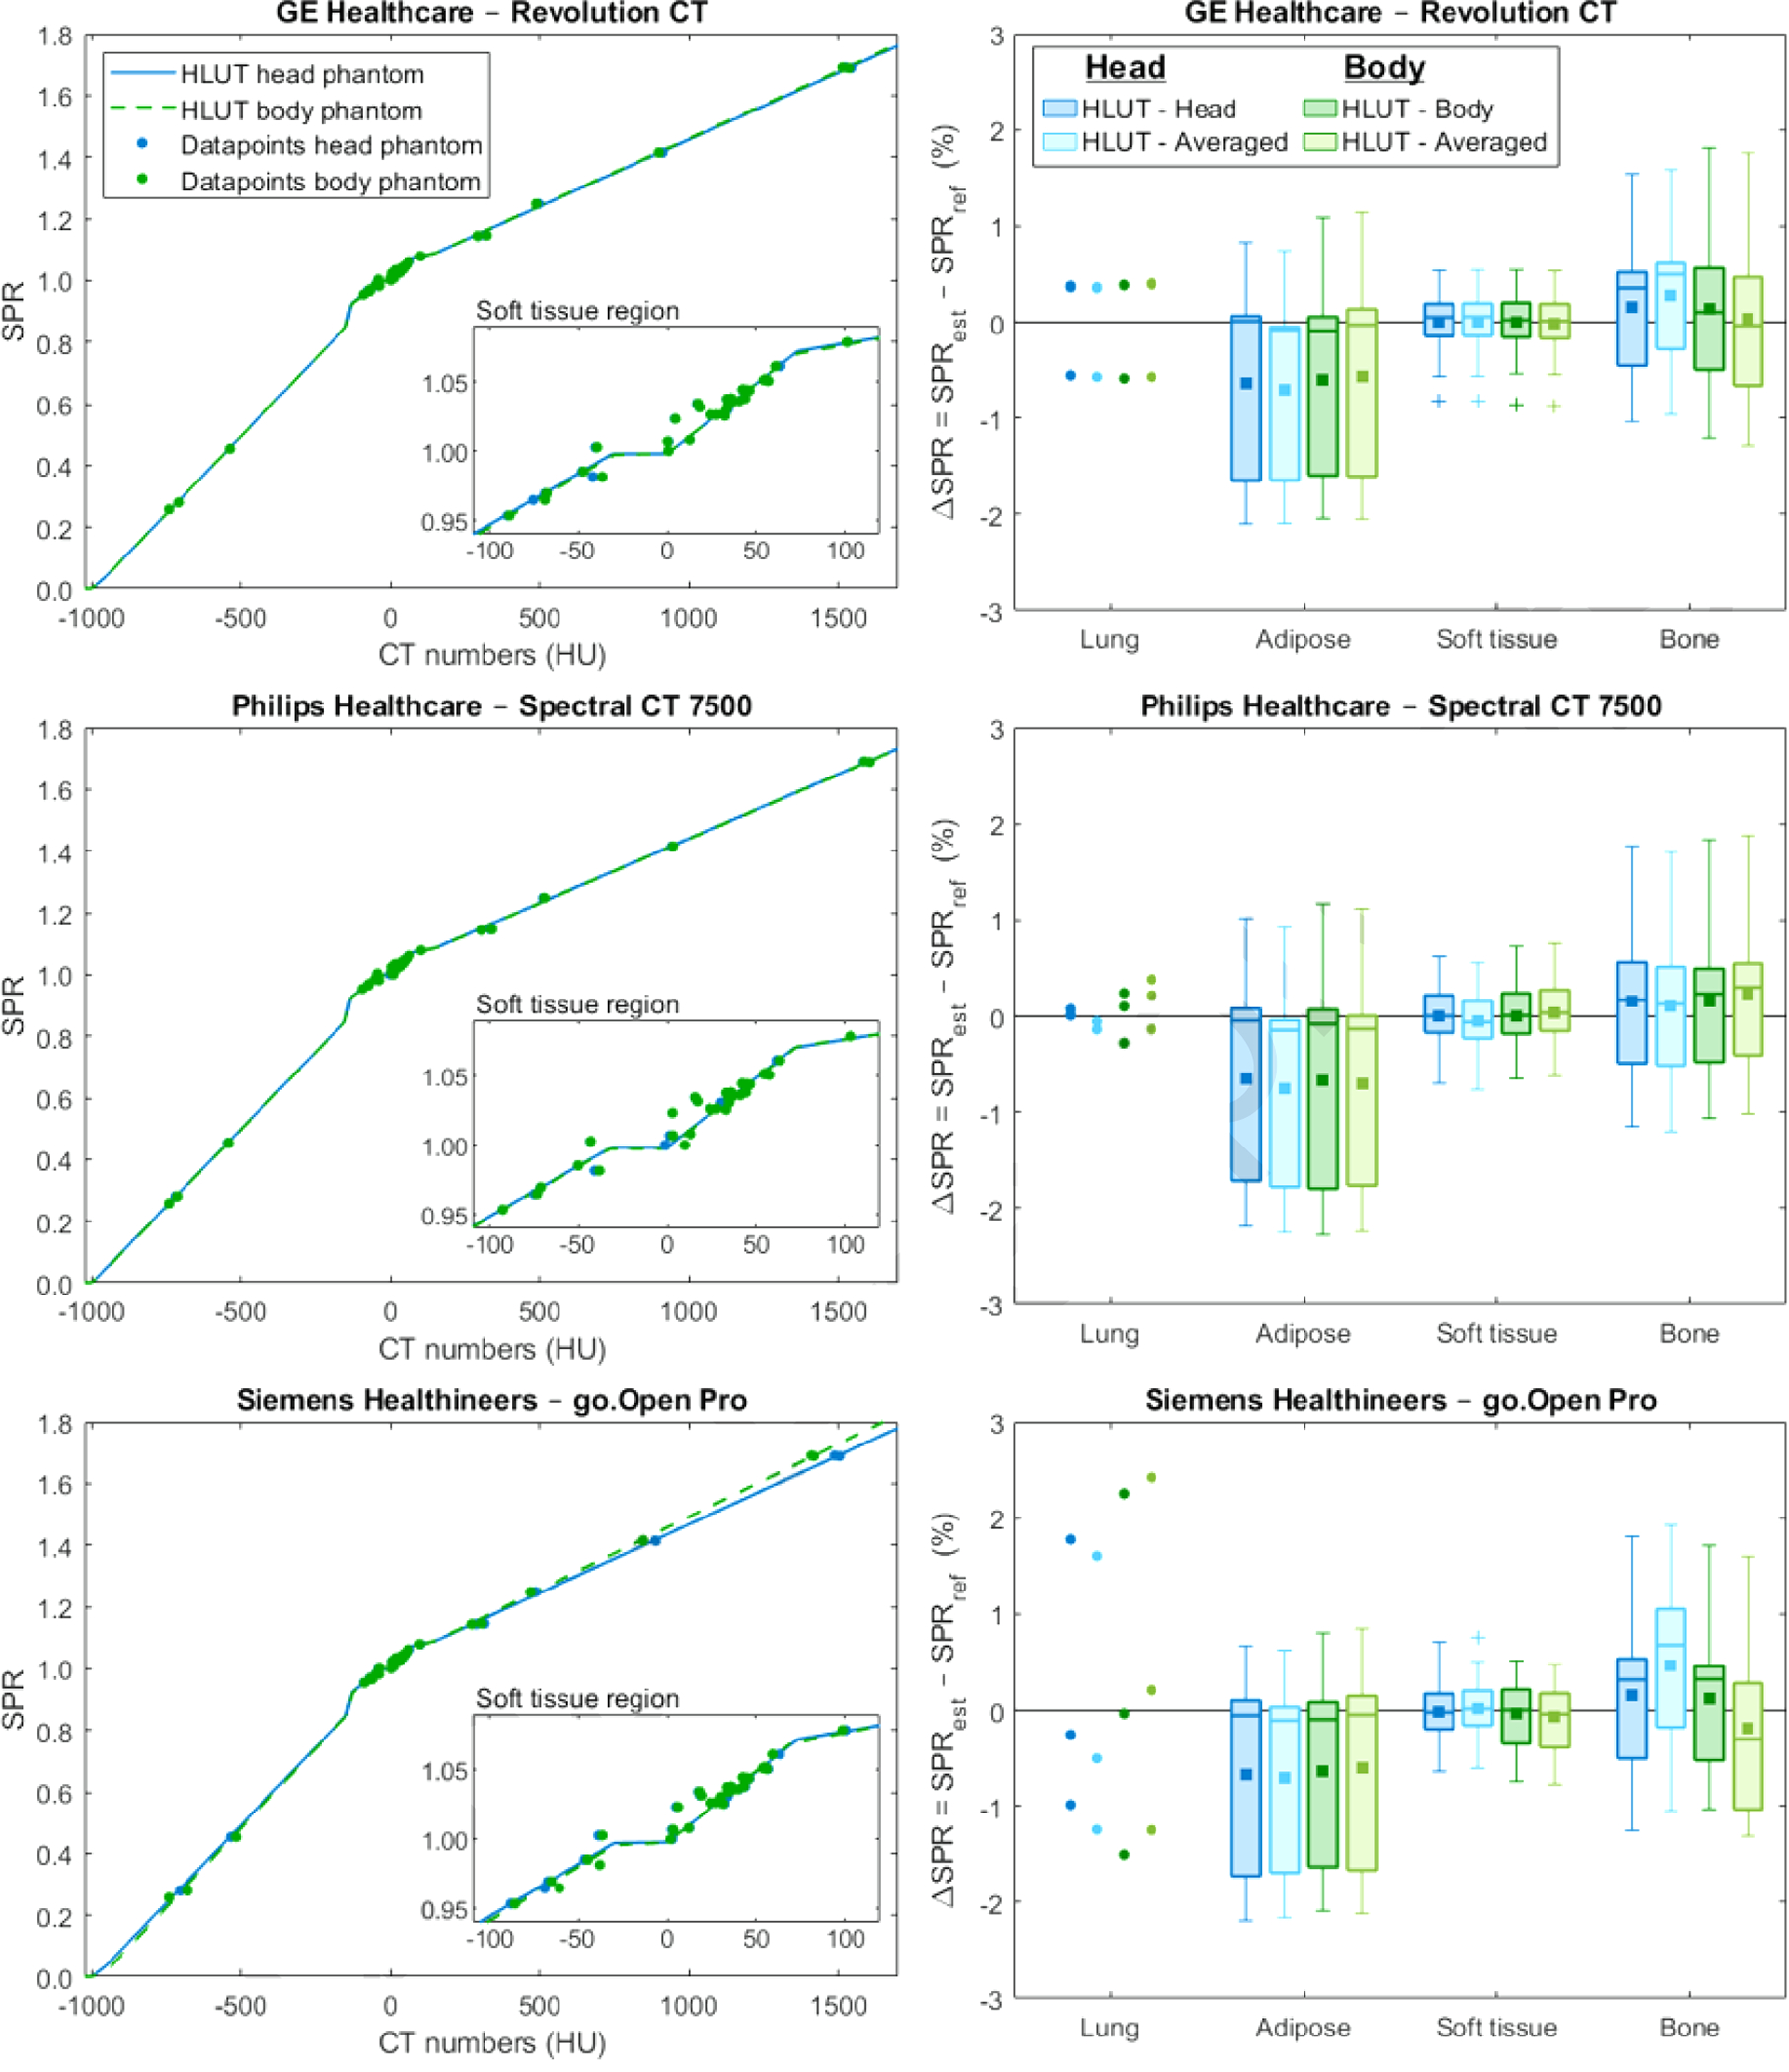
Materials and methods: The HLUT specification process is divided into six steps: Phantom setup, CT acquisition, CT number extraction, SPR determination, HLUT specification, and HLUT validation. Appropriate CT phantoms have a head- and body-sized part, with tissue-equivalent inserts in regard to X-ray and proton interactions. CT numbers are extracted from a region-of-interest covering the inner 70% of each insert in-plane and several axial CT slices in scan direction. For optimal HLUT specification, the SPR of phantom inserts is measured in a proton beam and the SPR of tabulated human tissues is computed stoichiometrically at 100 MeV. Including both phantom inserts and tabulated human tissues increases HLUT stability. Piecewise linear regressions are performed between CT numbers and SPRs for four tissue groups (lung, adipose, soft tissue, and bone) and then connected with straight lines. Finally, a thorough but simple validation is performed.
Results: The best practices and individual challenges are explained comprehensively for each step. A well-defined strategy for specifying the connection points between the individual line segments of the HLUT is presented. The guide was tested exemplarily on three CT scanners from different vendors, proving its feasibility.
Conclusion: The presented step-by-step guide for CT-based HLUT specification with recommendations and examples can contribute to reduce inter-centre variations in SPR prediction.
Keywords: Hounsfield look-up table; Proton range prediction; Proton therapy; Single-energy CT; Stoichiometric calibration; Stopping-power ratio.
Copyright © 2023 The Authors. Published by Elsevier B.V. All rights reserved.
Conflict of interest statement
Declaration of Competing Interest The authors declare that they have no known competing financial interests or personal relationships that could have appeared to influence the work reported in this paper.
Figures

References
Publication types
MeSH terms
Substances
Grants and funding
LinkOut - more resources
Full Text Sources
