. 2023 May 24;43(21):3860-3875.
doi: 10.1523/JNEUROSCI.1451-22.2023. Epub 2023 Apr 21.

Perceptual History Biases Are Predicted by Early Visual-Evoked Activity

Affiliations

Perceptual History Biases Are Predicted by Early Visual-Evoked Activity

Michele Fornaciai et al. J Neurosci. .

Abstract

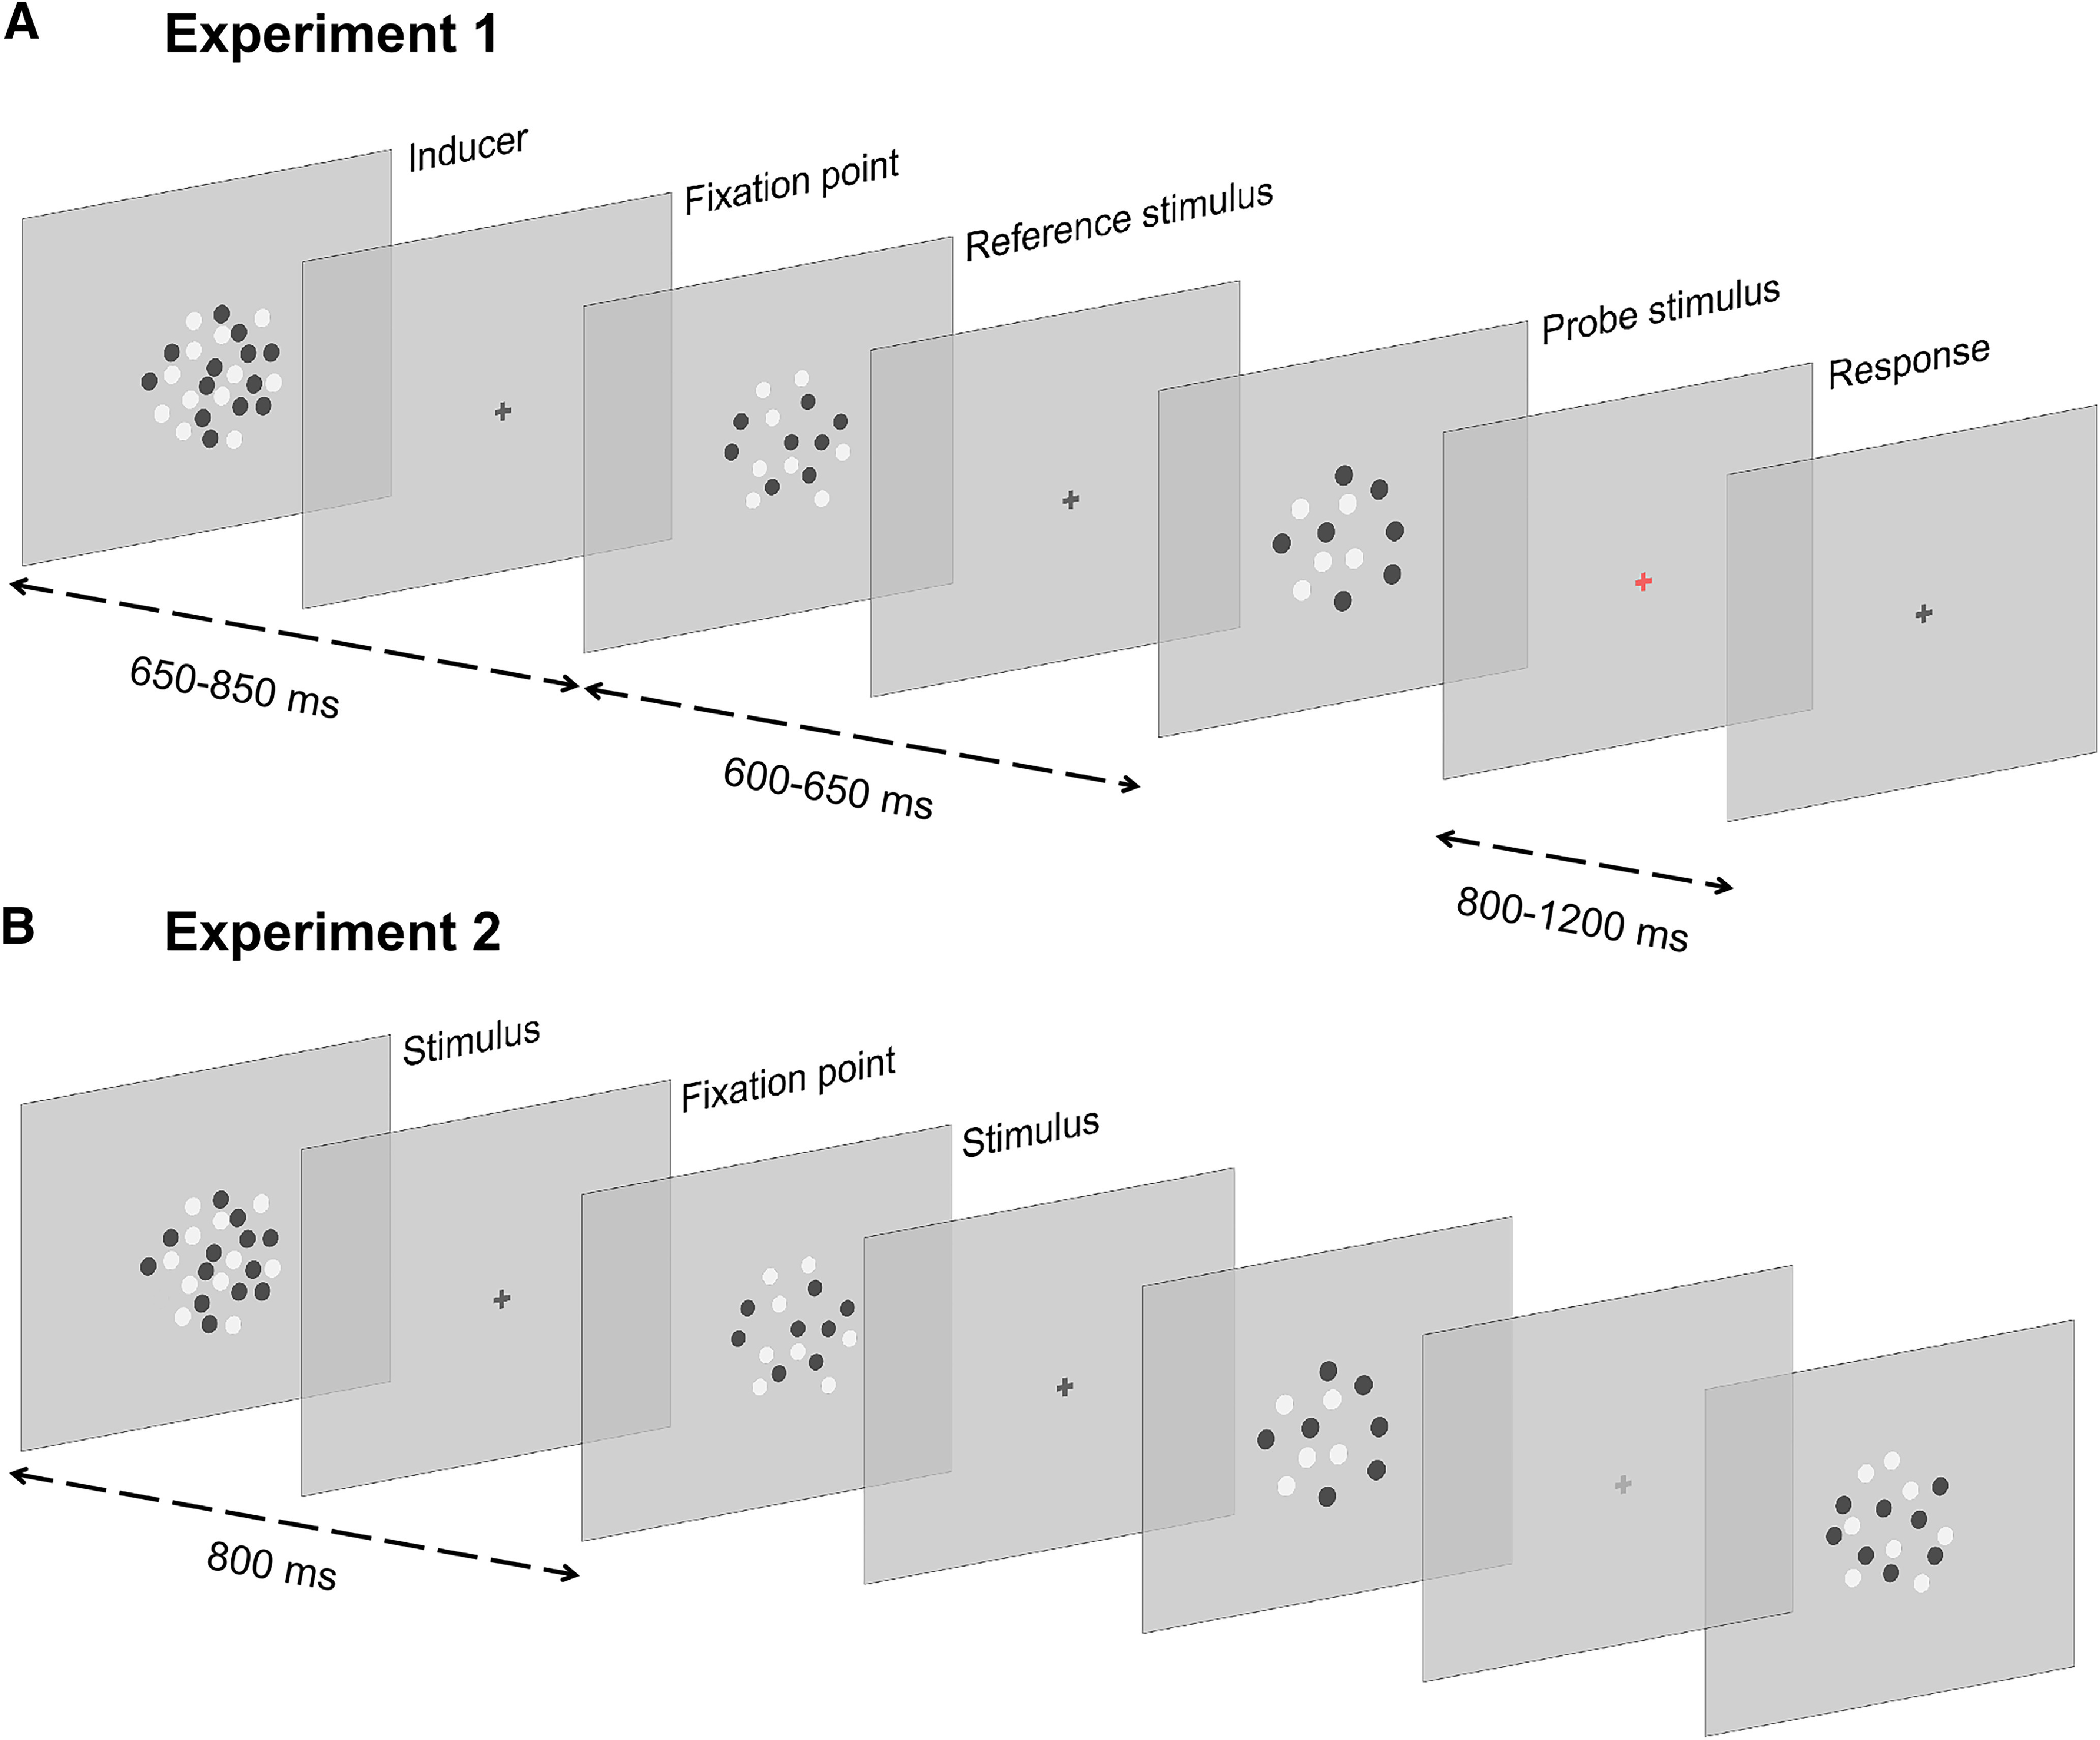
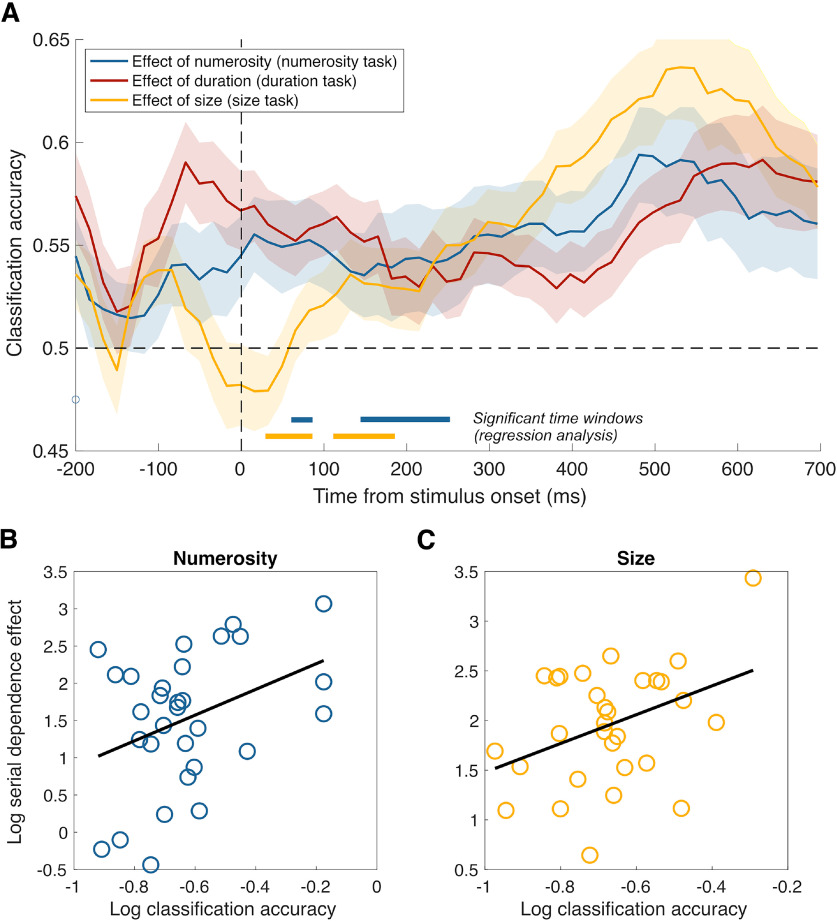
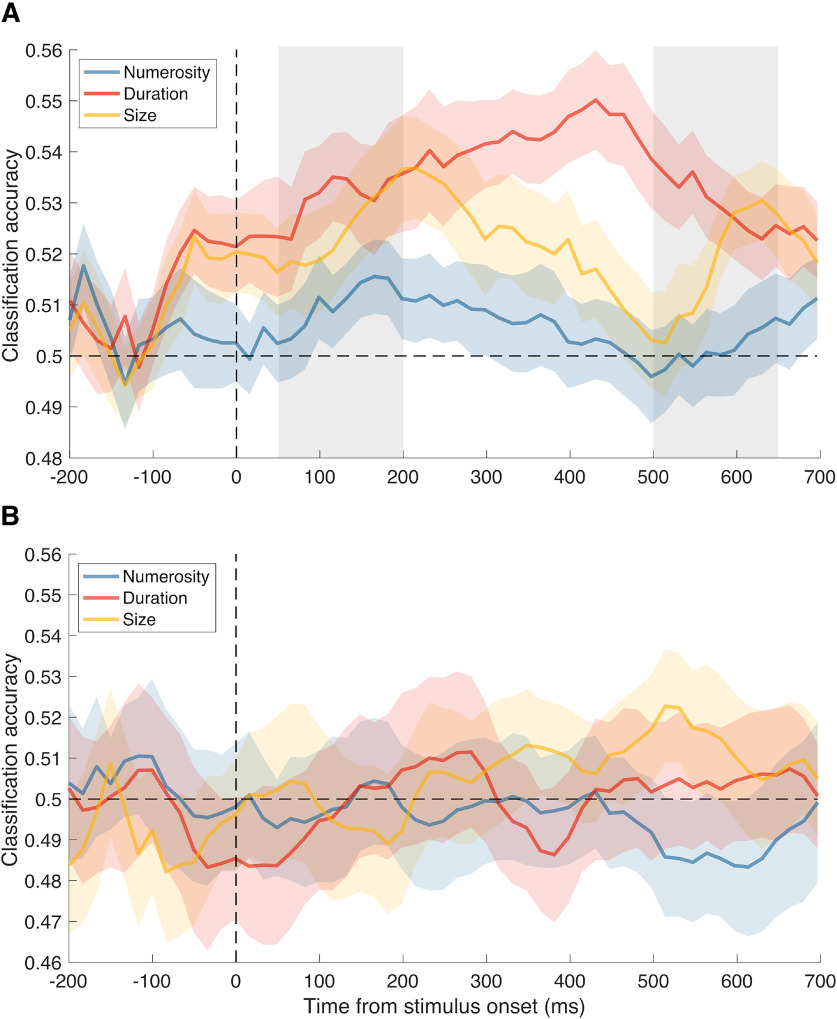
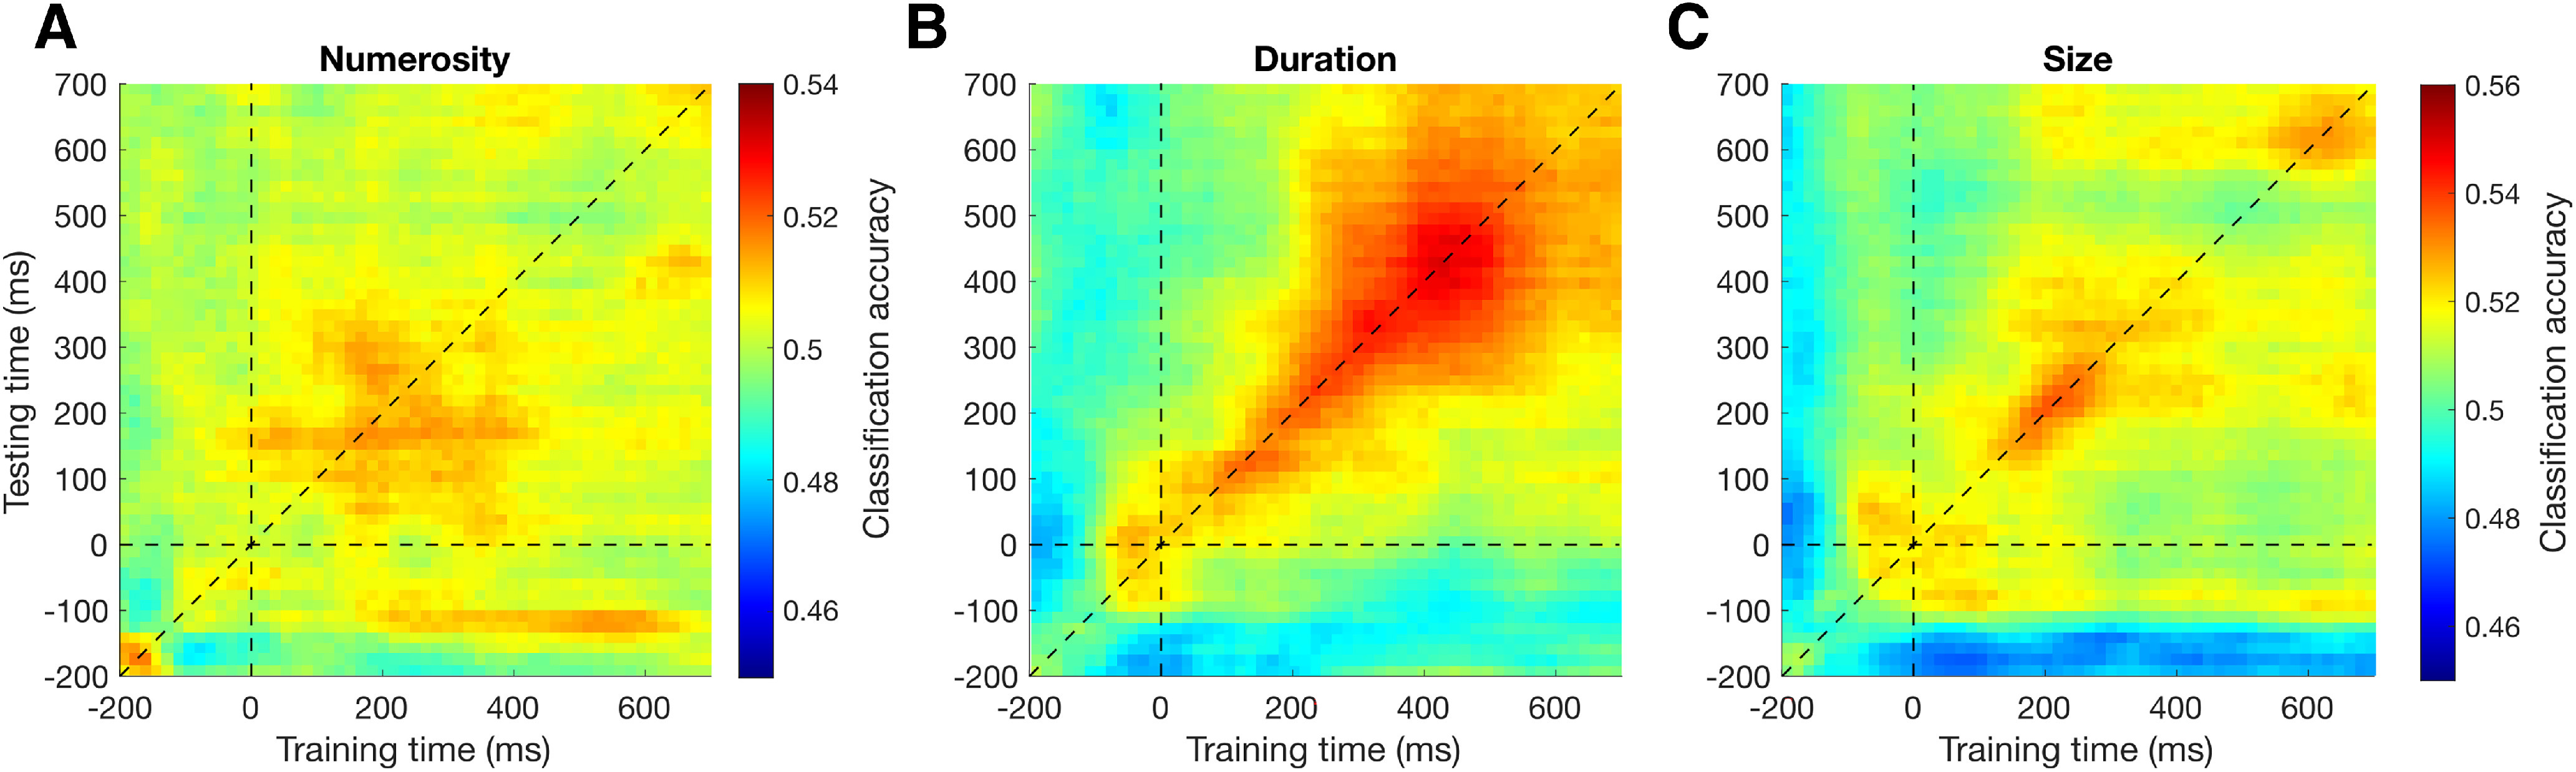
What we see in the present is affected by what we saw in the recent past. Serial dependence, a bias making a current stimulus appear more similar to a previous one, has been indeed shown to be ubiquitous in vision. At the neural level, serial dependence is accompanied by a signature of stimulus history (i.e., past stimulus information) emerging from early visual-evoked activity. However, whether this neural signature effectively reflects the behavioral bias is unclear. Here we address this question by assessing the neural (electrophysiological) and behavioral signature of stimulus history in human subjects (both male and female), in the context of numerosity, duration, and size perception. First, our results show that while the behavioral effect is task-dependent, its neural signature also reflects task-irrelevant dimensions of a past stimulus, suggesting a partial dissociation between the mechanisms mediating the encoding of stimulus history and the behavioral bias itself. Second, we show that performing a task is not a necessary condition to observe the neural signature of stimulus history, but that in the presence of an active task such a signature is significantly amplified. Finally, and more importantly, we show that the pattern of brain activity in a relatively early latency window (starting at ∼35-65 ms after stimulus onset) significantly predicts the behavioral effect. Overall, our results thus demonstrate that the encoding of past stimulus information in neural signals does indeed reflect serial dependence, and that serial dependence occurs at a relatively early level of visual processing.SIGNIFICANCE STATEMENT What we perceive is determined not only by the information reaching our sensory organs, but also by the context in which the information is embedded. What we saw in the recent past (perceptual history) can indeed modulate the perception of a current stimulus in an attractive way, a bias that is ubiquitous in vision. Here we show that this bias can be predicted by the pattern of brain activity reflecting the encoding of past stimulus information, very early after the onset of a stimulus. This in turn suggests that the integration of past and present sensory information mediating the attractive bias occurs early in the visual processing stream, and likely involves early visual cortices.

Keywords: EEG; magnitude perception; perceptual history; serial dependence.


Figures

Figure 1.
Figure 1.
Experimental procedure. A, Stimulation procedure used in Experiment 1. In Experiment 1, participants performed a numerosity, duration, or size discrimination task, in separate sessions. In each trial, we presented a sequence of three dot-array stimuli modulated in numerosity, duration, and dot size: a task-irrelevant “inducer” (either 12 or 24 dots, 140 or 280 ms, 4 or 8 pixels), a constant reference (always 16 dots/200 ms/6 pixels), and a variable probe (varying in numerosity, duration, or dot size according to the task). At the end of each trial, participants reported which stimulus between the reference and the probe contained more dots, lasted longer in time, or had bigger dots (for the numerosity, duration, and size task, respectively). B, In Experiment 2, we used a passive viewing paradigm. Participants watched a stream of dot-array stimuli modulated in numerosity, duration, and dot size. Each stimulus, comprised of 12, 16, or 24 dots, was presented for 140, 200, or 280 ms, and included items with size of 4, 6, or 8 pixels. Participants were instructed to attend the sequence and respond to occasional oddball stimuli defined by a lower contrast. Stimuli are not depicted in scale.
Figure 2.
Figure 2.
Behavioral results of Experiment 1. A, Behavioral results in terms of point of subjective equality (PSE; i.e., representing accuracy in the task and the perceived magnitude of the reference) as a function of different inducer magnitudes, limited to the task-relevant magnitude. B, Average serial dependence effect indexes computed as the normalized difference between PSEs in the two corresponding inducer conditions, transformed into percentage. C, Effect of the different inducer magnitudes on behavioral performance, computed with a nonlinear regression analysis (i.e., contribution of different inducer magnitudes to the behavioral response in each trial). In this analysis, positive β values indicate an attractive effect (i.e., increased chance of responding “reference bigger” as the inducer magnitude increases), and negative results indicate a repulsive (opposite) effect. Error bars indicate SEM.
Figure 3.
Figure 3.
Average classification accuracy (CA) in Experiment 1. CA obtained in the multivariate analysis, showing the signature of the three magnitude dimensions of the inducer decoded from the EEG responses evoked by the reference, averaged across the three task conditions. The CA shown here reflects the ability of a classifier (support vector machine) to successfully classify the pattern of brain activity across multiple EEG channels evoked by the reference, according to the inducer magnitude (i.e., low vs high inducer numerosity, for example). Such procedure was repeated across several 100 ms time windows throughout an epoch (−200:700 ms) time-locked to the reference onset. A, CA obtained in the actual decoding analysis. Gray shaded areas represent the two latency windows selected to perform further analyses (50-200 ms and 500-650 ms). B, CA obtained in the “null” decoding analysis performed as a control and to determine the chance level empirically. Vertical dashed line indicates the onset of the reference stimulus. Horizontal dashed line indicates the level of 50% accuracy. Colored shaded areas represent the SEM.
Figure 4.
Figure 4.
Decoding results of Experiment 1 at early and late latencies. A, Average classification accuracies (CA) at the early latency window (50–200 ms), corresponding to the effect of inducer numerosity, duration, and size across the three task conditions (from the left to the right panel: numerosity, duration, and size task). B, Average CA in the three task conditions at the late latency window (500-650 ms). The dotted line at each bar indicates the empirical chance level computed from the null decoding analysis. C, CA corresponding to the effect of numerosity, duration, and size at the early latency window, averaged across the three tasks. D, CA at the late latency window, averaged across the three tasks. Error bars indicate SEM. *p < 0.05.
Figure 5.
Figure 5.
Average temporal generalization matrices in Experiment 1. The temporal generalization matrices are obtained by training and testing the classifier with brain activity at different latencies, to show the extent to which a given pattern of brain activity generalizes to later latencies. A, Temporal generalization matrix concerning the effect of inducer numerosity, averaged across task conditions. B, Temporal generalization matrix concerning the effect of duration. C, Temporal generalization matrix concerning the effect of size. Horizontal and vertical dashed lines indicate the off-diagonal generalization direction corresponding to the reference onset. The diagonal dashed line indicates the training and testing of the classifier at the same latency. The classification accuracies shown in Figure 3A correspond to the diagonal of the temporal generalization matrices.
Figure 6.
Figure 6.
Classification accuracies (CA) of the task-relevant dimensions in the three task conditions. A, Pattern of CA obtained from the decoding of the magnitude dimension of the inducer consistent with the task performed, in the three task conditions. Lines at the bottom of the plot indicate the significant time windows observed in the regression analysis, showing the latency windows at which the behavioral effect could be predicted from CA. Shaded areas represent SEM. B, Log-scaled CA plotted against the serial dependence effect, in the numerosity task condition. C, Log-scaled CA plotted against the serial dependence effect, in the size task condition. Black lines indicate linear fit to the data.
Figure 7.
Figure 7.
Average classification accuracy (CA) in Experiment 2. In Experiment 2, participants passively watched a stream of dot-array stimuli that were concurrently modulated in numerosity, duration, and dot size in a trial-by-trial fashion. In the multivariate decoding procedure, in different iterations of the analysis, we pooled all the stimuli with the intermediate level of either numerosity, duration, or dot size (named “current” magnitude in the description of the results), and decoded the signature of the preceding stimulus by contrasting trials in which the previous stimulus had a lower magnitude (i.e., either 12 dots, 140 ms, or 4 pixels, to assess the effect of numerosity, duration, or dot size, respectively; named “past” magnitude) against trials in which the previous stimulus had a larger magnitude (i.e., 24 dots, 280 ms, or 8 pixels). The decoding was thus performed by considering the activity time-locked to an identical stimulus with an intermediate magnitude level, differing only in the magnitude of the preceding stimulus, similarly to the procedure used in Experiment 1. A, CA observed in the actual decoding analysis, corresponding to the different magnitudes of the past stimulus. Two gray shaded areas represent the latency windows selected to perform data analysis, as in Experiment 1. B, CA obtained in the null decoding analysis, serving as a control and to determine the chance level empirically. Vertical dashed lines indicate the onset of the reference stimulus. Horizontal dashed lines indicate the level of 50% accuracy. Colored shaded areas represent the SEM.
Figure 8.
Figure 8.
Decoding results of Experiment 2 at early and late latencies. A, B, For each magnitude dimension of the current stimulus (i.e., “current magnitude,” different subplots), we plotted the classification accuracy (CA) of the “past” magnitude in the early (A, 50-200 ms) and late (B, 500-650 ms) latency window. Namely, from left to right, bars represent the CA corresponding to the effect of numerosity (blue), duration (red), and size (yellow) of the past stimulus on the numerosity (leftmost panel), duration (middle panel), and size of the current stimulus (rightmost panel). Dotted lines shown at each bar indicate the empirical chance level computed from the null decoding analysis. C, Average effect of the magnitudes of the previous stimulus on the current one in the early latency window, collapsing together the different magnitudes of the current stimulus. D, Average effects of different magnitudes in the late latency window. Error bars indicate SEM. *p < 0.05.
Figure 9.
Figure 9.
Temporal generalization matrices of Experiment 2. A, Temporal generalization matrix concerning the effect of the numerosity of the past stimulus. B, Temporal generalization matrix concerning the effect of duration. C, Temporal generalization matrix concerning the effect of size. Horizontal and vertical dashed lines indicate the off-diagonal generalization direction corresponding to the current stimulus onset. The diagonal dashed line indicates the training and testing of the classifier at the same latency. The classification accuracies shown in Figure 7A correspond to the diagonal of the temporal generalization matrices.
Figure 10.
Figure 10.
Comparison between Experiments 1 and 2. A, Average classification accuracy (CA) across all the conditions and dimensions tested in Experiment 1. The results of Experiment 1 show that, while a signature of the inducer magnitude information is on average measurable from neural signals very early after the reference stimulus onset (50-200 ms), such a signature is strongly amplified at later latencies (500-650 ms). B, Average CA obtained in Experiment 2. Although significantly higher than chance level (0.5), in Experiment 2 the decoding performance shows an overall weaker encoding (lower CA) of the inducer magnitudes during reference processing, compared with Experiment 1. At the late latency window, no amplification of these signals was observed. Error bars indicate SEM.

Similar articles

Cited by

References

    1. Alais D, Leung J, Van der Burg E (2017) Linear summation of repulsive and attractive serial dependencies: orientation and motion dependencies sum in motion perception. J Neurosci 37:4381–4390. 10.1523/JNEUROSCI.4601-15.2017 - DOI - PMC - PubMed
    1. Bliss DP, Sun JJ, D'Esposito M (2017) Serial dependence is absent at the time of perception but increases in visual working memory. Sci Rep 7:14739. 10.1038/s41598-017-15199-7 - DOI - PMC - PubMed
    1. Bocincova A, Johnson JS (2019) The time course of encoding and maintenance of task-relevant versus irrelevant object features in working memory. Cortex 111:196–209. 10.1016/j.cortex.2018.10.013 - DOI - PMC - PubMed
    1. Burr D, Cicchini GM (2014) Vision: efficient adaptive coding. Curr Biol 24:R1096–R1098. 10.1016/j.cub.2014.10.002 - DOI - PMC - PubMed
    1. Cicchini GM, Anobile G, Burr DC (2014) Compressive mapping of number to space reflects dynamic encoding mechanisms, not static logarithmic transform. Proc Natl Acad Sci USA 111:7867–7872. 10.1073/pnas.1402785111 - DOI - PMC - PubMed

Publication types

LinkOut - more resources