. 2023 Apr 21;14(1):2303.
doi: 10.1038/s41467-023-38026-2.

Control of a hippocampal recurrent excitatory circuit by cannabinoid receptor-interacting protein Gap43

Affiliations

Control of a hippocampal recurrent excitatory circuit by cannabinoid receptor-interacting protein Gap43

Irene B Maroto et al. Nat Commun. .

Abstract

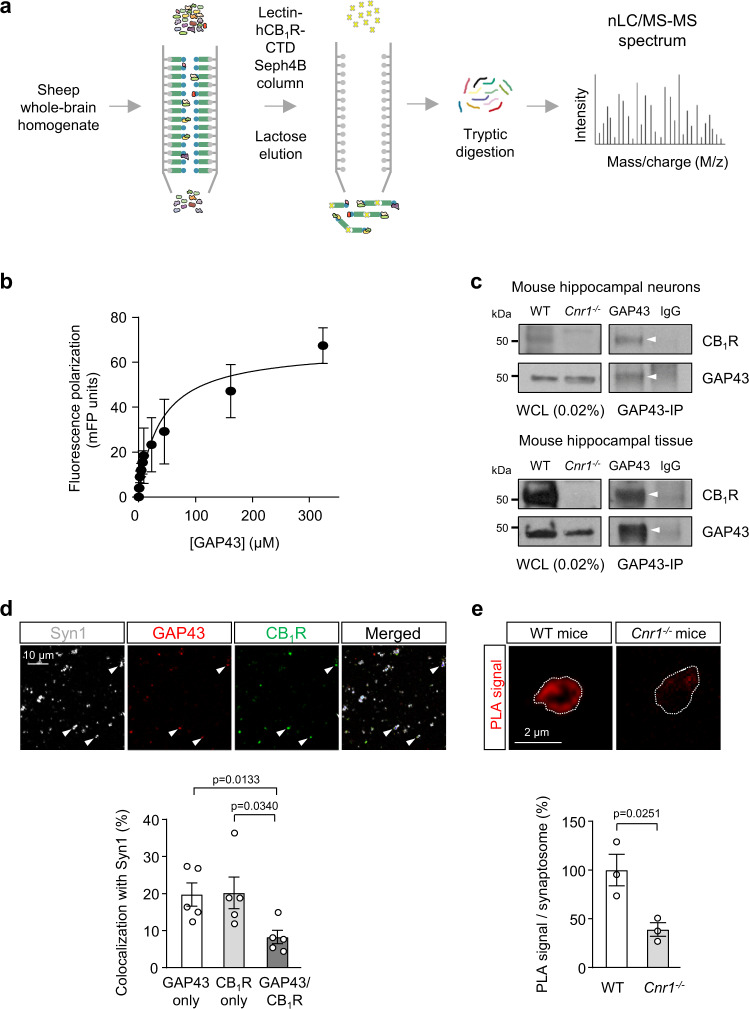
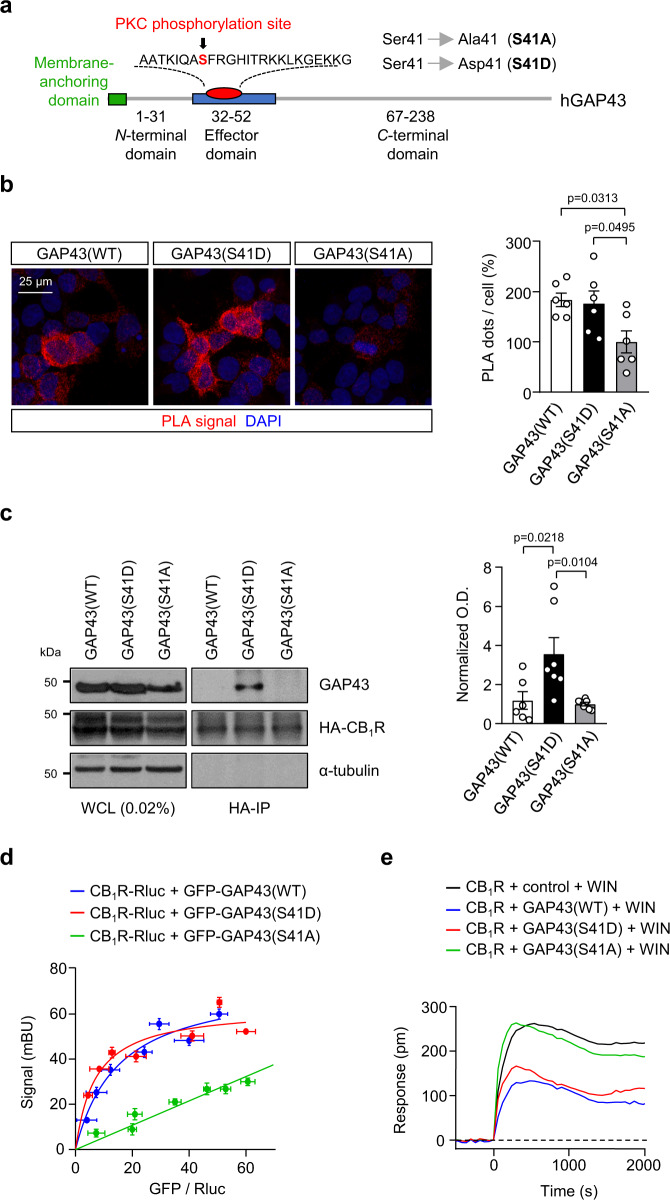
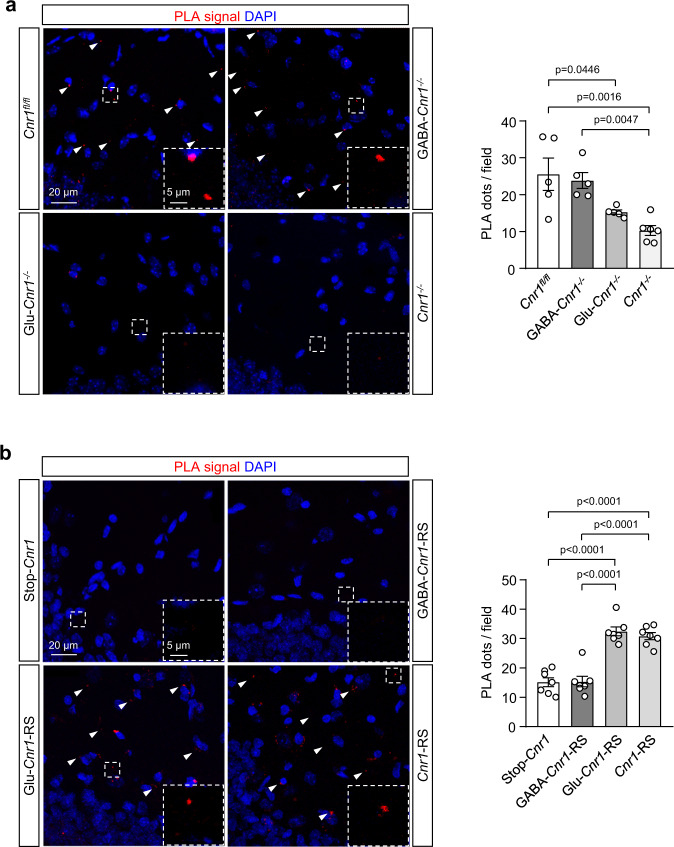
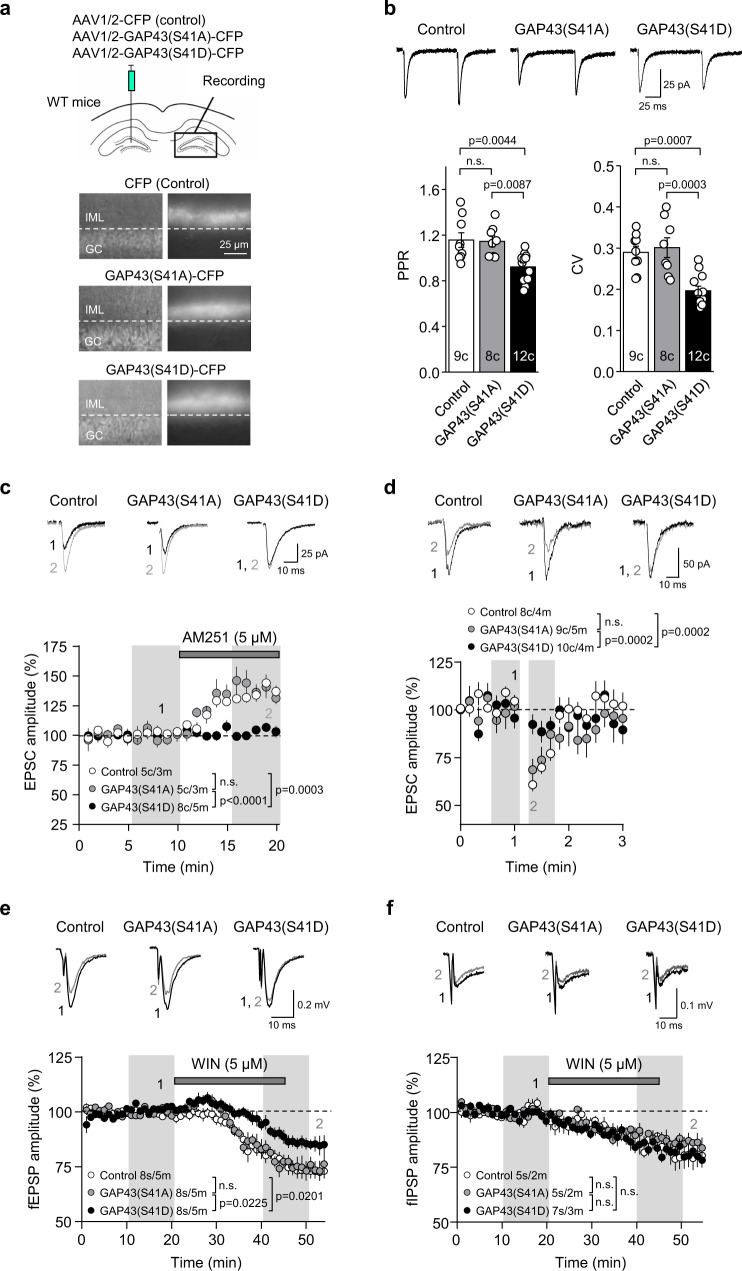
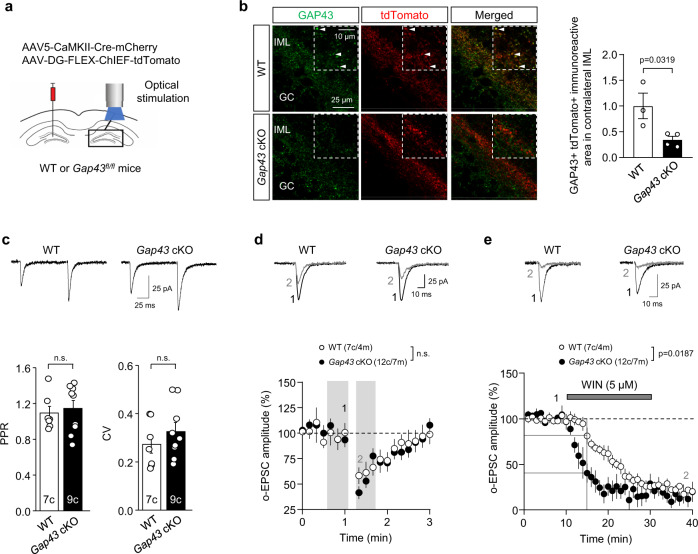
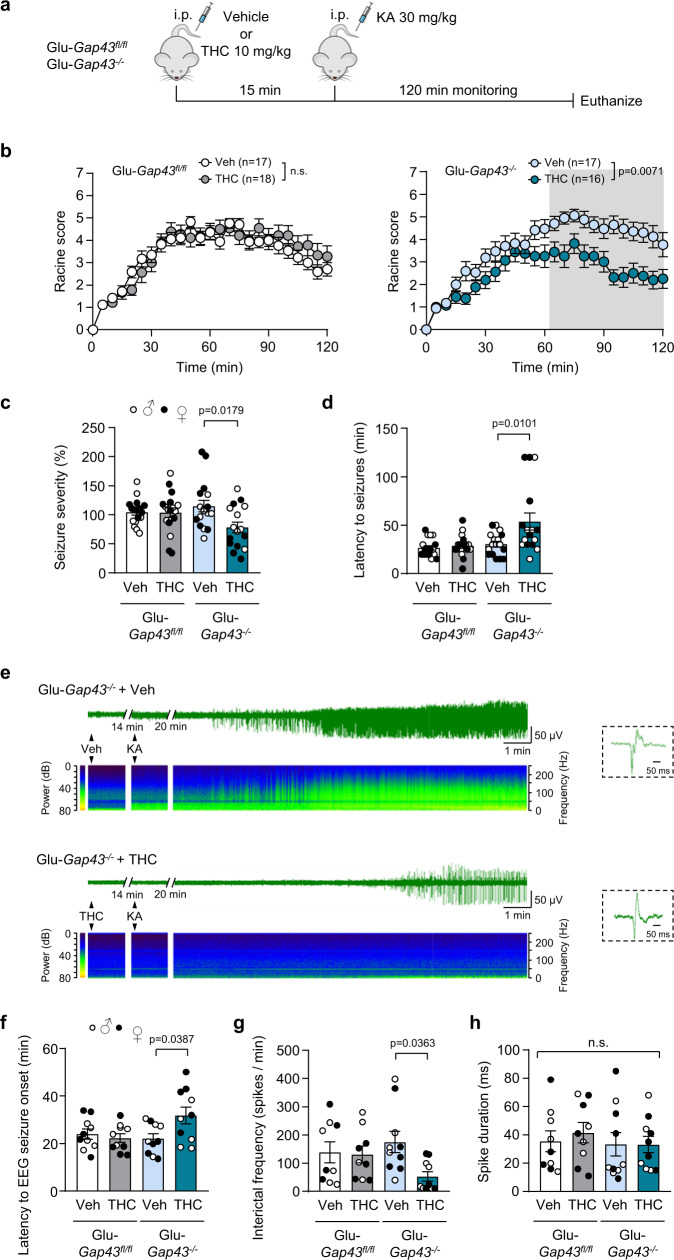
The type-1 cannabinoid receptor (CB1R) is widely expressed in excitatory and inhibitory nerve terminals, and by suppressing neurotransmitter release, its activation modulates neural circuits and brain function. While the interaction of CB1R with various intracellular proteins is thought to alter receptor signaling, the identity and role of these proteins are poorly understood. Using a high-throughput proteomic analysis complemented with an array of in vitro and in vivo approaches in the mouse brain, we report that the C-terminal, intracellular domain of CB1R interacts specifically with growth-associated protein of 43 kDa (GAP43). The CB1R-GAP43 interaction occurs selectively at mossy cell axon boutons, which establish excitatory synapses with dentate granule cells in the hippocampus. This interaction impairs CB1R-mediated suppression of mossy cell to granule cell transmission, thereby inhibiting cannabinoid-mediated anti-convulsant activity in mice. Thus, GAP43 acts as a synapse type-specific regulatory partner of CB1R that hampers CB1R-mediated effects on hippocampal circuit function.


Conflict of interest statement

The authors declare no competing interests.

Figures

Fig. 1
Fig. 1. GAP43 interacts with CB1R.
a Schematic workflow of the affinity purification and tandem MS/MS experiment conducted. A sheep whole-brain homogenate was loaded onto a lectin-hCB1R-CTD-bound Sepharose 4B column. After washing, elution with lactose, eluted-fraction separation by SDS-PAGE, and digestion with trypsin, peptides were subjected to nLC/MS-MS proteomic analysis. b Fluorescence polarization (FP)-based protein–protein binding experiments using 5-IAF-labeled CB1R-CTD and increasing amounts of unlabeled GAP43. FP was expressed as milli-FP units. Each point represents the mean ± SEM of 3 independent experiments. c Co-immunoprecipitation experiments in (top) primary mouse hippocampal neurons or (bottom) mouse hippocampal tissue. Immunoprecipitation (IP) was conducted with anti-GAP43 antibody or control IgG. Arrowheads point to specific precipitated bands. Whole-cell lysates (WCL) from 3-month-old WT and control Cnr1−/− mice are shown. A representative experiment is shown. The experiment was repeated independently 3 times with similar results. d Top, Representative confocal images of hippocampal synaptosomes of WT mice immunostained for synaptophysin 1 (Syn1), GAP43 and CB1R. Arrowheads point to representative triple-colocalizing synaptosomes. Bottom, Quantification of the percentage of Syn1+ synaptosomes that colocalize with either CB1R only, GAP43 only, or both CB1R and GAP43 (means ± SEM; n = 5 independent synaptosomal preparations; two-tailed unpaired Student’s t test). e PLA for CB1R and GAP43 was performed in hippocampal synaptosomes from WT mice and Cnr1−/− mice as control. Representative confocal images of CB1R-GAP43 complexes appearing as red signal (top), and quantification of PLA-positive signal per synaptosome (bottom; means ± SEM; n = 3 independent synaptosomal preparations per genotype; two-tailed unpaired Student’s t test). Source data are provided as a Source data file.
Fig. 2
Fig. 2. Phosphorylation of GAP43 at S41 facilitates its interaction with CB1R.
a Scheme of the mutant constructs aimed to modify GAP43 activation state. b PLA for CB1R and GAP43 was performed with anti-c-myc and anti-GFP antibodies in HEK293T cells transfected with CB1R-myc plus GFP-GAP43(WT), GFP-GAP43(S41D) or GFP-GAP43(S41A). Left, Representative confocal microscopy images show CB1R-GAP43 complexes appearing as red dots. Cell nuclei were stained with DAPI (blue). Right, Quantification of PLA-positive dots per GFP-transfected cell. Values of GFP-GAP43(S41A) were set at 100% (means ± SEM; n = 6 independent experiments; one-way ANOVA with Tukey’s multiple comparisons test). c Left, Co-immunoprecipitation experiments in HEK293T cells co-transfected with HA-tagged CB1R and GAP43(WT), GAP43(S41D), GAP43(S41A). Whole-cell lysates (WCL) are shown. Right, Quantification of optical density (O.D.) values of co-immunoprecipitated GAP43 relative to those of HA-CB1R are shown. Values of GFP-GAP43(S41A) were set at 1 (means ± SEM; GAP43(WT) n = 6 independent experiments, GAP43(S41D) n = 7 independent experiments, GAP43(S41A) n = 7 independent experiments; one-way ANOVA with Tukey’s multiple comparisons test). d BRET saturation experiments in HEK293T cells expressing CB1R-RLuc and increasing amounts of GFP-GAP43(WT), GFP-GAP43(S41D) or GFP-GAP43(S41A). BRET is expressed as milli-BRET units (mBU) (means ± SEM; n = 3 independent experiments). e DMR assays in HEK293T cells transfected with CB1R plus GAP43(WT), GAP43(S41D), GAP43(S41A) or a control empty vector, and exposed to 100 nM WIN-55,212–2 (WIN). A representative experiment is shown (n = 3 independent experiments). Source data are provided as a Source data file.
Fig. 3
Fig. 3. GAP43 interacts with CB1R in MC axon terminals of the DG.
PLA experiments were performed in hippocampal sections from 3-month-old mice of different genotypes. CB1R-GAP43 complexes are shown as PLA-positive red dots. Nuclei are stained with DAPI (blue). a Representative images of DG-IML sections from Cnr1fl/fl, GABA-Cnr1−/−, Glu-Cnr1−/−, and full Cnr1−/− mice. Arrowheads point to some of the complexes. Inset magnifications are included for each genotype. Quantification of PLA-positive dots per field is shown (right, means ± SEM; Cnr1fl/fl n = 5 mice, GABA-Cnr1−/− n = 5 mice, Glu-Cnr1−/− n = 5 mice, Cnr1−/− n = 6 mice; one-way ANOVA with Tukey’s multiple comparisons test). b Representative images of DG-IML sections from Stop-Cnr1, GABA-Cnr1-RS, Glu-Cnr1-RS, and Cnr1-RS mice. Arrowheads point to some of the complexes. Inset magnifications are included for each genotype. Quantification of PLA-positive dots per field is shown (right, means ± SEM; n = 7 mice per group; one-way ANOVA with Tukey’s multiple comparisons test). Source data are provided as a Source data file.
Fig. 4
Fig. 4. Phosphorylated GAP43 inhibits CB1R function at MC-GC synapses.
a Schematic diagram illustrating the injection of AAV1/2-CBA-CFP (control), AAV1/2-CBA-GAP43(S41A)-CFP or AAV1/2-CBA-GAP43(S41D)-CFP in the hilus of 3-week-old WT mice. Electrophysiological recordings were performed in the contralateral DG. Infrared differential interference contrast (left) and fluorescence (right) images showing CFP expression in the commissural MC axon terminals in the contralateral DG. Note the presence of CFP-positive fibers in the IML and its absence in the GC layer. This CFP-expression pattern was observed in all injected animals with similar results. b Whole-cell patch-clamp recordings were performed on GCs from injected mice. Representative traces (top) and quantification bar graph (bottom) for basal PPR and CV are shown (means ± SEM; c = cells; one-way ANOVA with Tukey’s multiple comparisons test). c EPSCs recorded from injected mice upon AM251 bath application (5 μM, 10 min). Representative EPSC traces, before and after AM251 application (top), and time-course summary plot (bottom) are shown [means ± SEM, c = cells, m = mice; shaded areas indicate the time intervals at which the statistical analysis was conducted; one-way ANOVA with Tukey’s multiple comparisons test]. d DSE magnitude in injected mice. Representative traces (top) and time-course summary plot (bottom) are shown [means ± SEM; c = cells, m = mice; shaded areas indicate the time intervals at which the statistical analysis was conducted; one-way ANOVA with Tukey’s multiple comparisons test]. e fEPSPs recorded from injected mice upon WIN-55,212-2 bath application (WIN; 5 μM, 25 min). Representative fEPSP traces, before and after WIN application (top), and time-course summary plot (bottom) are shown [means ± SEM; s = slices, m = mice; shaded areas indicate the time intervals at which the statistical analysis was conducted; one-way ANOVA with Tukey’s multiple comparisons test]. f fIPSPs recorded from injected mice upon WIN bath application (5 μM, 25 min). Representative fIPSP traces, before and after WIN application (top) and time-course summary plot (bottom) are shown (means ± SEM; s = slices, m = mice; shaded areas indicate the time intervals at which the statistical analysis was conducted; n.s. by one-way ANOVA with Tukey’s multiple comparisons test). Source data are provided as a Source data file.
Fig. 5
Fig. 5. GAP43 genetic deletion from MCs enhances CB1R function at MC-GC synapses.
a Schematic diagram illustrating the injection of a mix of AAV5-CamKII-Cre-mCherry and AAV-DG-FLEX-ChIEF-tdTomato in the hilus of 3-week-old Gap43fl/fl and WT mice. Light pulses of 0.5–2.0 ms were used to evoke EPSCs driven by the ChIEF-expressing axons originating from commissural MCs. b Reduced GAP43 immunoreactivity (green) in AAV-infected tdTomato + (red) fibers of the contralateral IML from injected Gap43 cKO mice compared to WT mice. Arrowheads point to colocalizing boutons in WT mice. Representative images and quantification of GAP43/tdTomato colocalization are shown (means ± SEM; WT n = 3 mice, Gap43 cKO n = 4 mice; two-tailed unpaired Student’s t test). c Whole-cell patch-clamp recordings of GCs were performed in Gap43 cKO and WT mice. Representative traces (top) and quantification bar graph for basal PPR and CV (bottom) are shown (means ± SEM; c = cells; n.s. by two-tailed unpaired Student’s t test). d Representative traces (top) and time-course summary plot (bottom) for DSE are shown (means ± SEM; c = cells, m = mice; shaded areas indicate the time intervals at which the statistical analysis was conducted; n.s. by two-tailed unpaired Student’s t test). e Representative traces (top) and time-course summary plot (bottom) for o-EPSC amplitude upon WIN-55,212-2 bath application (WIN; 5 μM, 20 min) (means ± SEM; c = cells, m = mice; WT vs Gap43 cKO at time15 min, p = 0.0187 by two-tailed unpaired Student’s t test). Source data are provided as a Source data file.
Fig. 6
Fig. 6. Enhanced anti-convulsant response to THC in Glu-Gap43−/− mice.
a Timeline of the experiments. Vehicle or THC (10 mg/kg, i.p.; 1 injection) was administered to 3-month-old Glu-Gap43−/− mice and their corresponding Gap43fl/fl littermates. Kainic acid (KA; 30 mg/kg, i.p.; 1 injection) was administered 15 min later, and behavioral score (bd) or hippocampal EEG recording (eh) was monitored continuously for 120 min. b Behavioral scoring of seizures using a modified Racine scale (means ± SEM; number of mice in parentheses; the shaded area indicates all the time points at which p < 0.05 by two-way ANOVA with Sidak’s multiple comparisons test;). c Integrated seizure severity, expressed as normalized percentage from Gap43fl/fl/Vehicle group (means ± SEM; Gap43fl/fl/Vehicle n = 17 mice, Gap43fl/fl/THC n = 18 mice, Glu-Gap43−/−/Vehicle n = 17 mice, Glu-Gap43−/−/THC n = 16 mice; two-way ANOVA with Tukey’s multiple comparisons test). d Latency to seizures (means ± SEM; Gap43fl/fl/Vehicle n = 17 mice, Gap43fl/fl/THC n = 18 mice, Glu-Gap43−/−/Vehicle n = 17 mice, Glu-Gap43−/−/THC group n = 16 mice; two-way ANOVA with Tukey’s multiple comparisons test). e EEG recordings of representative Glu-Gap43−/− mice treated with vehicle (top) or THC (bottom). Epileptic-like spikes appeared after KA injection (insets: detail of individual spikes). The corresponding sonograms (frequency spectrum along recording time) are shown below each recording. f Latency to EEG seizure onset (means ± SEM, n = 10 mice per group; two-way ANOVA with Tukey’s multiple comparisons test). g Interictal frequency (means ± SEM; Gap43fl/fl/Vehicle n = 9 mice, Gap43fl/fl/THC n = 9 mice, Glu-Gap43−/−/Vehicle n = 10 mice, Glu-Gap43−/−/THC n = 10 mice; two-way ANOVA with Tukey’s multiple comparisons test). h Average spike duration (means ± SEM; Gap43fl/fl/Vehicle n = 9 mice, Gap43fl/fl/THC n = 9 mice, Glu-Gap43−/−/Vehicle n = 10 mice, Glu-Gap43−//THC n = 10 mice; n.s. by two-way ANOVA with Tukey’s multiple comparisons test). Source data are provided as a Source data file.

References

    1. Piomelli D. The molecular logic of endocannabinoid signalling. Nat. Rev. Neurosci. 2003;4:873–884. doi: 10.1038/nrn1247. - DOI - PubMed
    1. Pertwee RG, et al. International Union of Basic and Clinical Pharmacology. LXXIX. Cannabinoid receptors and their ligands: beyond CB1 and CB2. Pharmacol. Rev. 2010;62:588–631. doi: 10.1124/pr.110.003004. - DOI - PMC - PubMed
    1. Kano M, Ohno-Shosaku T, Hashimotodani Y, Uchigashima M, Watanabe M. Endocannabinoid-mediated control of synaptic transmission. Physiol. Rev. 2009;89:309–380. doi: 10.1152/physrev.00019.2008. - DOI - PubMed
    1. Castillo PE, Younts TJ, Chávez AE, Hashimotodani Y. Endocannabinoid signaling and synaptic function. Neuron. 2012;76:70–81. doi: 10.1016/j.neuron.2012.09.020. - DOI - PMC - PubMed
    1. Mechoulam R, Parker LA. The endocannabinoid system and the brain. Annu. Rev. Psychol. 2013;64:21–47. doi: 10.1146/annurev-psych-113011-143739. - DOI - PubMed

Publication types

LinkOut - more resources