. 2023 Apr 21;14(1):2314.
doi: 10.1038/s41467-023-37437-5.

Single-nucleus RNA-sequencing of autosomal dominant Alzheimer disease and risk variant carriers

Affiliations

Single-nucleus RNA-sequencing of autosomal dominant Alzheimer disease and risk variant carriers

Logan Brase et al. Nat Commun. .

Abstract

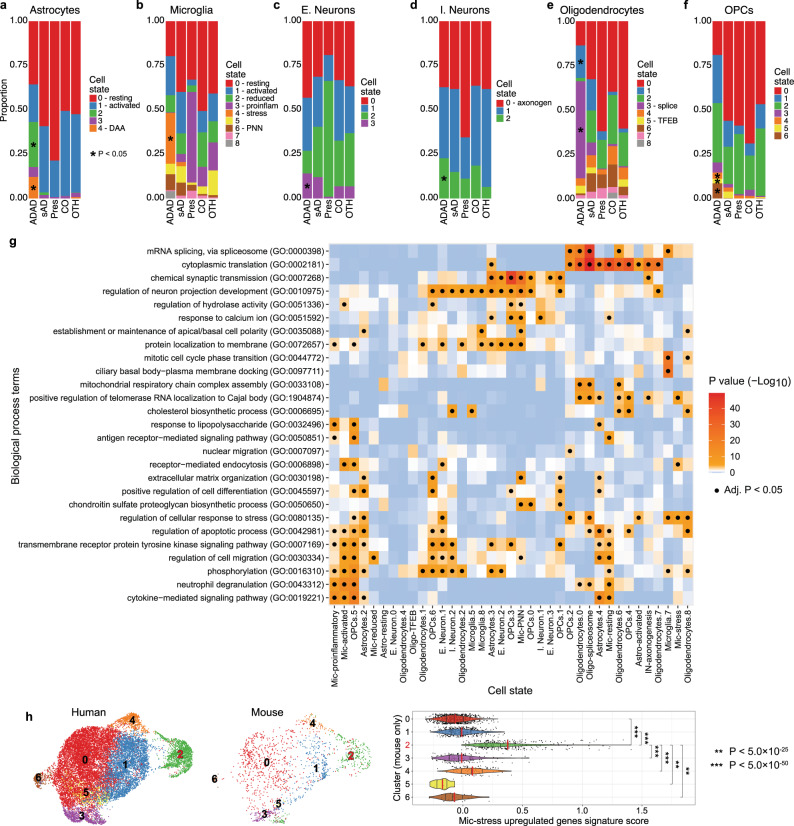
Genetic studies of Alzheimer disease (AD) have prioritized variants in genes related to the amyloid cascade, lipid metabolism, and neuroimmune modulation. However, the cell-specific effect of variants in these genes is not fully understood. Here, we perform single-nucleus RNA-sequencing (snRNA-seq) on nearly 300,000 nuclei from the parietal cortex of AD autosomal dominant (APP and PSEN1) and risk-modifying variant (APOE, TREM2 and MS4A) carriers. Within individual cell types, we capture genes commonly dysregulated across variant groups. However, specific transcriptional states are more prevalent within variant carriers. TREM2 oligodendrocytes show a dysregulated autophagy-lysosomal pathway, MS4A microglia have dysregulated complement cascade genes, and APOEε4 inhibitory neurons display signs of ferroptosis. All cell types have enriched states in autosomal dominant carriers. We leverage differential expression and single-nucleus ATAC-seq to map GWAS signals to effector cell types including the NCK2 signal to neurons in addition to the initially proposed microglia. Overall, our results provide insights into the transcriptional diversity resulting from AD genetic architecture and cellular heterogeneity. The data can be explored on the online browser ( http://web.hararilab.org/SNARE/ ).


Conflict of interest statement

J.C.M. is a consultant for the Barcelona Brain Research Center (BBRC) and the TS Srinivasan Advisory Board. J.C.M. is an advisory board member for the Cure Alzheimer’s Fund Research Strategy Council. R.J.B. maintains an equity ownership interest and is a member of the advisory board of C2N Diagnostics. Unrelated to this article, R.J.B. serves as the principal investigator of the DIAN-TU, which the Alzheimer’s Association supports, GHR Foundation, an anonymous organization, and the DIAN-TU Pharma Consortium (Active: Eli Lilly and Company/Avid Radiopharmaceuticals, F. Hoffman-La Roche/Genentech, Biogen, Eisai, and Janssen. Previous: Abbvie, Amgen, AstraZeneca, Forum, Mithridion, Novartis, Pfizer, Sanofi, and United Neuroscience). In addition, in-kind support has been received from CogState and Signant Health. Unrelated to this article, R.J.B. has submitted the US nonprovisional patent application “Methods for Measuring the Metabolism of CNS Derived Biomolecules in Vivo” and provisional patent application “Plasma Based Methods for Detecting CNS Amyloid Deposition.” E.M. receives research support from the NIA, Hoffman-La Roche, and Eli Lilly, is a member of advisory boards for Eli Lilly, Alector, and the NIA, and holds a leadership role in Fondation Alzheimer and Alzamend. C.X. is a consultant for DIADEM and a member of the advisory board for the University of Wisconsin ADRC. A.G. receives royalties from Athena Diagnostics and Taconic Biosciences, is a consultant for Genentech SAB and AbbVie and holds stock or stock options in Cognition Therapeutics and Denali Therapeutics. M.F. receives research support from Eli Lilly and Company, Hoffmann-La Roche, Avanir, Biogen, Cognition Therapies, Green Valley, Otsuka, Neurotrope Biosciences, AZTherapies, Athira, Ionis, and Lexeo, and is a member of advisory boards for Oligomerik and T3D. The remaining authors declare no competing interests.

Figures

Fig. 1
Fig. 1. SnRNA-seq distinguishes major cell types using 67 human brains.
a Diagram of the study design. b UMAP plot showing 15 distinguished clusters, 0–14, with 294,114 total cells. c DotPlot depicting expression of cell-type-specific markers genes to identify each cluster in b. Source data are provided as a Source Data file.
Fig. 2
Fig. 2. Divergent and coincident expression patterns across ADAD, TREM2, and sAD by cell type.
a Ridge plots showing the distribution of gene estimates extracted from the linear mixed models comparing control nuclei to ADAD, TREM2, and sAD nuclei within cell types. Only DEGs that passed multiple testing correction in at least one genetic group were considered. For inclusion, the gene must also have been nominally significant (p < 0.05) in the genetic group. The total number of genes is shown on the right tail. b Heatmaps of gene estimates from the same models emphasize the divergent and congruent expression patterns across genetic groups. The largest 500 estimates were selected per cell type and used to create full heatmaps (found in Supplement). “Modules” were manually created based on expression patterns and dendrogram groupings. The top 10% of genes from each module were extracted (order preserved) to produce the above heatmaps. “sAD sig.”, “TREM2 sig.”, and “ADAD sig.” depict the significance status of each gene for that group. “BH”: Benjamini–Hochberg p < 0.05, “Nominal”: p < 0.05, “NS”: not significant. Source data are provided as a Source Data file.
Fig. 3
Fig. 3. ADAD participants exhibit distinct signatures in astrocytes, microglia, OPCs, oligodendrocytes, and neurons.
a–f Proportion plots show the enrichment of certain cell states in ADAD participants compared to all other participants. The proportion was calculated for each sample (see Methods). For visualization, sample proportions are averaged by AD status. (*) represents a significant (p < 0.05) enrichment of that cluster within ADAD samples as determined by linear regression. Exact p values can be found in Supplementary Dataset 6. ADAD autosomal dominant AD, sAD sporadic AD, Pres presymptomatic, CO neuropath free, OTH non-AD neurodegenerative. a Astrocytes (Astro-DAA = cluster 4). b Microglia (Mic-stress = cluster 4). c Excitatory neurons. d Inhibitory neurons. e Oligodendrocytes (Oligo-spliceosome cluster 3). f OPCs. g A heatmap of the enriched pathways within the upregulated genes for each cell state. The DEGs were isolated from the linear mixed models comparing each cell state to all other cell states of the same cell type. GO Biological Process terms were summarized and selected as described in the Methods. (·) indicates a significant (Benjamini–Hochberg p < 0.05) association as calculated by the R package enrichR. Exact p values can be found in the Source Data file. h 5xFAD mouse validation of Mic-stress ADAD cluster (cluster 2 here). Left and middle: a UMAP of integrated microglia split by species. Right: a violin plot showing that mouse cells in the ADAD cluster have a higher human microglia ADAD cluster signature score than mouse cells in other clusters. (**) = p < 5.0 × 10−25, (***) = p < 5.0 × 10−50. Source data are provided as a Source Data file.
Fig. 4
Fig. 4. TREM2 reduced activation variant carriers (p.R47H, p.R62H, and p.H157Y) have distinct microglia and oligodendrocyte profiles.
ad Microglia (Mic-reduced = cluster 2). eg Oligodendrocytes (Oligo-TFEB = cluster 5). a, e Proportion plots show a significant (p < 0.05) enrichment (*) of cell states in TREM2 reduced activation carriers (TREM2R) compared to all other samples as determined by linear regression. Exact p values can be found in Supplementary Dataset 6. The proportion was calculated for each sample (see Methods). For visualization, sample proportions are averaged by group. “Other” represents all sAD non-TREM2 reduced activation carriers, including carriers of other TREM2 variants. b Barplot shows the expression of both resting and activated microglia marker genes in Mic-reduced (mic.2) compared to the Mic-resting (mic.0) and Mic-activated cell states (mic.1). Expression was corrected for the age of death and sex using partial residuals. c UMAP plots showing the integrated nuclei from the discovery cohort and ROSMAP, split by cohort. d Violin plot of cell state expression signatures in the ROSMAP nuclei. The signature was calculated from the upregulated genes from the discovery cohort. Differences in signature scores were calculated using linear regression. (*) = p < 0.05, (**) = p < 5.0 × 10−3, (***) = p < 5.0 × 10−20; exact p values can be found in the Source Data file. f Barplot shows the log2 fold-change of TFEB by oligodendrocyte cell state. g Identification of gene regulatory networks (GRN) in Oligo-TFEB discovery and replication cohorts. Regulons were filtered to include only those identified in both cohorts (p = 9.98 × 10−41; hypergeometric analysis) with significant differential expression in Oligo-TFEB. Then those regulons with significant (Benjamini–Hochberg p < 0.05; hypergeometric analysis and Benjamini–Hochberg multiple testing correction) coincidence in the underlying target genes between cohorts were selected. h Gene regulatory network for transcription factors (TF; shown in blue) replicated in both discovery (purple edges) and ROSMAP (orange edges) datasets for oligo-TFEB. Replicated target genes and edges are shown in yellow and green respectively. Genes within AD GWAS loci are highlighted in red. g, h (*) = Benjamini–Hochberg p < 0.05, (**) = Benjamini–Hochberg p < 0.01. Source data are provided as a Source Data file.
Fig. 5
Fig. 5. Unique microglial and astrocytic signatures for MS4A rs1582763 carriers.
a Proportion plot shows a dose-dependent enrichment of Mic-proinflammatory (cluster 3) in carriers of the rs1582763-A allele. The proportion was calculated for each sample, and for visualization, sample proportions are averaged by the group. (*) represents a significant (p < 0.05) enrichment as determined by linear regression. Exact p values can be found in Supplementary Dataset 6. b Heatmap of proinflammatory (purple) and anti-inflammatory (gray) microglia marker gene log2 fold changes (Log2(FC)) within the microglia cell states. (·) indicates a significant (Benjamini–Hochberg p < 0.05) association as determined by linear regression and Benjamini–Hochberg multiple testing correction. Exact log fold-change and p values can be found in the Source Data file. c Volcano plot of DEGs determined by linear mixed models between the “main” (Mic-activated, blue) and “MS4A”’ (Mic-proinflammatory, purple) activated microglia clusters. d A proportion plot depicts a significant (p < 0.05) reduced proportion (*) of astro.0 (non-activated) in rs1582763-A carriers and a trend for the enrichment of astro.1 (activated) as calculated by linear regression. Exact p values can be found in Supplementary Dataset 6. Source data are provided as a Source Data file.
Fig. 6
Fig. 6. Transcriptional states complement chromatin accessibility to help prioritize causal cell types and genes mediating AD GWAS risk variants.
a Overview of prioritized risk genes by AD GWAS studies and their transcriptional changes across cellular states (absolute log2 fold-change in any cellular state for cell type). The “Locus” row indicates genes within the same locus using alternating black and gray rectangles. The color of the squares represents the max log2 fold-change of the gene between cell states (subclusters) of that cell type (gray: not significant). The square size represents the average log10 transformed gene expression. Borders represent co-accessibility (red background) or overlap (black outline) between the TSS and a regulatory element containing a prioritized (95% credible set) AD variant. Background color intensity corresponds to the highest posterior probability of association (PPA) of the 95% credible set variants overlapping the TSS or co-accessible element. b Replication of the parietal lobe differential expression results using the UCI prefrontal cortex snRNA-seq data. OR: Fisher exact test odds-ratio (replicated vs. non-replicated). c Distribution of genes co-accessible or with their TSS overlapping a regulatory element (snATAC-seq narrow peak) containing a fine-mapped AD risk genetic variant. The color indicates the number of cell types the co-accessibility signal was detected in. d Chromatin accessibility signals across cell types for the BIN1 locus. The lead variant is represented by a red vertical bar, and the fine-mapping PPAs are plotted for each variant with PPA >0.01. TSS regions co-accessible with variant-overlapping regulatory elements are plotted as arcs below each signal track. e Same visualization as (d) for the NCK2 locus. Source data are provided as a Source Data file.

References

    1. LaFerla FM, Oddo S. Alzheimer’s disease: abeta, tau and synaptic dysfunction. Trends Mol. Med. 2005;11:170–176. doi: 10.1016/j.molmed.2005.02.009. - DOI - PubMed
    1. Long JM, Holtzman DM. Alzheimer disease: an update on pathobiology and treatment strategies. Cell. 2019;179:312–339. doi: 10.1016/j.cell.2019.09.001. - DOI - PMC - PubMed
    1. Goate A, et al. Segregation of a missense mutation in the amyloid precursor protein gene with familial Alzheimer’s disease. Nature. 1991;349:704–706. doi: 10.1038/349704a0. - DOI - PubMed
    1. Murrell J, Farlow M, Ghetti B, Benson MD. A mutation in the amyloid precursor protein associated with hereditary Alzheimer’s disease. Science. 1991;254:97–99. doi: 10.1126/science.1925564. - DOI - PubMed
    1. St George-Hyslop P, et al. Genetic evidence for a novel familial Alzheimer’s disease locus on chromosome 14. Nat. Genet. 1992;2:330–334. doi: 10.1038/ng1292-330. - DOI - PubMed

Publication types