. 2023 Apr 21;14(1):2309.
doi: 10.1038/s41467-023-37795-0.

Immunogenicity and protective efficacy of SARS-CoV-2 mRNA vaccine encoding secreted non-stabilized spike in female mice

Affiliations

Immunogenicity and protective efficacy of SARS-CoV-2 mRNA vaccine encoding secreted non-stabilized spike in female mice

Eakachai Prompetchara et al. Nat Commun. .

Abstract

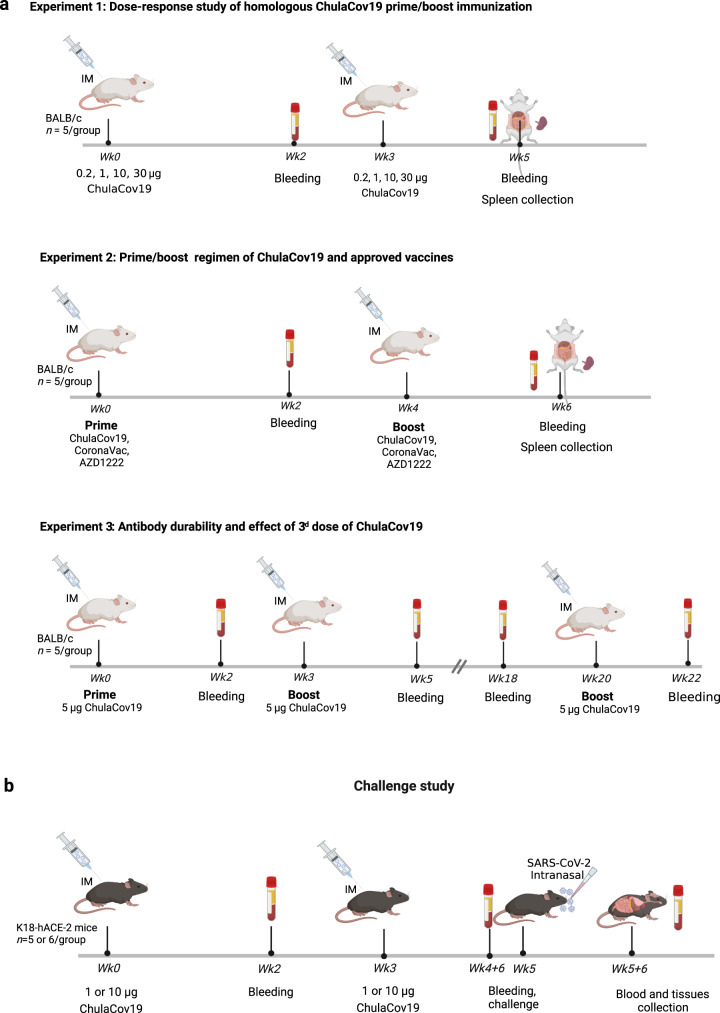
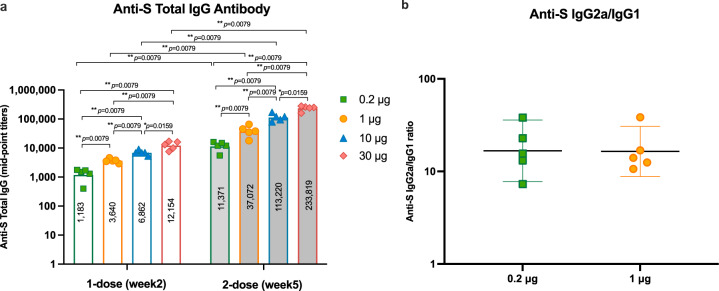
Establishment of an mRNA vaccine platform in low- and middle-income countries (LMICs) is important to enhance vaccine accessibility and ensure future pandemic preparedness. Here, we describe the preclinical studies of "ChulaCov19", a SARS-CoV-2 mRNA encoding prefusion-unstabilized ectodomain spike protein encapsulated in lipid nanoparticles (LNP). In female BALB/c mice, ChulaCov19 at 0.2, 1, 10, and 30 μg elicits robust neutralizing antibody (NAb) and T cell responses in a dose-dependent relationship. The geometric mean titers (GMTs) of NAb against wild-type (WT, Wuhan-Hu1) virus are 1,280, 11,762, 54,047, and 62,084, respectively. Higher doses induce better cross-NAb against Delta (B.1.617.2) and Omicron (BA.1 and BA.4/5) variants. This elicited immunogenicity is significantly higher than those induced by homologous CoronaVac or AZD1222 vaccination. In a heterologous prime-boost study, ChulaCov19 booster dose generates a 7-fold increase of NAb against Wuhan-Hu1 WT virus and also significantly increases NAb response against Omicron (BA.1 and BA.4/5) when compared to homologous CoronaVac or AZD1222 vaccination. Challenge studies show that ChulaCov19 protects human-ACE-2-expressing female mice from COVID-19 symptoms, prevents viremia and significantly reduces tissue viral load. Moreover, anamnestic NAb response is undetectable in challenge animals. ChulaCov19 is therefore a promising mRNA vaccine candidate either as a primary or boost vaccination and has entered clinical development.


Conflict of interest statement

DW, and MGA are named on patents that describe lipid nanoparticles for delivery of nucleic acid therapeutics, including mRNA and the use of modified mRNA in lipid nanoparticles as a vaccine platform. KR, DW, MGA, CK, EP, and SB are co-inventors of the submitted ChulaCov19 mRNA vaccine’s Patent. KL and JH are employees of Genevant Sciences Corporation and are named on patent describing lipid nanoparticles. WW is an employee of BioNet-Asia, Co. Ltd. We have disclosed those interests fully to their affiliations, and we have in place an approved plan for managing any potential conflicts arising from licensing of the patents. The remaining authors declare no competing interests.

Figures

Fig. 1
Fig. 1. Immunization schedule of ChulaCov19 in BALB/c mice.
a Experiment 1: mice were immunized twice intramuscularly (IM) with a 3-week interval with various dosages of ChulaCov19 at 0.2, 1, 10 and 30 µg. Experiment 2: heterologous prime-boost study, mice were primed with 1/10 of the approved human dosage of CoronaVac or AZD1222 and boosted 4 weeks later with 5 µg of ChulaCov19. Homologous prime/boost of each vaccine (CoronaVac, AZD1222, or ChulaCov19) were included as control groups. Experiment 3: antibody durability and effect of 3rd dose of ChulaCov19 study, mice were immunized twice with 3 weeks interval with 5 µg of ChulaCov19 (1/10 of human dose used in clinical trial) then boosted again at week 20. Bleeding was performed at 2 weeks following each dose (and at week 18 for Experiment 3). Splenocytes were collected at 2 weeks after the second dose (Experiment 1 & 2). n = 5 per group for Experiment 1, 2 and 3. b Challenge study in K18-hACE2 transgenic mice, n = 6 in vaccinated groups and n = 5 in control (PBS-receiving) group. Animals were immunized IM with 1 µg or 10 µg of ChulaCov19 at weeks 0 and 3. Sera were collected at weeks 0, 2, 3, 4 + 6 days, and 5 + 6 days for NAb measurements. At week 5, mice were challenged intranasally with 2×10⁴ pfu of WT SARS-CoV-2. Tissues were collected at week 5 + 6 days for assessment of viral RNA. Figures were created with BioRender.com.
Fig. 2
Fig. 2. Protein expression analysis at 24 h after mRNA transfection in VERO E6 cells.
a Intracellular S protein expression examined by immunofluorescent assay employing anti-RBD, -S1, -S2 or PCS as primary antibody, the nuclei were counter stained with DAPI (blue). FITC-tagged 2nd Abs (green) were used for detection of RBD, S1, and S2 while AlexaFluor647-tagged 2nd Ab (red) was used following PCS staining. b hACE-2 binding assay (merged): culture supernatant collected from ChulaCov19 transfected cells incubated with HEK293T- hACE-2 cells. S protein on HEK293T-hACE-2 cell surface was stained with the same antibodies used in 2a. c S protein expression in cell culture supernatant analyzed by western blot using anti-RBD, -S1, -S2 or PCS as primary antibody. Recombinant S protein with abolished S1/S2 cleavage site was used as positive control in HEK293T-hACE-2 binding assay (right panel of 2b) and western blot (right lane of each panel in 2c). S0 was used to depict unprocessed S protein. Experiments were repeated two times independently with similar results.
Fig. 3
Fig. 3. S-specific IgG responses in ChulaCov19 immunized mice.
a Kinetics of total IgG at 2 weeks after receiving 1 or 2 doses of 0.2, 1, 10, and 30 µg of ChulaCov19. b S-specific IgG2a/IgG1 ratio measured at 2 weeks after the 2nd dose. Note; the IgG2a/IgG1 ratio of 10 µg and 30 µg immunized mice were not analyzed due to limited volume of serum samples. The mid-point titers were determined in duplicate assays from 5 mice in each group. Bars (a) or horizontal lines (b) represent the geometric mean (GMT) for each group while error bars indicate the 95% confident interval. Each dot represents an individual animal. Statistical analysis significance was determined by two-sided Mann–Whitney test. Differences were considered significant at p < 0.05 with exact p-values shown. p < 0.05 and p < 0.01 are indicated by * and **, respectively. Source data are provided as a Source Data file.
Fig. 4
Fig. 4. NAb responses in immunized mice.
Experiment 1: (a) Live-virus microneutralization (micro-VNT50) titers against WT (Wuhan-Hu1) live-virus at two weeks after receiving each vaccine dose. b Pseudovirus neutralization test (psVNT50) titers at two weeks after the second dose againt WT (Wuhan-Hu1), Delta (B.1.617.2), Omciron (BA.1, and BA.4/5) variants. Experiment 2: c micro-VNT50 titers against WT (Wuhan-Hu1), Alpha (B.1.1.7), Beta (B.1.351), and Delta (B.1.617.2) live-virus at two weeks after receiving various homologous or heterologous prime/boost regimens. d psVNT50 NAb titer results at two weeks after the second dose in various prime/boost regimens againt Omicron BA.1 and BA.4/5 subvariants. Experiment 3: e psVNT50 NAb against WT (Wuhan-Hu1), Delta (B.1.617.2), and Omicron (BA.1 and BA.4/5) variants for NAb durability and effect of 3rd dose of ChulaCov19 studies. The titers were determined in duplicate assays from 5 mice in each group. Note; 4 mice in 10 µg group were analyzed for psVNT50 against BA.4/5 due to the limited volume of serum samples. Each dot represents an individual animal. Bars represent the GMTs and 95% CI for each group. Statistical significance was determined by two-sided Mann–Whitney tests. Differences were considered significant at p < 0.05 with exact p-values shown. p < 0.05 and p < 0.01 are indicated by * and **, respectively. Source data are provided as a Source Data file.
Fig. 5
Fig. 5. Induction of S-specific IFN-γ positive T cells in BALB/c mice.
a mice were immunized with various doses of ChulaCov19 analyzed at 2 weeks after the second dose. b heterologous prime/boost study; mice were primed with CoronaVac or AZD1222 vaccine and boosted with ChulaCov19 (5 µg). Homologouse prime/boost results of each vaccine were included. S-specific IFN-γ positive T cells were determined in duplicate assays from 5 mice in each group. Bars represent the mean ± SD of S-specific IFN-γ positive T cells after stimulated with overlapping peptide pools spanning the SARS-CoV-2 S1 (pooled #1-5) and S2 (pooled #6-10). Statistical significance was determined by two-sided Mann–Whitney test. Differences were considered significant at p < 0.05 with exact p-values shown. p < 0.05 and p < 0.01 are indicated by * and **, respectively. SD; standard deviation. Source data are provided as a Source Data file.
Fig. 6
Fig. 6. Immune response and protective efficacy results in the challenge study.
a Kinetic response of micro-VNT50 titer after ChulaCov19 immunization and after challenge. The titers were determined in duplicate assays from control (n = 5) or vaccinated groups (n = 6), respectively. Data are presented as GMT of micro-VNT50 titer with 95% confident interval. Statistical analysis was performed to compare the GMT of micro-VNT50 between 1 and 10 μg dosed mice at each time point. b Body-weight values with SD are presented as a percentage of initial body weight before challenge (Day 0) through Day 6 post-challenge. In the control group, 3 out of 5 mice reached euthanasia criteria on Day 5 hence only 2 mice were analyzed for body weight on Day 6 after challenge. c SARS-CoV-2 viral RNA copies with SD detected by RT-qPCR in serum and homogenized tissues of challenged animals analyzed at euthanasia date (Day 6). Each dot represents an individual animal. Note: tissues from 3/5 animals in control group were collected at day 5. RNA copies were calculated as genomic equivalent/mg of tissue. Statistical significance was determined by two-sided Mann–Whitney test. p < 0.05 and p < 0.01 are indicated by * and **, respectively. SD; standard deviation. Source data are provided as a Source Data file.

References

    1. Helmy, Y. A. et al. The COVID-19 Pandemic: A Comprehensive Review of Taxonomy, Genetics, Epidemiology, Diagnosis, Treatment, and Control. J. Clin. Med.9, 1225 (2020). - PMC - PubMed
    1. Oran DP, Topol EJ. Prevalence of Asymptomatic SARS-CoV-2 Infection. Ann Intern Med. 2021;174:286–287. doi: 10.7326/L20-1285. - DOI - PubMed
    1. Ma Q, et al. Global Percentage of Asymptomatic SARS-CoV-2 Infections Among the Tested Population and Individuals With Confirmed COVID-19 Diagnosis: A Systematic Review and Meta-analysis. JAMA Netw Open. 2021;4:e2137257. doi: 10.1001/jamanetworkopen.2021.37257. - DOI - PMC - PubMed
    1. Alene M, et al. Magnitude of asymptomatic COVID-19 cases throughout the course of infection: A systematic review and meta-analysis. PLoS One. 2021;16:e0249090. doi: 10.1371/journal.pone.0249090. - DOI - PMC - PubMed
    1. Li R, et al. Substantial undocumented infection facilitates the rapid dissemination of novel coronavirus (SARS-CoV-2) Science. 2020;368:489–493. doi: 10.1126/science.abb3221. - DOI - PMC - PubMed

Publication types

Supplementary concepts