. 2023 Apr 21;14(1):2312.
doi: 10.1038/s41467-023-37457-1.

Machine learning prediction of the degree of food processing

Affiliations

Machine learning prediction of the degree of food processing

Giulia Menichetti et al. Nat Commun. .

Abstract

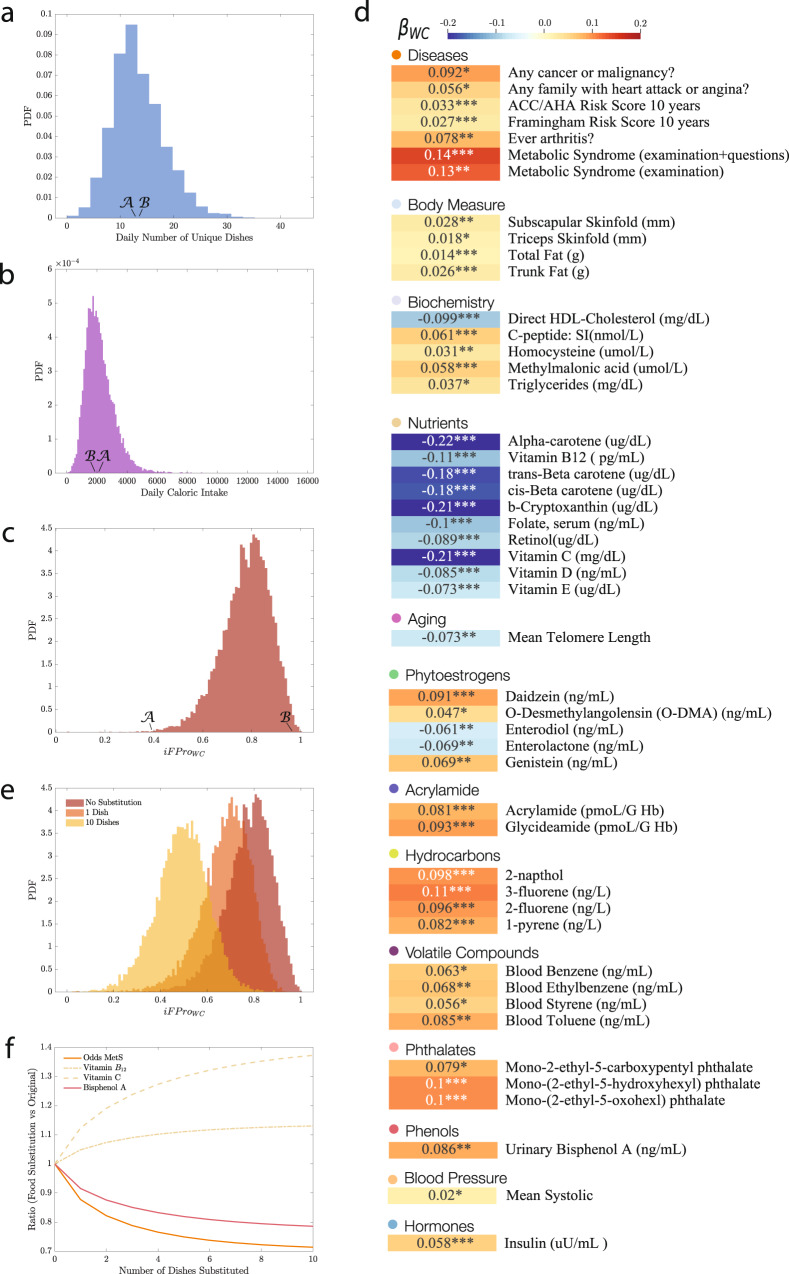
Despite the accumulating evidence that increased consumption of ultra-processed food has adverse health implications, it remains difficult to decide what constitutes processed food. Indeed, the current processing-based classification of food has limited coverage and does not differentiate between degrees of processing, hindering consumer choices and slowing research on the health implications of processed food. Here we introduce a machine learning algorithm that accurately predicts the degree of processing for any food, indicating that over 73% of the US food supply is ultra-processed. We show that the increased reliance of an individual's diet on ultra-processed food correlates with higher risk of metabolic syndrome, diabetes, angina, elevated blood pressure and biological age, and reduces the bio-availability of vitamins. Finally, we find that replacing foods with less processed alternatives can significantly reduce the health implications of ultra-processed food, suggesting that access to information on the degree of processing, currently unavailable to consumers, could improve population health.


Conflict of interest statement

A.-L.B. is the founder of Scipher Medicine and Naring Health, companies that explore the use of network-based tools in health and food. D.M. reports research funding from the National Institutes of Health, the Gates Foundation, the Rockefeller Foundation, Vail Innovative Global Research, and the Kaiser Permanente Fund; personal fees from Acasti Pharma and Barilla; scientific advisory board of Beren Therapeutics, Brightseed, Calibrate, Elysium Health, Filtricine, HumanCo, Instacart Health, January Inc., and Perfect Day (ended: Day Two, Discern Dx, Season Health, and Tiny Organics); stock ownership in Calibrate and HumanCo; and chapter royalties from UpToDate, all outside the submitted work. The remaining authors declare no competing interests.

Figures

Fig. 1
Fig. 1. Food processing and nutrient changes (FoodProX).
a, b Ratio of nutrient concentrations for 100 g of Sauteed Onion and Onion Rings compared to Raw Onion, indicating how processing alters the concentration of multiple nutrients. All nutrients in excess of at least two orders of magnitude compared to the concentrations found in the raw ingredient are shown in red. c, d We trained FoodProX, a random forest classifier over the nutrient concentrations within 100 g of each food, tasking it to predict its processing level according to NOVA. FoodProX represents each food by a vector of probabilities {pi}, capturing the likelihood of being classified as unprocessed (NOVA 1), processed culinary ingredients (NOVA 2), processed (NOVA 3), and ultra-processed (NOVA 4). The highest probability determines the final classification label, highlighted in a box on the right. The results shown are for an input list of 99 nutrients. Source data are provided in Source Data Figure 1a–d.xlsx.
Fig. 2
Fig. 2. NOVA classification and processing score.
a Visualization of the decision space of FoodProX via principal component analysis of the probabilities {pi}. The manual 4-level NOVA classification assigns unique labels to only 34.25% of the foods listed in FNDDS 2009–2010 (empty circles). The classification of the remaining foods remains unknown, or must be further decomposed into ingredients. The list of foods manually classified by NOVA is largely limited to the three corners of the phase space, foods to which the classifier assigns dominating probabilities. b FoodProX assigned NOVA labels to all foods in FNDDS 2009–2010. The symbols at the boundary regions indicates that for these foods the algorithm’s confidence in the classification is not high, hence a 4-class classification does not capture the degree of processing characterizing that food. For each food k, the processing score FProk represents the orthogonal projection (black dashed lines) of pk=(p1k,p2k,p3k,p4k) onto the line p1 + p4 = 1 (highlighted in dark red). c We ranked all foods in FNDDS 2009/2010 according to FPro. The measure sorts onion products in increasing order of processing, from “Onion, Raw'', to “Onion rings, from frozen''. d Distribution of FPro for a selection of the 155 Food Categories in What We Eat in America (WWEIA) 2015–2016 with at least 20 items (Section S2). WWEIA categories group together foods and beverages with similar usage and nutrient content in the US food supply. Sample sizes vary from a minimum of 21 data points for “Citrus fruits” to a maximum of 340 data points for “Fish''. For each box in the box plots, the minimum indicates the lower quartile, the central line represents the median, and the maximum corresponds to the upper quartile. The upper and lower whiskers represent data outside of the inter-quartile range. All categories are ranked in increasing order of median FPro, indicating that within each food group, we have remarkable variability in FPro, confirming the presence of different degrees of processing. We illustrate this through four ready-to-eat cereals, all manually classified as NOVA 4, yet with rather different FPro. While the differences in the nutrient content of Post Shredded Wheat 'n Bran (FPro = 0.5658) and Post Shredded Wheat (FPro = 0.5685) are minimal, with lower fiber content for the latter, the fortification with vitamins, minerals, and the addition of sugar, significantly increases the processing of Post Grape-Nuts (FPro = 0.9603), and the further addition of fats results in an even higher processing score for Post Honey Bunches of Oats with Almonds (FPro = 0.9999), showing how FPro ranks the progressive changes in nutrient content. Source data are provided in Source Data Figure 2a–d.xlsx.
None
Schematic overview of the link between FoodProX classifier and FPro score (a) To construct FoodProX, a labeled training dataset with NOVA classes and input nutrient information per 100 grams is first selected. FoodProX is then created as an ensemble voting system that includes five random forest classifiers, each trained on 4/5 of the stratified dataset. Food classification predictions are made based on the average probabilities per class across the five classifiers. (b) To calculate FPro for a specific food item, an input list of nutrients compatible with the trained FoodProX is required. For each classifier in the ensemble, FPro is calculated using Eq. (1), which enables us to estimate the average and standard deviation across the models. For further details see the Methods Section.
Fig. 3
Fig. 3. Health implications and food substitution.
For each of the 20,047 individuals in NHANES (1999–2006), 18+ years old with dietary records, we calculated the individual diet processing scores iFProWC. a The average number of unique dishes reported in the dietary interviews, highlighting two individuals A and B, with comparable number of dishes, 12.5 and 13 reported, respectively. b The distribution of average daily caloric intake, showing that individuals B and A have similar caloric intake of 1894 and 2016 kcal, respectively. c The distribution of iFProWC for NHANES, indicating that individuals A and B display significant differences in iFProWC, with B ’s diet relying on ultra-processed food (iFProWC = 0.9572), and A reporting simple recipes (iFProWC = 0.3981) (Figure S13). d We measured the association of various phenotypes with iFProWC, correcting for age, gender, ethnicity, socioeconomic status, BMI, and caloric intake (Section S4). We report the standardized β coefficient, quantifying the effect on each exposure when the Box-Cox transformed dietary scores increase by one standard deviation over the population. For continuous exposures the coefficients are fully standardized, while for logistic regression (disease phenotypes) we opted for partially standardized coefficients to help interpretability (Section S4). Each variable is color-coded according to β, positive associations shown in red, and negative associations in blue. For logistic regressions, p values are associated with two-sided Wald tests, while for multiple linear regressions, p values are determined by two-sided t tests. Here, we show a selection of the 209 variables surviving Benjamini-Hochberg FDR correction with α = 0.05 (*** adj p value < 0.001, ** adj p value < 0.01, * adj p value < 0.05) e Changes in iFProWC when one (orange) or up to ten (yellow) dishes are substituted with their less processed versions, following the prioritization rule defined in Eq. S8. f The impact of substituting different number of dishes on the odds of metabolic syndrome, concentrations of vitamin B12, vitamin C, and bisphenol A, showing that a minimal substitution strategy can significantly alter the health implications of ultra-processed food. Source data are provided in Source Data Figure 3a–f.xlsx.

References

    1. Tapsell LC, Neale EP, Satija A, Hu FB. Foods, nutrients, and dietary patterns: interconnections and implications for dietary guidelines. Adv. Nutr. 2016;7:445–454. doi: 10.3945/an.115.011718. - DOI - PMC - PubMed
    1. Willett W, et al. Food in the anthropocene: the EAT-Lancet Commission on healthy diets from sustainable food systems. Lancet. 2019;393:447–492. doi: 10.1016/S0140-6736(18)31788-4. - DOI - PubMed
    1. MyPyramid. https://www.fns.usda.gov/mypyramid.
    1. Choose My Plate. https://www.choosemyplate.gov.
    1. Fraanje, W. & Garnett, T. What is ultra-processed food? And why do people disagree about its utility as a concept? (Foodsource: building blocks). Encyclopedic Dictionary of Polymers 98–98 (2019).

Publication types