. 2023 Apr 21;14(1):2316.
doi: 10.1038/s41467-023-37994-9.

Igh and Igk loci use different folding principles for V gene recombination due to distinct chromosomal architectures of pro-B and pre-B cells

Affiliations

Igh and Igk loci use different folding principles for V gene recombination due to distinct chromosomal architectures of pro-B and pre-B cells

Louisa Hill et al. Nat Commun. .

Abstract

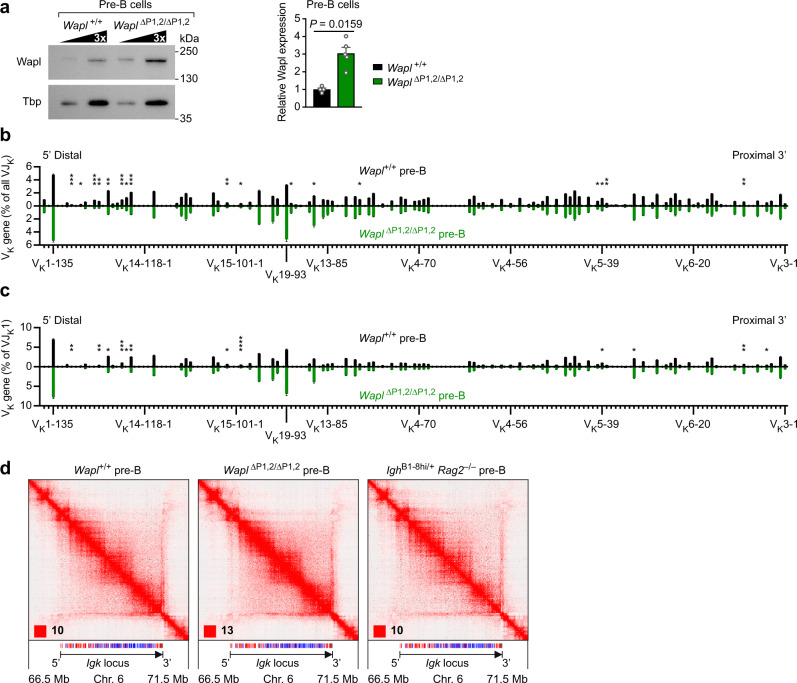
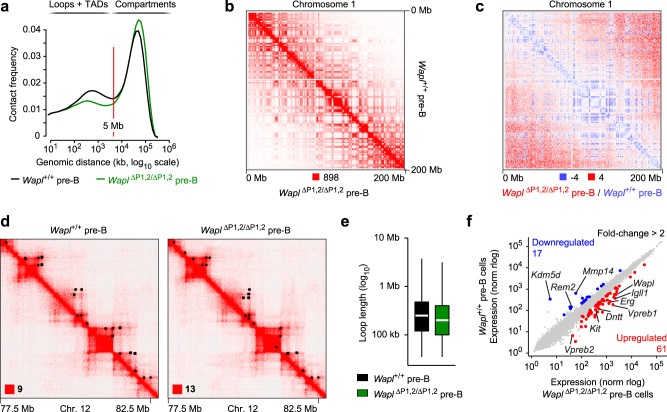
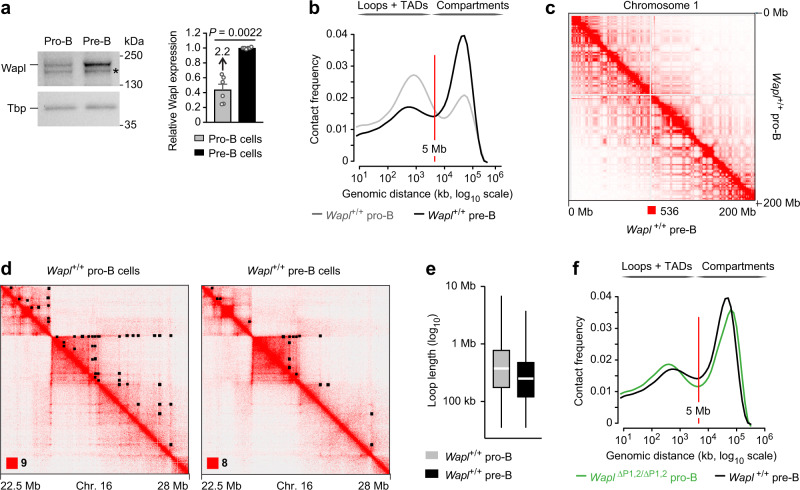
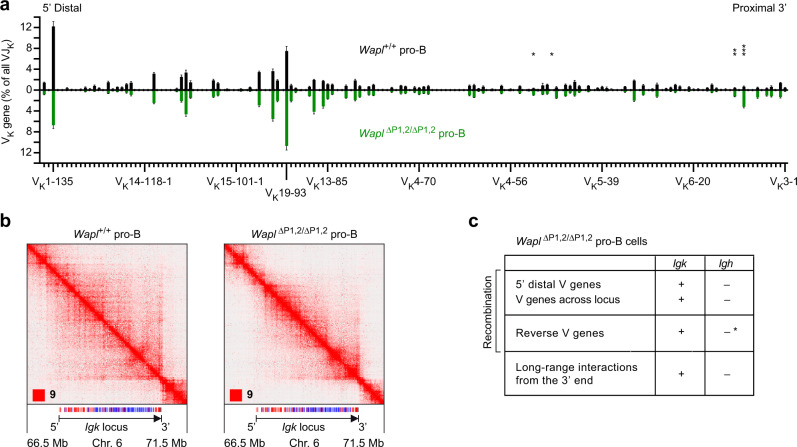
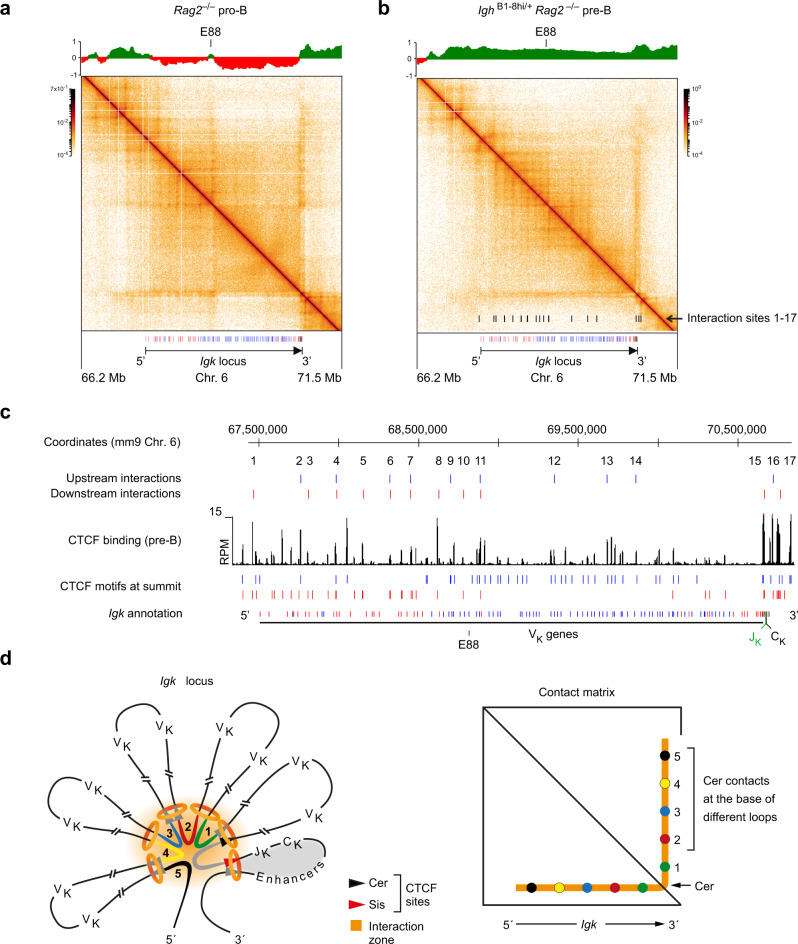
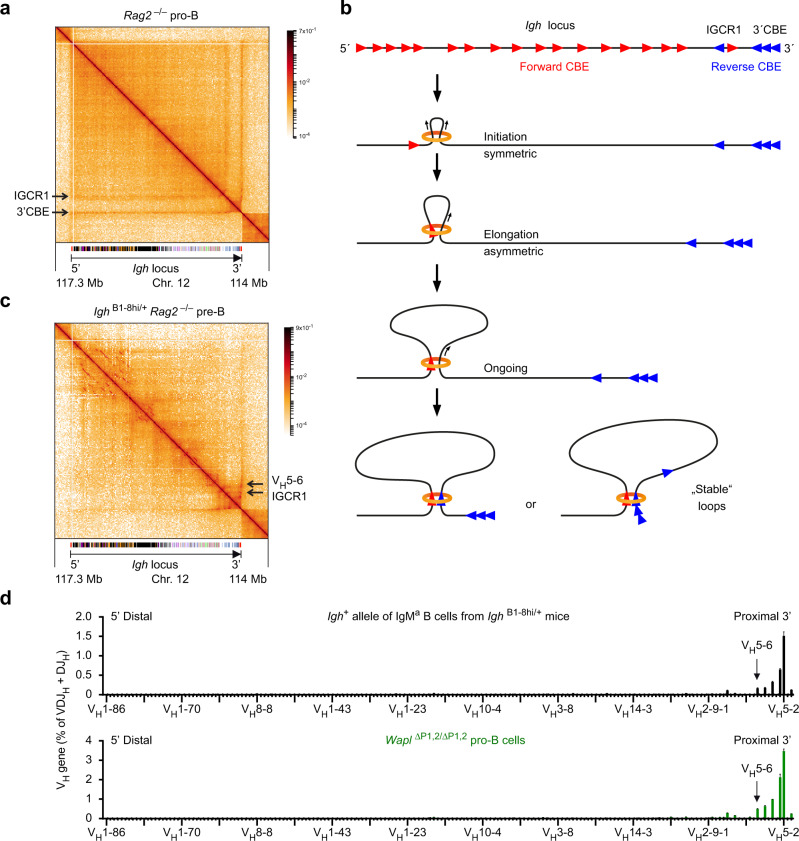
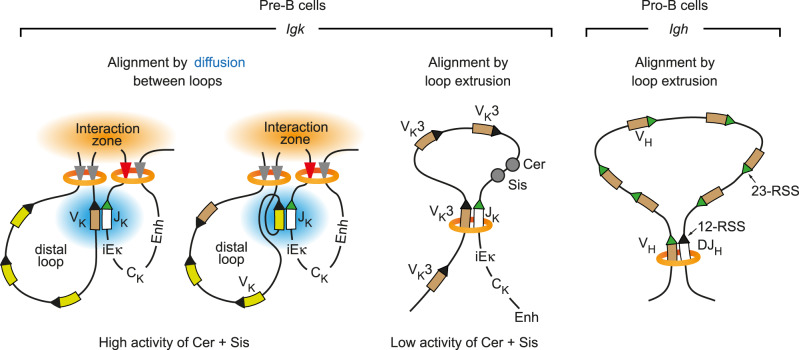
Extended loop extrusion across the immunoglobulin heavy-chain (Igh) locus facilitates VH-DJH recombination following downregulation of the cohesin-release factor Wapl by Pax5, resulting in global changes in the chromosomal architecture of pro-B cells. Here, we demonstrate that chromatin looping and VK-JK recombination at the Igk locus were insensitive to Wapl upregulation in pre-B cells. Notably, the Wapl protein was expressed at a 2.2-fold higher level in pre-B cells compared with pro-B cells, which resulted in a distinct chromosomal architecture with normal loop sizes in pre-B cells. High-resolution chromosomal contact analysis of the Igk locus identified multiple internal loops, which likely juxtapose VK and JK elements to facilitate VK-JK recombination. The higher Wapl expression in Igμ-transgenic pre-B cells prevented extended loop extrusion at the Igh locus, leading to recombination of only the 6 most 3' proximal VH genes and likely to allelic exclusion of all other VH genes in pre-B cells. These results suggest that pro-B and pre-B cells with their distinct chromosomal architectures use different chromatin folding principles for V gene recombination, thereby enabling allelic exclusion at the Igh locus, when the Igk locus is recombined.


Conflict of interest statement

The authors declare no competing interests.

Figures

Fig. 1
Fig. 1. Efficient VK-JK rearrangements and long-range interactions across the Igk locus upon high Wapl expression in Wapl∆P1,2/∆P1,2 pre-B cells.
a Wapl expression in ex vivo sorted pre-B cells from the bone marrow of Wapl+/+ (black) and Wapl∆P1,2/∆P1,2 (green) mice, as determined by immunoblot analysis of threefold serially diluted whole-cell extracts with antibodies detecting Wapl or the TATA-binding protein (Tbp; loading control). Marker proteins of the indicated size (in kilodaltons, kDa) are shown to the right. The quantification of four independent immunoblot experiments is indicated to the right. Statistical data are shown as mean values with SEM and were analyzed with the Student’s t-test (unpaired and two-tailed). b, c VK gene recombination analysis of ex vivo sorted Wapl+/+ and Wapl∆P1,2/∆P1,2 pre-B cells, as determined by VDJ-seq experiments. The VDJ-seq data obtained with Wapl+/+ (black) and Wapl∆P1,2/∆P1,2 (green) pre-B cells are shown in the upper and lower part, respectively. The recombination frequency of each VK gene is indicated as a percentage of all VK-JK (b) or only the VK-JK1 (c) rearrangements and is shown as mean value with SEM based on four independent VDJ-seq experiments for each pre-B cell type. The different VK genes (horizontal axis) are aligned according to their position in the Igk locus (Supplementary Data 1a). Statistical data were analyzed by multiple t-tests (unpaired and two-tailed) with Holm–Sidak correction; *P < 0.05, **P < 0.01, ***P < 0.001, ****P < 0.0001. d Hi-C contact matrices of the Igk region on chromosome 6, which were determined for ex vivo sorted Wapl+/+, Wapl∆P1,2/∆P1,2, and IghB1-8hi/+ Rag2–/– pre-B cells. The orientation and annotation of the Igk locus are shown. The intensity of each pixel represents the normalized number of contacts between a pair of loci. The maximum intensity is indicated in the lower left of each panel (red square). The following resolution of the Hi-C data was calculated as described in Methods; 6.65 kb (Wapl+/+ pre-B cells), 4.25 kb (Wapl∆P1,2/∆P1,2 pre-B cells), and 11.8 kb (IghB1-8hi/+ Rag2–/– pre-B cells). One of two Hi-C experiments performed with pre-B cells of each genotype is shown. The VDJ-seq and Hi-C-seq data are further described in Supplementary Data 3. Source data are provided in the Source Data file.
Fig. 2
Fig. 2. Minor differences in the chromosomal architecture of Wapl+/+ and Wapl∆P1,2/∆P1,2 pre-B cells.
a Frequency distribution of intrachromosomal contacts as a function of the genomic distance using logarithmically increased genomic distance bins, determined by Hi-C analysis of ex vivo sorted Wapl+/+ (black) and Wapl∆P1,2/∆P1,2 (green) pre-B cells using HOMER (see Methods). b Hi-C contact matrices of chromosome 1, determined for ex vivo sorted Wapl+/+ and Wapl∆P1,2/∆P1,2 pre-B cells and plotted at a 500-kb bin resolution with Juicebox. The intensity of each pixel represents the normalized number of contacts between a pair of loci. The maximum pixel intensity is indicated below (red square). c Differential Hi-C contact matrix of chromosome 1 displaying the difference in pixel intensity between Wapl+/+ pre-B and Wapl∆P1,2/∆P1,2 pre-B cells as the ratio (Wapl∆P1,2/∆P1,2)/(Wapl+/+). More interactions (blue) in the TAD range were observed for Wapl+/+ pro-B cells, while more interactions (red) in the compartment range were detected for Wapl∆P1,2/∆P1,2 pre-B cells. d Hi-C contact matrices of a zoomed-in region on chromosome 12 (mm9; 77,500,000–82,500,000), shown for Wapl+/+ and Wapl∆P1,2/∆P1,2 pre-B cells. Black dots indicate loop anchors identified with Juicebox. The maximum pixel intensity is indicated in the lower left of the panel (red square). e Distribution of the loop length (in kb). White lines indicate the median and boxes represent the middle 50% of the data. Whiskers denote all values of the 1.5× interquartile range. The median loop length is 250 kb in Wapl+/+ pre-B cells (black) and 200 kb in Wapl∆P1,2/∆P1,2 pre-B cells (green). f Scatterplot of gene expression differences between Wapl∆P1,2/∆P1,2 and Wapl+/+ pre-B cells isolated from the bone marrow of the respective mice. Genes upregulated (red) or downregulated (blue) in Wapl∆P1,2/∆P1,2 pre-B cell compared with Wapl+/+ pre-B cells were analyzed with DESeq2 and defined by an expression difference of >2-fold, an adjusted P value of <0.05 and a TPM value of >5 in at least one of the two pre-B cell types (Supplementary Data 2). Two RNA-seq experiments were performed with ex vivo sorted pre-B cells of each genotype.
Fig. 3
Fig. 3. Wild-type pro-B and pre-B cells strongly differ in their chromosomal architecture.
a Wapl protein expression in ex vivo sorted Rag2–/– pro-B (gray) and wild-type pre-B (black) cells from the bone marrow, as determined by immunoblot analysis of whole-cell extracts with antibodies detecting Wapl or Tbp (loading control). Marker proteins of the indicated size (in kilodaltons, kDa) are shown to the right. A non-specific band is indicated by an asterisk. One of 5 independent experiments is shown, and the quantification of all immunoblot experiments is indicated to the right. Statistical data are shown as mean values with SEM and were analyzed with the Student’s t-test (unpaired and two-tailed). b Comparison of the frequency distribution of intrachromosomal contacts between pro-B and pre-B cells of Wapl+/+ mice. The frequency distribution of intrachromosomal contacts was determined as a function of the genomic distance using logarithmically increased genomic distance bins, based on the Hi-C data of Wapl+/+ pre-B cells (black, this study) and published Hi-C data of short-term cultured Wapl+/+ pro-B cells (gray). c Hi-C contact matrices of chromosome 1, determined for Wapl+/+ pro-B and Wapl+/+ pre-B cells, were plotted at a 500-kb bin resolution with Juicebox. The maximum pixel intensity is indicated below (red square). d Hi-C contact matrices of a zoomed-in region on chromosome 16 (mm9; 22,500,000–28,000,000), shown for Wapl+/+ pro-B and pre-B cells. Black dots indicate loop anchors identified with Juicebox. e Distribution of the loop length (in kb) in Wapl+/+ pro-B (gray) and pre-B (black) cells. White lines indicate the median and boxes represent the middle 50% of the data. Whiskers denote all values of the 1.5× interquartile range. The median loop length is 375 kb in Wapl+/+ pro-B cells and 250 kb in Wapl+/+ pre-B cells. f Comparison of the frequency distribution of intrachromosomal contacts between Wapl+/+ pre-B cells (black) and Wapl∆P1,2/∆P1,2 pro-B cells (green), as described in (b). Source data are provided in the Source Data file.
Fig. 4
Fig. 4. VK-JK recombination at the Igk locus in Waplhigh and Wapllow pro-B cells.
a VK gene recombination analysis of ex vivo sorted Wapl+/+ (Wapllow; black) and Wapl∆P1,2/∆P1,2 (Waplhigh; green) pro-B cells, as determined by VDJ-seq experiments. The recombination frequency of each VK gene is indicated as a percentage of all VK-JK rearrangement events and is shown as a mean value with SEM based on six independent VDJ-seq experiments for each pro-B cell type. The different VK genes (horizontal axis) are aligned according to their position in the Igk locus (Supplementary Data 1a). Statistical data were analyzed by multiple t-tests (unpaired and two-tailed) with Holm–Sidak correction; *P < 0.05, **P < 0.01, ***P < 0.001. b Hi-C contact matrices of the Igk region on chromosome 6 based on published Hi-C data of short-term cultured Wapl+/+ and Wapl∆P1,2/∆P1,2 pro-B cells. The orientation and annotation of the Igk locus are shown. The resolution of the Hi-C data was 6.7 and 7.25 kb for the Wapl+/+ and Wapl∆P1,2/∆P1,2 pro-B cells, respectively. c Differences in V gene recombination and long-range interactions between the Igh and Igk locus in Wapl∆P1,2/∆P1,2 pro-B cells, based on the data shown in Fig. 4 and published data. The loss of recombination of VH genes upon their inversion (indicated by an asterisk) in the Igh locus was analyzed in IghV8-8-inv/V8-8-inv and Igh∆890/∆890 pro-B cells and upon inversion of the entire VH gene cluster in v-Abl immortalized pro-B cells. Source data are provided in the Source Data file.
Fig. 5
Fig. 5. High-resolution mapping of loop interactions at the Igk locus in Rag2-deficient pro-B and pre-B cells.
a, b Contact matrices of the Igk region (on chromosome 6) in ex vivo sorted Rag2–/– pro-B cells (a) and IghB1-8hi/+ Rag2–/– pre-B cells (b). The interaction data were determined by Micro-C analysis, and are displayed at a 10-kb bin resolution with the HiGlass visualization tool. Each dot on the contact matrix represents the contact intensity between a pair of nucleosomes according to the density scale shown. White lines denote regions that could not be mapped due to too low contact density. The annotation and orientation of the Igk locus are shown below. The PC1 (eigenvector) values, which define the compartments A (green) and B (red), are shown above the contact matrices together with the location of the E88 enhancer. The locations of the contact sites that generate the different stripes at the Igk locus are indicated as black bars at the bottom of the contact matrix of IghB1-8hi/+ Rag2–/– pre-B cells (b). c Location of the mapped loop anchors at the Igk locus in IghB1-8hi/+ Rag2–/– pre-B cells. The anchor sites of loops facing upstream (blue) or downstream (red) in the Igk locus of pre-B cells were determined with the Cross-score program, as described in detail in Supplementary Fig. 7, and are shown above the CTCF ChIP-seq track and the annotation of the forward (red)- and reverse (blue)-oriented CBEs. d Schematic diagram explaining the looping organization of the Igk locus. Due to the presence of forward and reverse CBEs along the VK gene cluster, multiple different loops are formed, which leads to the collision of cohesin rings (orange) in response to ongoing loop extrusion. As a consequence, a transient interaction zone (orange) is formed that juxtaposes DNA sequences (1–5) at the base of these loops next to DNA sequences (gray) of the Cer region, which facilitates their crosslinking and defines specific interactions along the stripe emanating from the Cer region in the Micro-C data. Due to the high Wapl expression in pre-B cells, loops constantly turn over so that new loops present different DNA sequences in the interaction zone (see Supplementary Movie 1), which results in a contiguous stripe consisting of all possible interactions along the VK gene cluster. The orientation of CBEs in the VK gene region is indicated by gray arrowheads, while the CBEs at Cer and Sis are shown in black and red, respectively. The relatively stable “regulatory” loop containing the JK, CK, and Igk enhancer elements is indicated by gray shading.
Fig. 6
Fig. 6. High density of interactions across the VH gene cluster in pro-B cells and decontraction of the Igh locus in pre-B cells.
a Contact matrix of the Igh region (on chromosome 12) in ex vivo sorted Rag2–/– pro-B cells. The interaction data were generated by Micro-C analysis and are displayed at a 10-kb bin resolution with the HiGlass visualization tool. Each dot on the contact matrix represents the contact intensity between a pair of nucleosomes, as displayed according to the density scale shown. White lines denote regions that could not be mapped due to low contact density. The annotation and orientation of the Igh locus is shown below. The stripes corresponding to interactions from the 3’CBE or IGCR1 region are indicated. b Schematic diagram explaining the chromatin looping at the Igh locus in pro-B cells. The forward CBEs (red arrowheads) in the VH gene region are shown together with the reverse CBEs (blue arrowheads) at the IGCR1 and 3’CBE elements. Loop extrusion, upon random initiation in the VH gene cluster, proceeds first in a symmetrical manner, until the cohesin ring (orange) interacts with a CTCF protein bound to the next upstream forward CBE, which leads to stabilized binding of cohesin at this site. Thereafter, asymmetric loop extrusion reels the DNA of the downstream Igh regions into the loop, until it is halted by a CTCF protein bound to a reverse CBE in convergent orientation at the IGCR1 or 3’CBE elements. c Contact matrix of the Igh region in ex vivo sorted IghB1-8hi/+ Rag2–/– pre-B cells. See a for an explanation. The position of the IGCR1 element is indicated together with the location of the VH5-6 gene. d Upper part: VDJ-seq data obtained with sorted immature IgMa B cells from IghB1-8hi/+ (black) mice (Supplementary Fig. 8e). Only the VH gene reads originating from the Igh+ allele are shown, as the reads of the 5′ distal VH1-72 (B1-8hi) gene originating from the IghB1-8hi allele were eliminated together with the reads that mapped to the related VH1–53 gene exhibiting high sequence similarity to the VH1–72 gene. The recombination frequency of each VH gene is indicated as a percentage of all VDJH and DJH rearrangements and is shown as a mean value with SEM based on eight independent VDJ-seq experiments. The different VH genes (horizontal axis) are aligned according to their position in the Igh locus (Supplementary Data 1b). d Lower part: The published VH gene recombination pattern of Wapl∆P1,2/∆P1,2 pro-B cells is shown as reference data in green. The recombination frequency of the VH5-2 (VH81X) gene was 1.5% (1 Igh+ allele) in IgMa IghB1-8hi/+ B cells and 3.5% (2 Igh+ alleles) in Wapl∆P1,2/∆P1,2 pro-B cells. Source data are provided in the Source Data file.
Fig. 7
Fig. 7. Different folding principles leading to convergent alignment of RSS sequences at the Igk and Igh loci.
Schematic diagrams depict the different folding principles leading to a convergent alignment of RSS sequences during V gene recombination at the Igk and Igh loci. The convergent orientation of the 12-RSS (recognition signal sequence with a 12-bp spacer, black arrowhead) of the VK genes or DH segment and the 23-RSS (with a 23-bp spacer, green arrowhead) of the JK element or VH genes is essential for mediating RAG-dependent cleavage and recombination. Cohesin (orange)-mediated loop extrusion across the entire Igh locus is responsible for the convergent alignment of the RSS sequences of VH genes and the DJH-rearranged segment prior to RAG-mediated cleavage and recombination in pro-B cells (right). Similarly, the forward-oriented members of the most 3’ proximal VK3 gene family could be convergently aligned with a JK element by loop extrusion under conditions where the insulating activity of Cer and Sis is reduced or lost (middle). All other VK genes can undergo convergent alignment with a JK element only by local diffusion (blue), once these elements are brought into close proximity at the interaction zone (orange), which is generated by the collision of multiple loops leading to contraction of the VK gene region (left). Enh, 3′Eκ and Edκ enhancers.

Similar articles

Cited by

References

    1. Dekker J, Mirny L. The 3D genome as moderator of chromosomal communication. Cell. 2016;164:1110–1121. doi: 10.1016/j.cell.2016.02.007. - DOI - PMC - PubMed
    1. Davidson IF, Peters J-M. Genome folding through loop extrusion by SMC complexes. Nat. Rev. Mol. Cell Biol. 2021;22:445–464. doi: 10.1038/s41580-021-00349-7. - DOI - PubMed
    1. Zhang Y, Zhang X, Dai HQ, Hu H, Alt FW. The role of chromatin loop extrusion in antibody diversification. Nat. Rev. Immunol. 2022;22:550–566. doi: 10.1038/s41577-022-00679-3. - DOI - PMC - PubMed
    1. Lieberman-Aiden E, et al. Comprehensive mapping of long-range interactions reveals folding principles of the human genome. Science. 2009;326:289–293. doi: 10.1126/science.1181369. - DOI - PMC - PubMed
    1. Rao SS, et al. A 3D map of the human genome at kilobase resolution reveals principles of chromatin looping. Cell. 2014;159:1665–1680. doi: 10.1016/j.cell.2014.11.021. - DOI - PMC - PubMed

Publication types

MeSH terms