. 2023 Apr 21;14(1):2307.
doi: 10.1038/s41467-023-37952-5.

The small and large intestine contain related mesenchymal subsets that derive from embryonic Gli1+ precursors

Affiliations

The small and large intestine contain related mesenchymal subsets that derive from embryonic Gli1+ precursors

Simone Isling Pærregaard et al. Nat Commun. .

Abstract

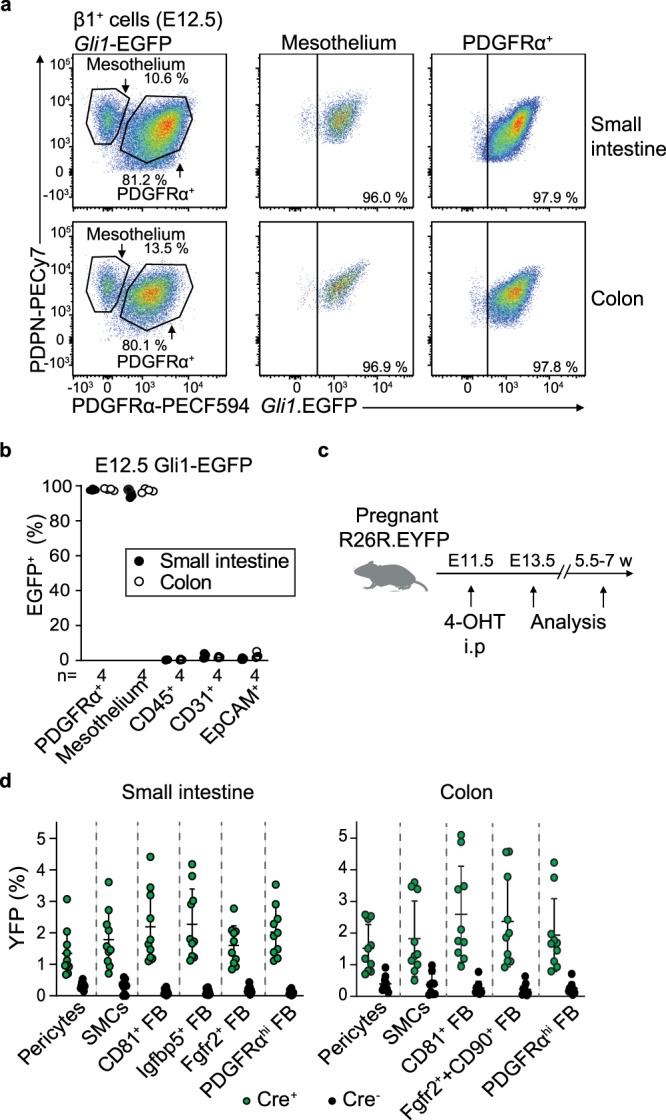
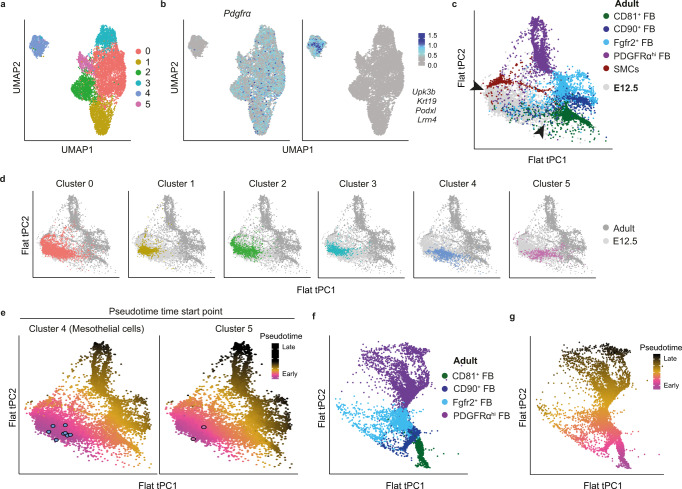
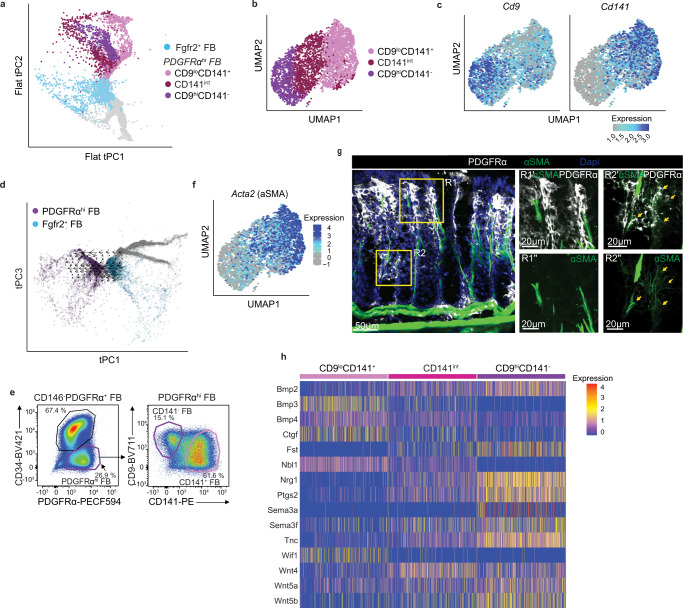
The intestinal lamina propria contains a diverse network of fibroblasts that provide key support functions to cells within their local environment. Despite this, our understanding of the diversity, location and ontogeny of fibroblasts within and along the length of the intestine remains incomplete. Here we show that the small and large intestinal lamina propria contain similar fibroblast subsets that locate in specific anatomical niches. Nevertheless, we find that the transcriptional profile of similar fibroblast subsets differs markedly between the small intestine and colon suggesting region specific functions. We perform in vivo transplantation and lineage-tracing experiments to demonstrate that adult intestinal fibroblast subsets, smooth muscle cells and pericytes derive from Gli1-expressing precursors present in embryonic day 12.5 intestine. Trajectory analysis of single cell RNA-seq datasets of E12.5 and adult mesenchymal cells suggest that adult smooth muscle cells and fibroblasts derive from distinct embryonic intermediates and that adult fibroblast subsets develop in a linear trajectory from CD81+ fibroblasts. Finally, we provide evidence that colonic subepithelial PDGFRαhi fibroblasts comprise several functionally distinct populations that originate from an Fgfr2-expressing fibroblast intermediate. Our results provide insights into intestinal stromal cell diversity, location, function, and ontogeny, with implications for intestinal development and homeostasis.


Conflict of interest statement

SB has ownerships in Intomics A/S, Hoba Therapeutics Aps, Novo Nordisk A/S, Lundbeck A/S, ALK abello A/S and managing board memberships in Proscion A/S and Intomics A/S. The remaining authors declare no competing interests.

Figures

Fig. 1
Fig. 1. Intestinal MSC subsets are broadly conserved across intestinal segments.
a, b Uniform Manifold Approximation and Projection (UMAP) colored by unsupervised Louvain clustering of murine small intestinal (a) and colonic (b) MSC. Results are from 2 independent experiments/organ with 3 pooled mice/experiment. c Pearson correlations between averaged cluster expressions of Louvain clusters from small intestinal and colonic MSC based on 1301 overlapping variable genes. Unsupervised hierarchical clustering indicates similarity of subsets within each tissue. dh Immunohistochemical staining (d, f, h) or RNA-scope analysis (e, g) of mouse ileum (d, e) or colon (fh). R, region; R′ represents magnifications of R quadrants (yellow squares). d Arrows indicate location of CD81+ FB (CD81+CD34+CD31 cells) and stars, location of Igfbp5+ FB (CD81CD34+CD31 cells). e Arrows indicate location of (R1′) Cxcl14+Fgfr2+ FB (Cxcl14+Fgfr2+PDPN+ cells) and (R2′ and R3′) Fgfr2+ FB (Fgfr2+PDPN+ cells). f Arrows indicate location of CD90+ FB (PPARγ+CD34+CD31 cells). g Arrows indicate location of Fgfr2+ FB (Fgfr2+PDPN+ cells). h Arrows indicate location of CD81+ FB (CD81+CD34+CD31 cells). dh Results are representative of 3 independent experiments. i Summary of FB subset location within the small intestinal and colonic lamina propria. SMC, smooth muscle cell. See also Supplementary Fig. 1.
Fig. 2
Fig. 2. Despite similar FB subset composition, small intestinal and colonic FB display regional transcriptional specialization.
a Heatmaps showing transcription levels (integrated data) of selected epithelial support genes by indicated MSC subsets. b Pearson correlations between averaged cluster expressions of Louvain clusters from scRNA-seq and bulk RNA-seq datasets based on 1937 (small intestine, left) and 1925 (colon, right) overlapping variable genes. Bulk RNA-seq data are from sorted MSC subsets from 3 independent experiments. Unsupervised hierarchical clustering indicates similarities of bulk RNA-seq subsets within each tissue. c, d Flow cytometric analysis of adult small intestinal (c) and colonic (d) Itgβ1+ MSCs from Ackr4.GFP mice. Representative staining from 2 experiments with 2–4 mice/experiment. Colored gates represent indicated MSC subsets. PCs pericytes, SMCs smooth muscle cells, FB fibroblast. e Principal component analysis (PCA) of bulk RNA-seq data from indicated sorted FB populations. Results are from 3 independent sorts/population. f Volcano plots showing differentially expressed genes (DEGs) between small intestinal and colonic PDGFRαhi FB (left) and Fgfr2+ FB (right). Dotted horizontal line denotes significant adjusted p value (Benjamini–Hochberg correction) of 0.05, vertical dotted lines denote log2FC = 0 and the log2FC of ±1.5. gj Heatmap representations of averaged transcription levels of indicated genes within sorted FB subsets. Data are averaged from 3 independent bulk RNA-seq datasets. g Epithelial support genes, h cytokines and cytokine receptors, i chemokines, j vitamin A metabolism. Gene lists for i were selected based on the epithelial support list in (a) while those in hj were differentially expressed between either small intestinal and colonic PDGFRαhi FB or between small intestinal and colonic Fgfr2+ FB. Identified DEG that are 1.5 < |log2FC| are listed to the right of (g) or below (hj) the heatmaps and. See also Supplementary Fig. 2.
Fig. 3
Fig. 3. Adult intestinal MSC subsets derive from intestinal precursors present in E12.5 intestine.
a, b Flow cytometric analysis of Itgβ1+ MSCs isolated from indicated organs on embryonic day (E) 12.5. b Right hand plots show expression of DPP4 (CD26) on gated PDPN+PDGFRα (blue) and PDPN+PDGFRα+ (red) cells from plots on left. Data are representative of a 4 experiments with 2–8 embryos/experiment, or b 3 experiments with 6–8 individual embryos. c Workflow of transplantation of E12.5 intestine from YFP+ mice under the kidney capsule of WT recipients. d Flow cytometric analysis of YFP+Itgβ1+ MSC in intestinal grafts 4 weeks after transplantation. Results are representative of 2 experiments with 4 (small intestine) or 2–3 (colon) grafts/experiment. e UMAP dimensionality reduction of scRNA-seq data colored by Louvain clustering from FACS purified YFP+Itgβ1+ MSC isolated from colonic grafts 4 weeks after transplantation. Data are from 8624 single cells from 3 pooled colonic grafts with an average of 2223 genes/cell. f Pearson correlations of averaged gene expression in colonic graft and adult colon MSC clusters based on 1486 overlapping variable genes. g Heatmap showing transcription levels (integrated data) of selected epithelial support genes within the putative corresponding FB clusters identified in (e). See also Supplementary Fig. 3.
Fig. 4
Fig. 4. Adult intestinal MSC derive from Gli1+ embryonic precursors.
a Representative flow cytometric analysis and b proportions of indicated cells expressing EGFP in the small intestine and colon of embryonic E12.5 Gli1-EGFP mice. Results are from 8 individual embryos, with each circle representing an individual embryo. c Workflow of lineage-tracing experiments. R26R.EYFP females were mated overnight with Gli1.CreERT2+/− males and pregnant dams injected i.p. with 4-hydroxytamoxifen (4-OHT) at E11.5. d Proportions of indicated MSC subset expressing YFP in small intestine and colon of 5.5–7-week-old Gli1.CreERT2+/−.R26R.EYFP (Cre+) and R26R.EYFP (Cre) littermates. Results are pooled from 4 independent experiments with 10 Cre+ mice and 11 Cre mice. Each circle represents an individual mouse. Bars represent the means and SD. See also Supplementary Fig. 4. Source data are provided as a Source Data file.
Fig. 5
Fig. 5. Trajectory analysis indicates that adult intestinal FB subsets develop in a linear fashion from embryonic Gli1+ precursors.
a UMAP dimensionality reduction of scRNA-seq data colored by Louvain clustering from FACS purified Itgβ1+ MSC from the colon of embryonic day E12.5 mice. Data are from 9632 single cells from 2 pooled experiments using 3–5 embryonic colons/experiment, with an average of 2521 genes/cell. b UMAP of E12.5 large intestinal Itgβ1+ MSC overlaid with expression of Pdgfra or the indicated mesothelium associated genes. c, d tSPACE principal component analysis (tPC1–3) projection of pooled adult colonic and E12.5 large intestinal MSC embedded into 2D space. c Adult clusters are color coded as indicated, while E12.5 clusters are in gray. Arrow heads indicate connections between embryonic and adult clusters. d Location of indicated E12.5 clusters on tPC projections of adult (dark gray) and embryonic (light gray) MSC. e Pseudotime analysis using averaged values of the 9 trajectory starting points (highlighted blue cells) in embryonic Cluster 4 (mesothelial cells, left panel) or 2 trajectory starting points (highlighted pink cells) in embryonic Cluster 5 (right panel) superimposed on the tPC projection. f tSPACE projections of indicated adult colonic MSC in tPC1–3 embedded into 2D space and g pseudotime analysis superimposed on (f) using averaged values of the 215 trajectories starting in CD81+ FB. See also Supplementary Fig. 5.
Fig. 6
Fig. 6. Colonic PDGFRαhi FB may arise directly from Fgfr2+ FB and consist of three transcriptionally distinct clusters.
a tSPACE projection of colonic MSC in tPC1–3 embedded into 2D space, highlighting Fgfr2+ FB, together with three PDGFRαhi FB clusters. b UMAP dimensionality reduction of re-clustered colonic PDGFRαhi FB depicting the three indicated subclusters and c expression of Cd9 (left panel) and Cd141 (right panel) overlaid onto the UMAP in (b). d tSPACE projection of adult colonic MSC in tPC1 and 3, highlighting Fgfr2+ FB and PDGFRαhi FB overlaid with RNA velocity estimates. e Representative flow cytometric analysis of CD9 and CD141 expression by colonic PDGFRαhi FB. Representative plots from 2 experiments with 3 mice/experiment. f Acta2 (αSMA) gene expression projected onto UMAP of colonic PDGFRαhi FB in (b). g Immunohistochemical staining of colonic tissue for indicated antigens. R1′,″ and R2′,″ represent magnifications of R1 and R2 quadrants (yellow squares) on left image. Results are representative stains from 3 experiments with 3 mice/experiment. Arrows indicate αSMA+PDGFRαhi FB. h Heatmap showing transcription levels (integrated data) of significantly (p < 0.05) differentially expressed epithelial support genes between the PDGFRαhi FB clusters. See also Supplementary Fig. 6.

Similar articles

Cited by

References

    1. Mowat AM, Agace WW. Regional specialization within the intestinal immune system. Nat. Rev. Immunol. 2014;14:667–685. doi: 10.1038/nri3738. - DOI - PubMed
    1. Agace WW, McCoy KD. Regionalized development and maintenance of the intestinal adaptive immune landscape. Immunity. 2017;46:532–548. doi: 10.1016/j.immuni.2017.04.004. - DOI - PubMed
    1. Parikh, K. et al. Colonic epithelial cell diversity in health and inflammatory bowel disease. Nature1, 10.1038/s41586-019-0992-y (2019). - PubMed
    1. Barker N. Adult intestinal stem cells: Critical drivers of epithelial homeostasis and regeneration. Nat. Rev. Mol. Cell Biol. 2014;15:19–33. doi: 10.1038/nrm3721. - DOI - PubMed
    1. Kinchen J, et al. Structural remodeling of the human colonic mesenchyme in inflammatory bowel disease. Cell. 2018;175:372–386.e17. doi: 10.1016/j.cell.2018.08.067. - DOI - PMC - PubMed

Publication types

MeSH terms

Substances