

Association between bone marrow lesions and bone mineral density of the proximal tibia in end-stage osteoarthritic knees
- PMID: 37085519
- PMCID: PMC10121646
- DOI: 10.1038/s41598-023-33251-7
Association between bone marrow lesions and bone mineral density of the proximal tibia in end-stage osteoarthritic knees
Abstract
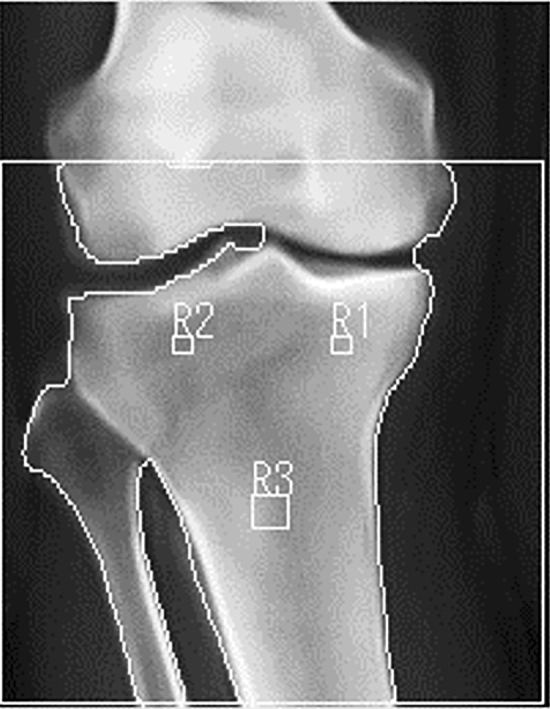
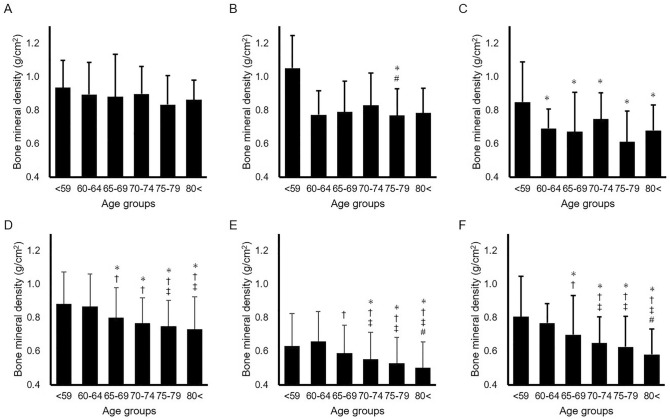
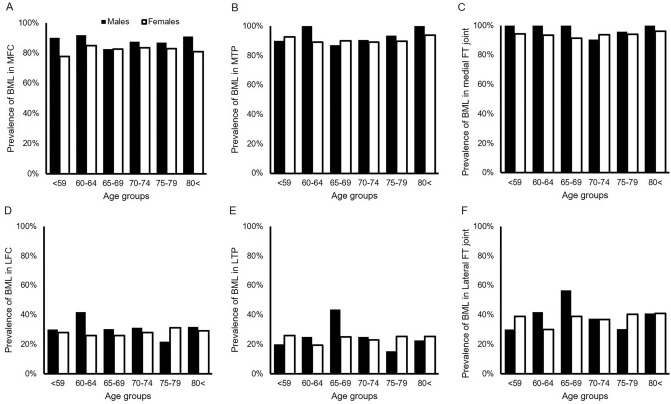
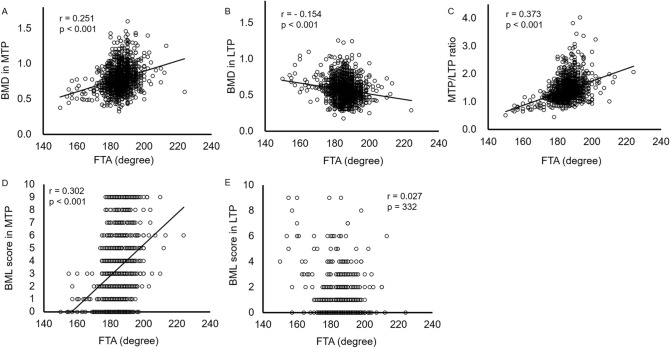
This retrospective cross-sectional study investigated the association between bone marrow lesions (BMLs) and bone mineral density (BMD) in the proximal tibia of end-stage osteoarthritic knees from a large patient sample. Overall, 1308 end-stage osteoarthritic knees were enrolled before total knee arthroplasty. The preoperative range of motion was recorded. Bone mineral density in the medial tibial plateau (MTP), lateral tibial plateau (LTP), and metaphysis were measured using dual-energy X-ray absorptiometry. The MTP/LTP, MTP/metaphysis, and LTP/metaphysis ratios were calculated. BMLs were scored using a whole-organ magnetic resonance imaging scoring system. The relationship between BMD and BML scores was investigated using linear regression analysis. The highest BMD was 0.787 ± 0.176 g/cm2 at the MTP, followed by 0.676 ± 0.180 g/cm2 and 0.572 ± 0.145 g/cm2 at the metaphysis and LTP, respectively. The prevalence of BMLs was 90.4% and 24.2% in the MTP and LTP, respectively. In women, higher BML scores at the MTP were positively correlated with the BMD of the MTP (p < 0.001, r = 0.278), MTP/LTP (p < 0.001, r = 0.267), and MTP/metaphysis ratios (p < 0.001, r = 0.243). Regression analysis showed that higher BML scores in the MTP were correlated with higher BMD in the MTP (p < 0.001) and lower BMD in the LTP (p < 0.001). High BML scores in the MTP were positively associated with high BMD in the MTP, which also induced the medial to lateral imbalance of BMD in the proximal tibia.
© 2023. The Author(s).
Conflict of interest statement
The authors declare no competing interests.
Figures

Similar articles
-
Symptomatic bone marrow lesions induced by reduced bone mineral density in middle-aged women: a cross-sectional Japanese population study.Arthritis Res Ther. 2019 May 6;21(1):113. doi: 10.1186/s13075-019-1900-4. Arthritis Res Ther. 2019. PMID: 31060629 Free PMC article.
-
Bone marrow lesion volume reduction is not associated with improvement of other periarticular bone measures: data from the Osteoarthritis Initiative.Arthritis Res Ther. 2013;15(5):R153. doi: 10.1186/ar4336. Arthritis Res Ther. 2013. PMID: 24432365 Free PMC article.
-
Bone marrow lesion severity was associated with proximal tibial inclination in early knee osteoarthritis.Knee Surg Sports Traumatol Arthrosc. 2022 Feb;30(2):668-679. doi: 10.1007/s00167-020-06378-7. Epub 2021 Jan 4. Knee Surg Sports Traumatol Arthrosc. 2022. PMID: 33394079
-
Bone marrow lesions in the knee are associated with increased local bone density.Arthritis Rheum. 2005 Sep;52(9):2814-21. doi: 10.1002/art.21290. Arthritis Rheum. 2005. PMID: 16145676
-
The Location and Severity of Preoperative Subchondral Bone Marrow Lesions Were Not Associated With Inferior Postoperative Outcomes After Medial Unicompartmental Knee Arthroplasty or Total Knee Arthroplasty.J Arthroplasty. 2016 Nov;31(11):2476-2480. doi: 10.1016/j.arth.2016.05.009. Epub 2016 May 11. J Arthroplasty. 2016. PMID: 27286910
References
MeSH terms
LinkOut - more resources
Full Text Sources
Medical
