

Multi-omics signatures in new-onset diabetes predict metabolic response to dietary inulin: findings from an observational study followed by an interventional trial
- PMID: 37085526
- PMCID: PMC10121613
- DOI: 10.1038/s41387-023-00235-5
Multi-omics signatures in new-onset diabetes predict metabolic response to dietary inulin: findings from an observational study followed by an interventional trial
Abstract
Aim: The metabolic performance of the gut microbiota contributes to the onset of type 2 diabetes. However, targeted dietary interventions are limited by the highly variable inter-individual response. We hypothesized (1) that the composition of the complex gut microbiome and metabolome (MIME) differ across metabolic spectra (lean-obese-diabetes); (2) that specific MIME patterns could explain the differential responses to dietary inulin; and (3) that the response can be predicted based on baseline MIME signature and clinical characteristics.
Method: Forty-nine patients with newly diagnosed pre/diabetes (DM), 66 metabolically healthy overweight/obese (OB), and 32 healthy lean (LH) volunteers were compared in a cross-sectional case-control study integrating clinical variables, dietary intake, gut microbiome, and fecal/serum metabolomes (16 S rRNA sequencing, metabolomics profiling). Subsequently, 27 DM were recruited for a predictive study: 3 months of dietary inulin (10 g/day) intervention.
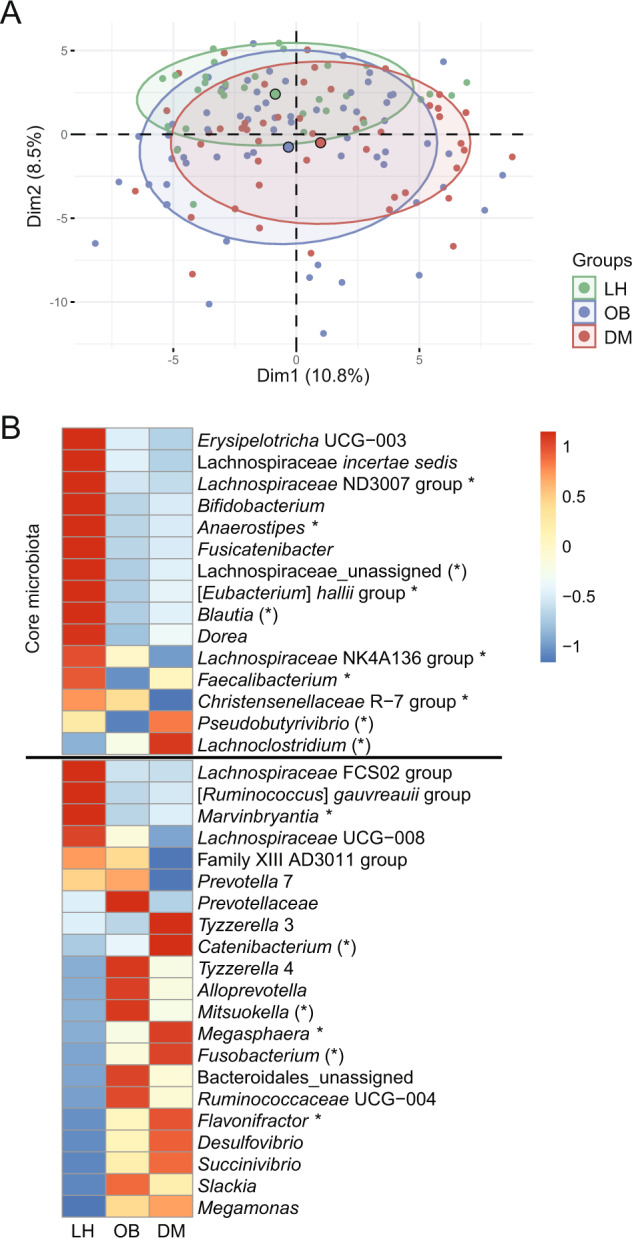
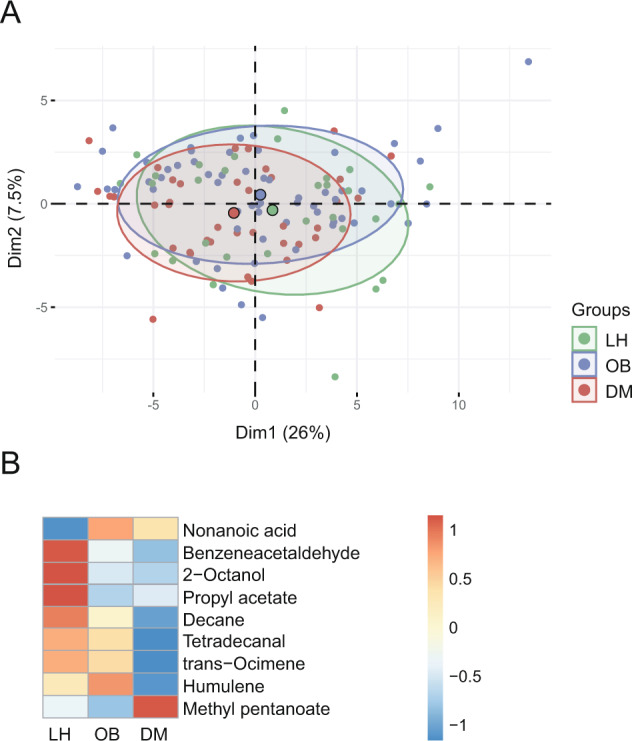
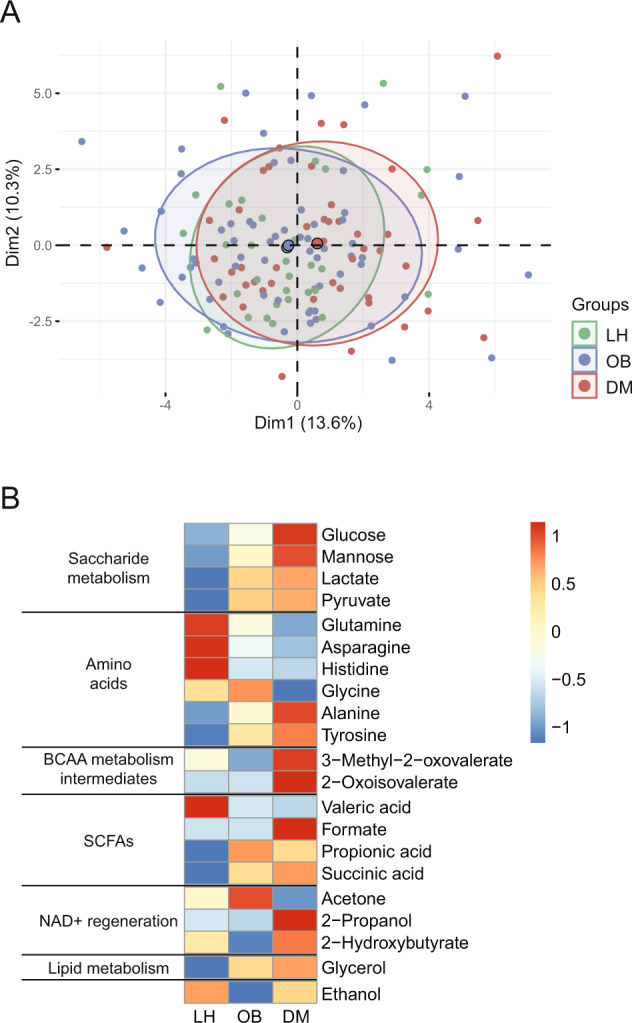
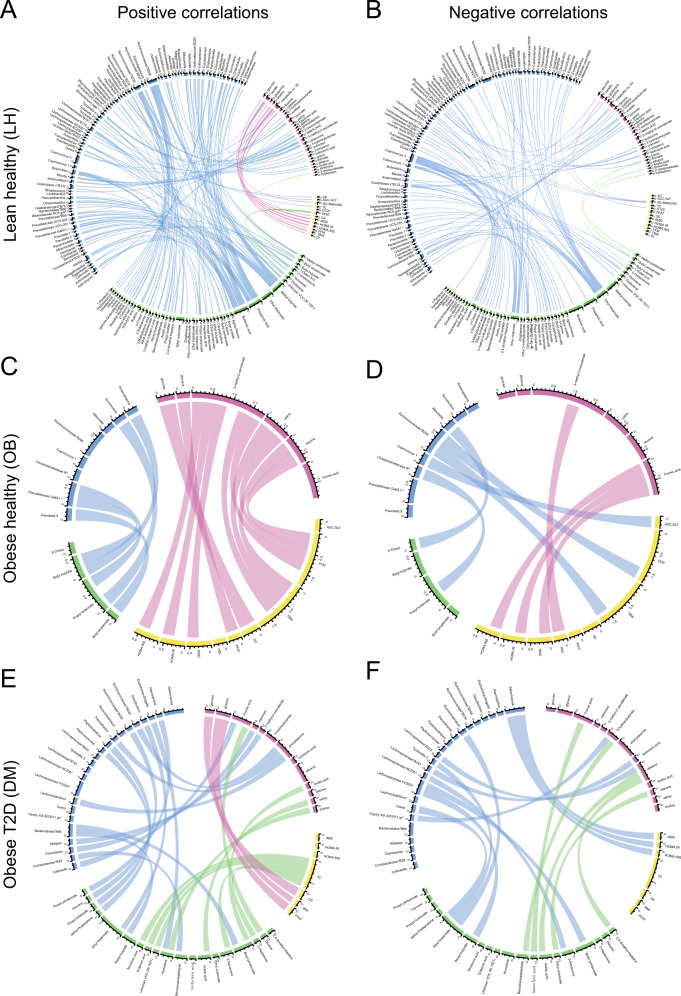
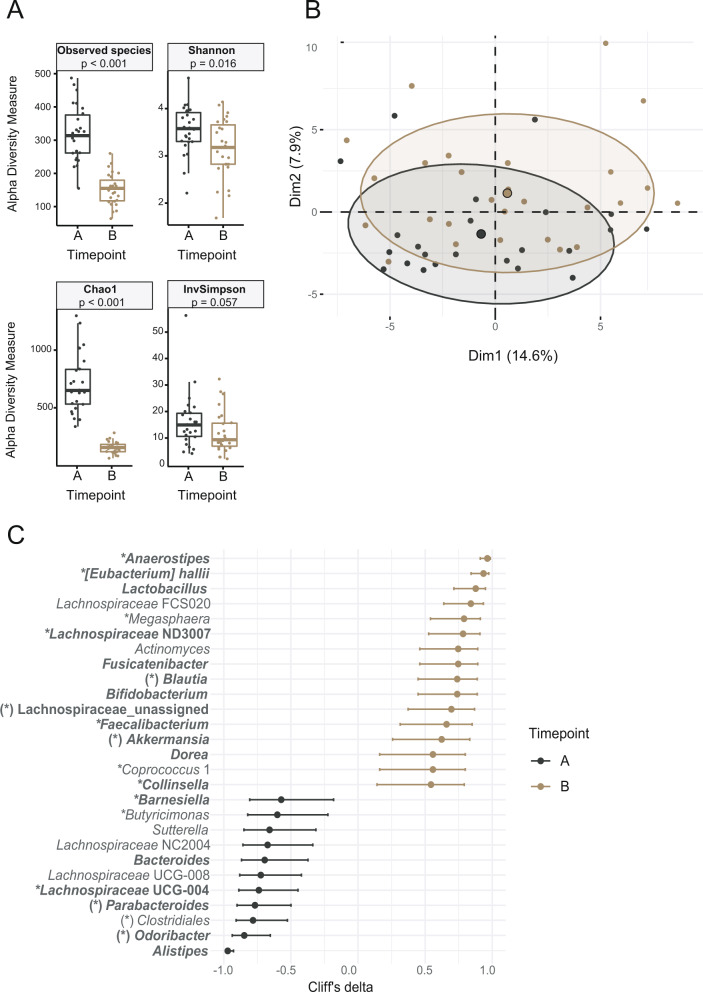
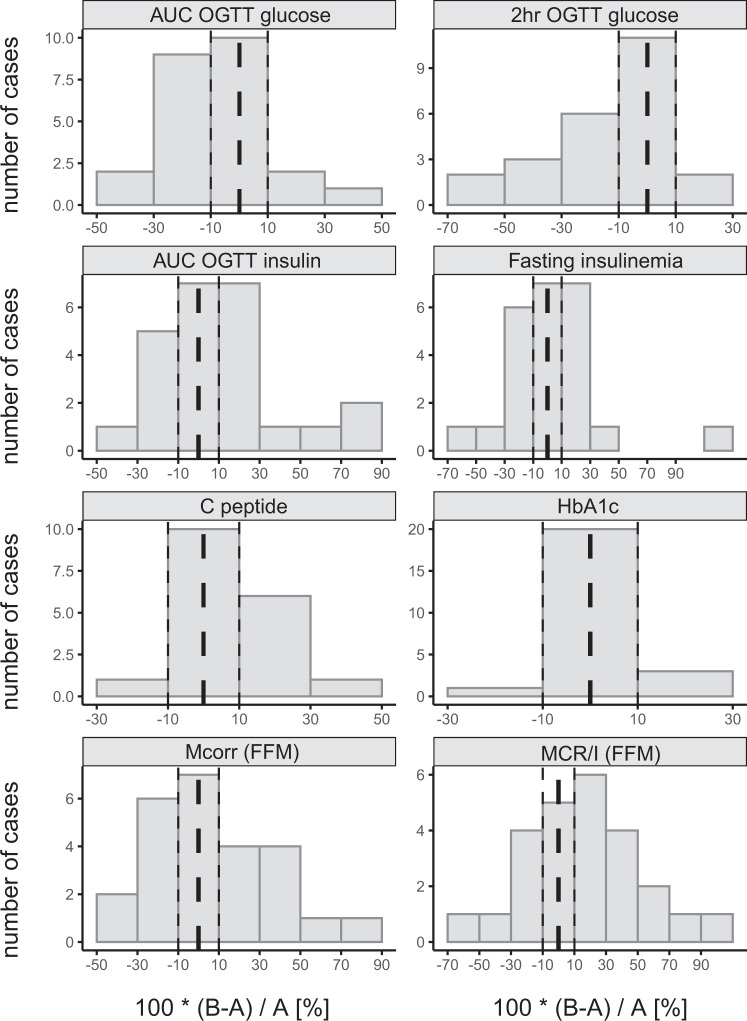
Results: MIME composition was different between groups. While the DM and LH groups represented opposite poles of the abundance spectrum, OB was closer to DM. Inulin supplementation was associated with an overall improvement in glycemic indices, though the response was very variable, with a shift in microbiome composition toward a more favorable profile and increased serum butyric and propionic acid concentrations. The improved glycemic outcomes of inulin treatment were dependent on better baseline glycemic status and variables related to the gut microbiota, including the abundance of certain bacterial taxa (i.e., Blautia, Eubacterium halii group, Lachnoclostridium, Ruminiclostridium, Dialister, or Phascolarctobacterium), serum concentrations of branched-chain amino acid derivatives and asparagine, and fecal concentrations of indole and several other volatile organic compounds.
Conclusion: We demonstrated that obesity is a stronger determinant of different MIME patterns than impaired glucose metabolism. The large inter-individual variability in the metabolic effects of dietary inulin was explained by differences in baseline glycemic status and MIME signatures. These could be further validated to personalize nutritional interventions in patients with newly diagnosed diabetes.
© 2023. The Author(s).
Conflict of interest statement
The authors declare no competing interests.
Figures
Similar articles
-
Gut microbiota and short chain fatty acids partially mediate the beneficial effects of inulin on metabolic disorders in obese ob/ob mice.J Food Biochem. 2022 May;46(5):e14063. doi: 10.1111/jfbc.14063. Epub 2022 Feb 7. J Food Biochem. 2022. PMID: 35128673
-
Dietary supplementation with inulin-propionate ester or inulin improves insulin sensitivity in adults with overweight and obesity with distinct effects on the gut microbiota, plasma metabolome and systemic inflammatory responses: a randomised cross-over trial.Gut. 2019 Aug;68(8):1430-1438. doi: 10.1136/gutjnl-2019-318424. Epub 2019 Apr 10. Gut. 2019. PMID: 30971437 Free PMC article. Clinical Trial.
-
Physical activity enhances the improvement of body mass index and metabolism by inulin: a multicenter randomized placebo-controlled trial performed in obese individuals.BMC Med. 2022 Mar 30;20(1):110. doi: 10.1186/s12916-022-02299-z. BMC Med. 2022. PMID: 35351144 Free PMC article. Clinical Trial.
-
The effects of inulin on gut microbial composition: a systematic review of evidence from human studies.Eur J Clin Microbiol Infect Dis. 2020 Mar;39(3):403-413. doi: 10.1007/s10096-019-03721-w. Epub 2019 Nov 9. Eur J Clin Microbiol Infect Dis. 2020. PMID: 31707507
-
The Role of Dietary Fibre in Modulating Gut Microbiota Dysbiosis in Patients with Type 2 Diabetes: A Systematic Review and Meta-Analysis of Randomised Controlled Trials.Nutrients. 2020 Oct 23;12(11):3239. doi: 10.3390/nu12113239. Nutrients. 2020. PMID: 33113929 Free PMC article.
Cited by
-
The Ambiguous Correlation of Blautia with Obesity: A Systematic Review.Microorganisms. 2024 Aug 26;12(9):1768. doi: 10.3390/microorganisms12091768. Microorganisms. 2024. PMID: 39338443 Free PMC article. Review.
-
Precision nutrition: Is tailor‑made dietary intervention a reality yet? (Review).Biomed Rep. 2025 Mar 17;22(5):86. doi: 10.3892/br.2025.1964. eCollection 2025 May. Biomed Rep. 2025. PMID: 40166414 Free PMC article. Review.
-
Exploring the Prebiotic Potentials of Hydrolyzed Pectins: Mechanisms of Action and Gut Microbiota Modulation.Nutrients. 2024 Oct 29;16(21):3689. doi: 10.3390/nu16213689. Nutrients. 2024. PMID: 39519522 Free PMC article. Review.
-
Illuminating diabetes via multi-omics: Unraveling disease mechanisms and advancing personalized therapy.World J Diabetes. 2025 Jul 15;16(7):106218. doi: 10.4239/wjd.v16.i7.106218. World J Diabetes. 2025. PMID: 40697608 Free PMC article. Review.
-
Health Effects and Mechanisms of Inulin Action in Human Metabolism.Nutrients. 2024 Sep 2;16(17):2935. doi: 10.3390/nu16172935. Nutrients. 2024. PMID: 39275251 Free PMC article. Review.
References
Publication types
MeSH terms
Substances
Grants and funding
LinkOut - more resources
Full Text Sources
Medical
Miscellaneous
