. 2023 Apr 21;13(1):6232.
doi: 10.1038/s41598-023-31932-x.

Putting hornets on the genomic map

Affiliations

Putting hornets on the genomic map

Emeline Favreau et al. Sci Rep. .

Abstract

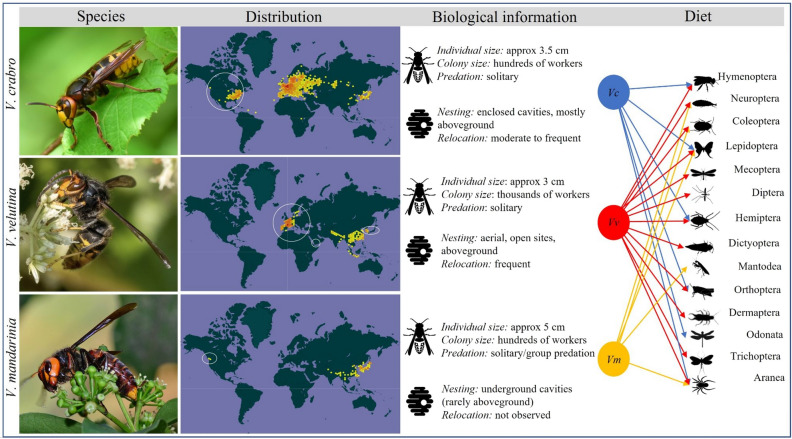
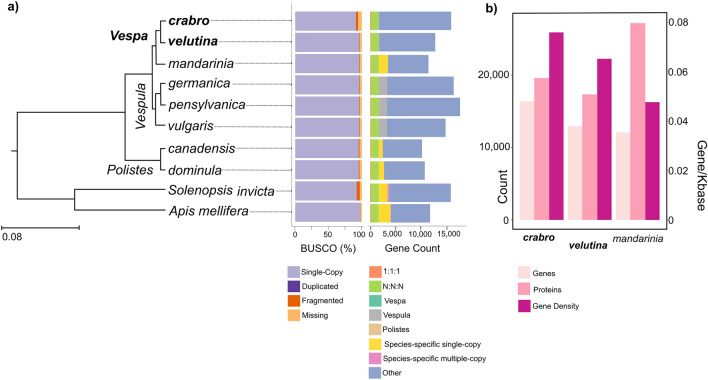
Hornets are the largest of the social wasps, and are important regulators of insect populations in their native ranges. Hornets are also very successful as invasive species, with often devastating economic, ecological and societal effects. Understanding why these wasps are such successful invaders is critical to managing future introductions and minimising impact on native biodiversity. Critical to the management toolkit is a comprehensive genomic resource for these insects. Here we provide the annotated genomes for two hornets, Vespa crabro and Vespa velutina. We compare their genomes with those of other social Hymenoptera, including the northern giant hornet Vespa mandarinia. The three hornet genomes show evidence of selection pressure on genes associated with reproduction, which might facilitate the transition into invasive ranges. Vespa crabro has experienced positive selection on the highest number of genes, including those putatively associated with molecular binding and olfactory systems. Caste-specific brain transcriptomic analysis also revealed 133 differentially expressed genes, some of which are associated with olfactory functions. This report provides a spring-board for advancing our understanding of the evolution and ecology of hornets, and opens up opportunities for using molecular methods in the future management of both native and invasive populations of these over-looked insects.


Conflict of interest statement

The authors declare no competing interests.

Figures

Figure 1
Figure 1
Biology of Vespa hornets. Comparing the key life-history traits of the three Vespa species analyzed in this study. Species column: Female adult morphology for Vespa crabro, Vespa velutina and Vespa mandarinia (photos taken from www.inaturalist.org, respectively from the following users: rainyang, Mиxaил Maлышeв, Kinmatsu Lin, all photos have CCBY-NC license). Distribution column: Known geographical distribution of species (from https://www.gbif.org/); the redder patches indicate higher occurrence records; their invasive distributions are circled. Biological information column: Descriptions of individual and nest traits and behaviours,,,. Diet column: All three Vespa species (left) prey on a diverse set of arthropod orders (right),,.
Figure 2
Figure 2
Vespa genomes statistics in Hymenoptera context. (a) Phylogenetic context and protein-coding gene content of the two new genomes (in bold) with Apis bee, Solenopsis ant, Polistes paper wasps, Vespula yellowjacket wasps. Branch lengths (unit: number of substitutions per site) are from species tree inference algorithm STAG (OrthoFinder). Left Bar Plot: Most Hymenoptera BUSCO genes are found as single copies (mauve) although a small number were duplicated (purple), fragmented genes (dark orange) or missing (light orange). Vespa crabro had a higher proportion of fragmented BUSCOs (Complete: 91.3% [Single-copy: 91.1%, Duplicated: 0.2%], Fragmented: 3.2%, Missing: 5.5%, n: 5991) than Vespa velutina (C: 96.3%[S: 96.1%, D: 0.2%], F: 0.9%, M: 2.8%, n: 5991) and Vespa mandarinia (C: 96.4%[S: 96.1%, D: 0.3%], F: 0.9%, M: 2.7%, n: 5991). Right Bar Plot: Total gene counts in each species in relation to OrthoFinder results. Out of 17,061 orthogroups, 163 are single-copy across the ten species (orange) and 1595 are found in multiple copies (green). Most of the protein-coding genes of each species are orthologous to one extend (Other, blue). (b) Vespa genomes composition: number of protein-coding genes, number of proteins, gene density (number of genes per 1000 bp), based on V. crabro and V. velutina EVM-consensus annotations, and based on V. mandarinia RefSeq annotation. All data in Supplementary Table ST4.
Figure 3
Figure 3
Comparative analyses of gene and protein evolution in vespine wasps. (a) Number of orthogroups with two or more copies, colour-coded by ancestral state (yellow: ancestral; grey: species-specific). Vespa mandarinia has the highest number of duplicated genes. All wasps have a high proportion of species-specific duplications. (b) Illustrative example of orthogroups that are duplicated in all three Vespa species, with associated Hymenoptera gene description after BLAST nr. (c) Orthogroups clustered by Euclidean distances of dN/dS categories (orthogroups in columns, blue represents positive selection in branch-site models) and by rows (species). There is very little overlap between species; overlapping areas with genes of interest are highlighted. Number of orthogroups that have experienced positive selection (dN/dS > 1, FDR 0.05) in Vespa and Vespula branches. Vespa crabro has the highest number of genes with a dN/dS ratio higher than 1 (n = 104). (d) Overlap of GO terms of orthogroups having experienced positive selection. Most of the species have a unique large set of GO terms, as seen in the tall, coloured bars on the far right-hand side of the graph (Fisher classic, unadjusted P value, see ST26–ST31.
Figure 4
Figure 4
Caste-specific differentially expressed genes in Vespa crabro brain transcriptomes. (a) Differential expression analysis based on negative binomial distribution of read counts of 1171 genes from 4 workers and 5 non-mated queens (gynes) of Vespa crabro. Read counts from DESeq2 results are filtered by FDR adjusted P value < 0.05 and cluster by castes. Genes are colour-coded in the right-hand side column by stricter filtering (absolute log fold change above 1.5), resulting in 63 genes upregulated in gynes (green) and 70 downregulated (orange). (b) Top Gene Ontology Terms enriched in Vespa crabro’s differentially expressed genes (n = 133 DEG, FDR < 0.05, absolute log fold change = 1.5). 12 Molecular Function GO terms (red) are significantly enriched in the DEG.

Similar articles

Cited by

References

    1. Hotaling S, et al. Long-reads are revolutionizing 20 years of insect genome sequencing. Genome Biol. Evol. 2021 doi: 10.1093/gbe/evab138. - DOI - PMC - PubMed
    1. Li, F. et al. Insect genomes: Progress and challenges. Insect Mol. Biol.0, (2019). - PubMed
    1. Ungerer MC, Johnson LC, Herman MA. Ecological genomics: Understanding gene and genome function in the natural environment. Heredity. 2008;100:178–183. doi: 10.1038/sj.hdy.6800992. - DOI - PubMed
    1. Hölldobler B, Wilson EO. The Ants. Harvard Univ. Press; 1990.
    1. Schultheiss P, et al. The abundance, biomass, and distribution of ants on Earth. Proc. Natl. Acad. Sci. USA. 2022;119:e2201550119. doi: 10.1073/pnas.2201550119. - DOI - PMC - PubMed

Publication types