. 2023 Apr 21;13(1):6517.
doi: 10.1038/s41598-023-33785-w.

Enhancing cancer treatment and understanding through clustering of gene responses to categorical stressors

Affiliations

Enhancing cancer treatment and understanding through clustering of gene responses to categorical stressors

Christopher El Hadi et al. Sci Rep. .

Abstract

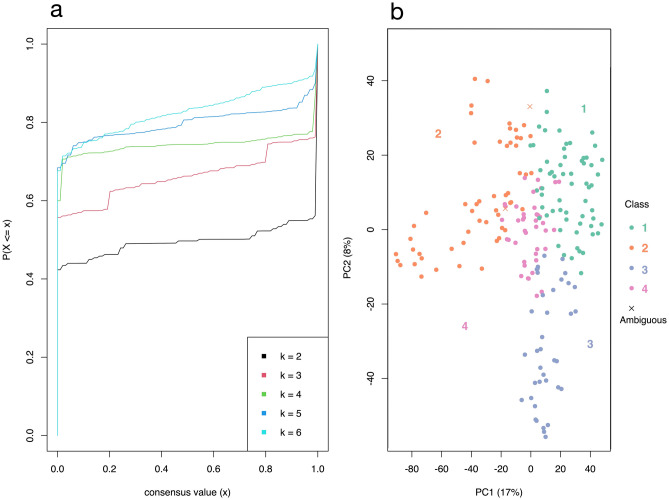
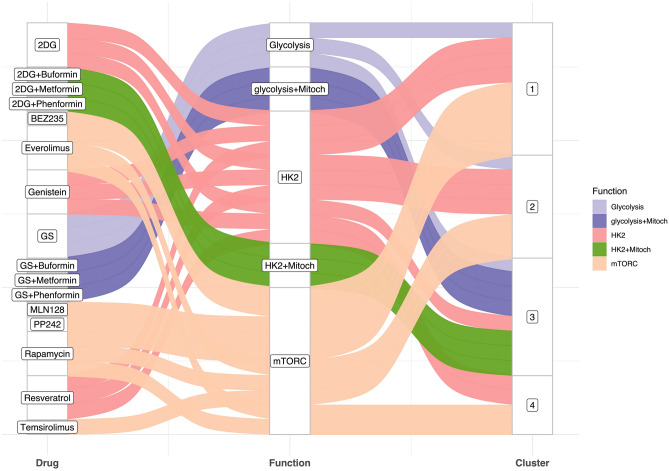
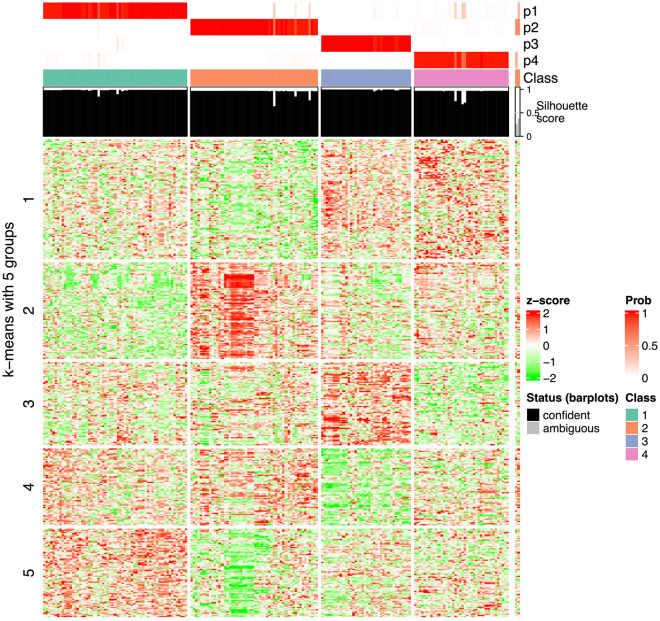
Cancer cells have a unique metabolic activity in the glycolysis pathway compared to normal cells, which allows them to maintain their growth and proliferation. Therefore, inhibition of glycolytic pathways may be a promising therapeutic approach for cancer treatment. In this novel study, we analyzed the genetic responses of cancer cells to stressors, particularly to drugs that target the glycolysis pathway. Gene expression data for experiments on different cancer cell types were extracted from the Gene Expression Omnibus and the expression fold change was then clustered after dimensionality reduction. We identified four groups of responses: the first and third were most affected by anti-glycolytic drugs, especially those acting on multiple pathways at once, and consisted mainly of squamous and mesenchymal tissues, showing higher mitotic inhibition and apoptosis. The second and fourth groups were relatively unaffected by treatment, comprising mainly gynecologic and hormone-sensitive groups, succumbing least to glycolysis inhibitors. Hexokinase-targeted drugs mainly showed this blunted effect on cancer cells. This study highlights the importance of analyzing the molecular states of cancer cells to identify potential targets for personalized cancer therapies and to improve our understanding of the disease.


Conflict of interest statement

The authors declare no competing interests.

Figures

Figure 1
Figure 1
eCDF curve and PCA plot of the consensus clustering. (a) eCDF curve of the consensus matrix from partition by ATC:skmeans, a good k can be selected by aiming at the flatness of the eCDF curve. (b) PCA on 5000 rows with the highest ATC scores, 193 out of 195 confident samples were kept in their classes (silhouette > 0.5).
Figure 2
Figure 2
Relationship between the drugs studied, their molecular activity, and response clusters. The Sankey diagram shows molecular activity of each drug. Cluster designations are shown on the right.
Figure 3
Figure 3
Relationship between TCGA tumor type, iCluster, and response clusters. The Sankey diagram shows the tumor type composition of each iCluster. Cluster designations are shown on the right.
Figure 4
Figure 4
Heatmap of the GO term similarities from the 195-sample gene list. The terms resulted from the enrichment of the genes in either group (using FDR < 0.01). The green–red columns show for which group the respective GO terms are significant. The word cloud keywords highlight the biological functions in each GO group.
Figure 5
Figure 5
Heatmap of the signature genes and their regulation in each class. 9368 signature genes (58.1% of total genes) chosen for an FDR < 0.01. This heat map represents the differences in expression relative to the average FC for each gene. Table 3. Summarizes these differences.

References

    1. Warburg O. On the origin of cancer cells. Science. 1956;123:309–314. doi: 10.1126/science.123.3191.309. - DOI - PubMed
    1. Warburg O. The metabolism of carcinoma cells. J. Cancer Res. 1925;9:148–163. doi: 10.1158/jcr.1925.148. - DOI
    1. Vazquez A, et al. Cancer metabolism at a glance. J. Cell Sci. 2016;129:3367–3373. doi: 10.1242/jcs.181016. - DOI - PMC - PubMed
    1. Vander Heiden MG, Cantley LC, Thompson CB. Understanding the Warburg effect: The metabolic requirements of cell proliferation. Science. 2009;324:1029–1033. doi: 10.1126/science.1160809. - DOI - PMC - PubMed
    1. Liu H, Hu YP, Savaraj N, Priebe W, Lampidis TJ. Hypersensitization of tumor cells to glycolytic inhibitors. Biochemistry. 2001;40:5542–5547. doi: 10.1021/bi002426w. - DOI - PubMed