. 2023 Apr 21;13(1):6528.
doi: 10.1038/s41598-023-33848-y.

Contribution of HIF-1α/BNIP3-mediated autophagy to lipid accumulation during irinotecan-induced liver injury

Affiliations

Contribution of HIF-1α/BNIP3-mediated autophagy to lipid accumulation during irinotecan-induced liver injury

Congjian Shi et al. Sci Rep. .

Abstract

Irinotecan is a topoisomerase I inhibitor which has been widely used to combat several solid tumors, whereas irinotecan therapy can induce liver injury. Liver injury generally leads to tissue hypoxia, and hypoxia-inducible factor-1α (HIF-1α), a pivotal transcription factor, mediates adaptive pathophysiological responses to lower oxygen condition. Previous studies have reported a relationship between HIF-1α and autophagy, and autophagy impairment is a common characteristic in a variety of diseases. Here, irinotecan (50 mg/kg) was employed on mice, and HepG2 and L-02 cells were cultured with irinotecan (10, 20 and 40 μM). In vivo study, we found that irinotecan treatment increased final liver index, serum aminotransferase level and hepatic lipid accumulation. Impaired autophagic flux and activation of HIF-1α/BNIP3 pathway were also demonstrated in the liver of irinotecan-treated mice. Moreover, irinotecan treatment significantly deteriorated hepatic oxidative stress, evidenced by increased MDA and ROS contents, as well as decreased GSH-Px, SOD and CAT contents. Interestingly, protein levels of NLRP3, cleaved-caspase 1 and IL-1β were enhanced in the liver of mice injected with irinotecan. In vitro study, irinotecan-treated HepG2 and L-02 cells also showed impaired autophagic flux, while HIF-1α inhibition efficaciously removed the accumulated autophagosomes induced by irinotecan. Additionally, irinotecan treatment aggravated lipid accumulation in HepG2 and L-02 cells, and HIF-1α inhibition reversed the effect of irinotecan. Furthermore, HIF-1α inhibition weakened irinotecan-induced NLRP3 inflammasome activation in HepG2 cells. Taken together, our results suggest that irinotecan induces liver injury by orchestrating autophagy via HIF-1α/BNIP3 pathway, and HIF-1α inhibition could alleviate irinotecan-induced lipid accumulation in HepG2 and L-02 cells, which will provide a new clue and direction for the prevention of side effects of clinical chemotherapy drugs.


Conflict of interest statement

The authors declare no competing interests.

Figures

Figure 1
Figure 1
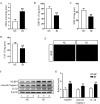
Irinotecan (IR) induces liver injury in mice. Mice were intraperitoneally injected with IR (50 mg/kg) or solvent (saline) every three days for 3 weeks. Effects of IR on (A) liver index, serum levels of (B) ALT and (C) AST, and (D) hepatic TG content. Data are presented as mean ± SD (n = 8), *P < 0.05 and **P < 0.01 compared with normal control (NC) group. (E) Liver sections were stained with H&E and Oil Red O to evaluate lipid accumulation. (F) Western blot analysis of SREBP-1c protein level in liver tissue. (G) Densitometric quantification of SREBP-1c. The blots were cut prior to hybridisation with indicated primary antibodies. Data are presented as mean ± SD (n = 6), **P < 0.01 compared with NC group.
Figure 2
Figure 2
Impaired autophagic flux and activated HIF-1α/BNIP3 pathway are demonstrated in the liver of irinotecan (IR)-treated mice. (A) Western blot analysis of LC3-II, Beclin1 and p62 protein levels in liver tissue. (B) Densitometric quantification of LC3-II, Beclin1 and p62. (C) Effects of irinotecan on the formation of hepatic acidic vesicular organelles (orange) was examined by acridine orange (AO) staining. (D) Immunofluorescence was performed on liver sections using pimonidazole (green) to detect hypoxic regions, nuclei were stained with DAPI (blue). (E) Western blot analysis of HIF-1α and BNIP3 protein levels in liver tissue. (F) Densitometric quantification of HIF-1α and BNIP3. The blots were cut prior to hybridisation with indicated primary antibodies. Data are presented as mean ± SD (n = 6), *P < 0.05 and **P < 0.01 compared with normal control (NC) group.
Figure 3
Figure 3
Irinotecan (IR) aggrandizes hepatic oxidative stress and NLRP3 inflammasome activity in mice. Effects of IR on hepatic (A) MDA, (B) GSH-Px, (C) SOD and (D) CAT content. Data are presented as mean ± SD (n = 8), **P < 0.01 compared with normal control (NC) group. (E) Hepatic ROS level were determined by DHE staining. Red color is considered as ROS staining. (F) Western blot analysis of NLRP3, cleaved-Caspase1 and IL-1β protein levels in liver tissue. (G) Densitometric quantification of NLRP3, cleaved-Caspase1 and IL-1β. The blots were cut prior to hybridisation with indicated primary antibodies. Data are presented as mean ± SD (n = 6), **P < 0.01 compared with NC group.
Figure 4
Figure 4
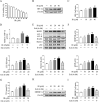
Echinomycin (Ech) mitigates autophagosome accumulation and lipid deposition in irinotecan (IR)-treated HepG2 cells. HepG2 cells were exposed to media supplemented with IR (10, 20, 40 μM) for 12 h-treatment and Ech (6 nM) were given during the last 6 h of 12 h-treatment. (A) Cell viability of HepG2 cells treated with different concentrations of irinotecan is measured by CCK8 assay. Data are presented as mean ± SD (n = 6), *P < 0.05 compared with 0 μM group. (B) Western blot analysis of HIF-1α protein level in HepG2 cells. (C) Densitometric quantification of HIF-1α. (D) Relative HIF-1α DNA binding activity in each group. (E) Western blot analysis of BNIP3, LC3-II, Beclin1 and p62 protein levels in HepG2 cells. (F) Densitometric quantification of BNIP3, LC3-II, Beclin1 and p62. (G) IR exacerbated TG content in HepG2 cells and co-treated with Ech decreased cellular TG content. (H) Western blot analysis of SREBP-1c protein level in HepG2 cells. (I) Densitometric quantification of SREBP-1c. The blots were cut prior to hybridisation with indicated primary antibodies. Data are presented as mean ± SD (n = 3), *P < 0.05 and **P < 0.01 compared with normal control group, #P < 0.05 and ##P < 0.01 compared with 20 μM IR-treated group.
Figure 5
Figure 5
HIF-1α siRNA mitigates autophagosome accumulation and lipid deposition in irinotecan (IR)-treated HepG2 cells. (A) Western blot analysis of BNIP3, LC3-II, Beclin1 and p62 protein levels in HepG2 cells. (B) Densitometric quantification of BNIP3, LC3-II Beclin1 and p62. (C) IR exacerbated TG content in HepG2 cells and co-treated with HIF-1α siRNA decreased cellular TG content. The blots were cut prior to hybridisation with indicated primary antibodies. Data are presented as mean ± SD (n = 3), *P < 0.05 and **P < 0.01 compared with normal control group, #P < 0.05 and ##P < 0.01 compared with 20 μM IR-treated group.
Figure 6
Figure 6
Echinomycin (Ech) mitigates autophagosome accumulation and lipid deposition in irinotecan (IR)-treated L-02 cells. L-02 cells were exposed to media supplemented with IR (10, 20, 40 μM) for 12 h-treatment and Ech (6 nM) were given during the last 6 h of 12 h-treatment. (A) Western blot analysis of BNIP3, LC3-II, Beclin1 and p62 protein levels in L-02 cells. (B) Densitometric quantification of BNIP3, LC3-II, Beclin1 and p62. (C) IR exacerbated TG content in L-02 cells and co-treated with Ech decreased cellular TG content. The blots were cut prior to hybridisation with indicated primary antibodies. Data are presented as mean ± SD (n = 3), *P < 0.05 and **P < 0.01 compared with normal control group, #P < 0.05 and ##P < 0.01 compared with 20 μM IR-treated group.
Figure 7
Figure 7
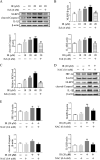
HIF-1α is involved in the activation of NLRP3 inflammasome in irinotecan (IR)-treated HepG2 cells. (A) Echinomycin (Ech) treatment suppresses NLRP3 inflammasome activity in IR-treated HepG2 cells. Western blot analysis of NLRP3, cleaved-Caspase1 and IL-1β protein levels in HepG2 cells. (B) Densitometric quantification of NLRP3, cleaved-Caspase1 and IL-1β. (C) Ech treatment alleviates ROS production in IR-treated HepG2 cells. Relative ROS level in each group. (D) Effects of ROS production on HIF-1α and NLRP3 inflammasome activity in IR-treated HepG2 cells. Western blot analysis of HIF-1α, NLRP3, cleaved-Caspase1 and IL-1β protein levels in HepG2 cells. (E) Densitometric quantification of HIF-1α, NLRP3, cleaved-Caspase1 and IL-1β. The blots were cut prior to hybridization with indicated primary antibodies. Data are presented as mean ± SD (n = 3), *P < 0.05 and **P < 0.01 compared with normal control group, #P < 0.05 and ##P < 0.01 compared with 20 μM IR-treated group.

Similar articles

Cited by

References

    1. Hahn RZ, et al. Pharmacokinetic and pharmacogenetic markers of irinotecan toxicity. Curr. Med. Chem. 2019;26:2085–2107. doi: 10.2174/0929867325666180622141101. - DOI - PubMed
    1. Araz M, Kilinc F, Kerimoglu U, Keskin M, Kucukkartallar T. Irinotecan-induced NASH and liver failure. Clin. Res. Hepatol. Gastroenterol. 2021;45:101606. doi: 10.1016/j.clinre.2020.101606. - DOI - PubMed
    1. van Mierlo KM, Schaap FG, Dejong CH, Olde Damink SW. Liver resection for cancer: New developments in prediction, prevention and management of postresectional liver failure. J. Hepatol. 2016;65:1217–1231. doi: 10.1016/j.jhep.2016.06.006. - DOI - PubMed
    1. Hammond JS, Guha IN, Beckingham IJ, Lobo DN. Prediction, prevention and management of postresection liver failure. Br. J. Surg. 2011;98:1188–1200. doi: 10.1002/bjs.7630. - DOI - PubMed
    1. Han J, Zhang J, Zhang C. Irinotecan-induced steatohepatitis: Current insights. Front. Oncol. 2021;11:754891. doi: 10.3389/fonc.2021.754891. - DOI - PMC - PubMed

Publication types

MeSH terms

Substances