. 2023 Apr 21;6(1):439.
doi: 10.1038/s42003-023-04833-y.

A data-driven crop model for maize yield prediction

Affiliations

A data-driven crop model for maize yield prediction

Yanbin Chang et al. Commun Biol. .

Abstract

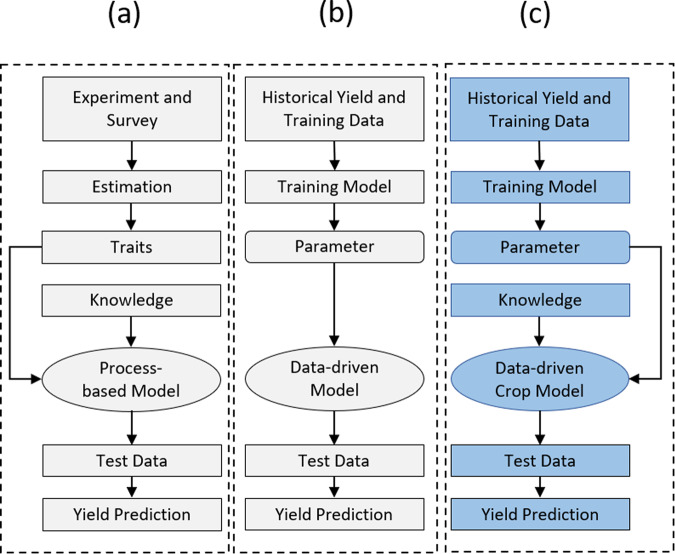
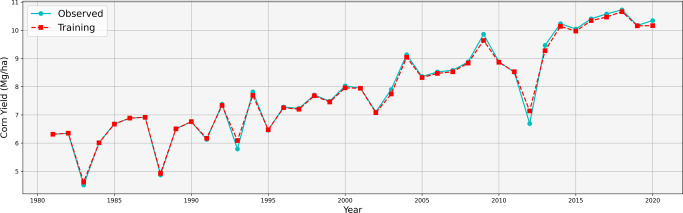
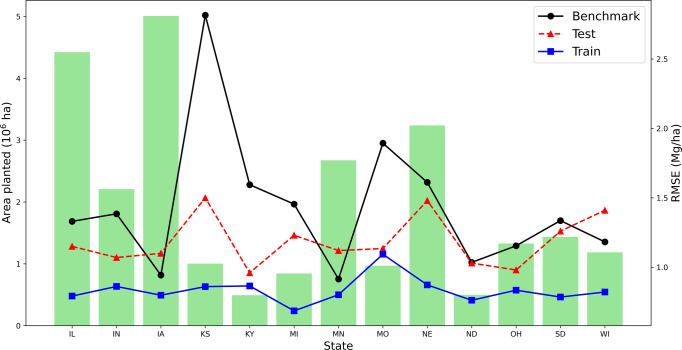
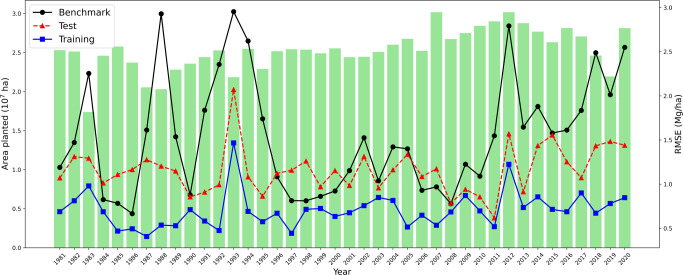
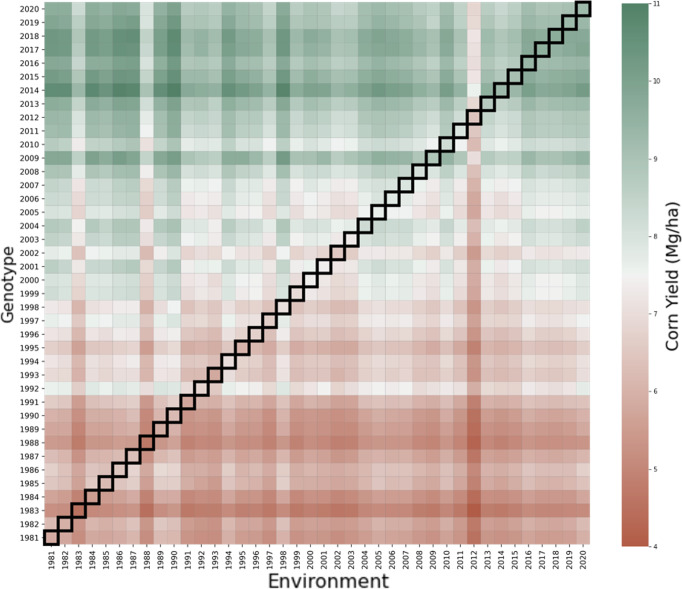
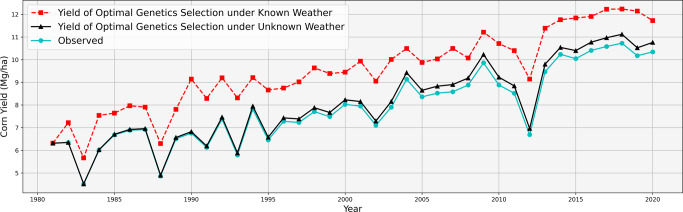
Accurate estimation of crop yield predictions is of great importance for food security under the impact of climate change. We propose a data-driven crop model that combines the knowledge advantage of process-based modeling and the computational advantage of data-driven modeling. The proposed model tracks the daily biomass accumulation process during the maize growing season and uses daily produced biomass to estimate the final grain yield. Computational studies using crop yield, field location, genotype and corresponding environmental data were conducted in the US Corn Belt region from 1981 to 2020. The results suggest that the proposed model can achieve an accurate prediction performance with a 7.16% relative root-mean-square-error of average yield in 2020 and provide scientifically explainable results. The model also demonstrates its ability to detect and separate interactions between genotypic parameters and environmental variables. Additionally, this study demonstrates the potential value of the proposed model in helping farmers achieve higher yields by optimizing seed selection.


Conflict of interest statement

L.W. is a co-founder of Crop Convergence LLC. All other authors declare no competing interests.

Figures

Fig. 1
Fig. 1. Comparison of process-based, data-driven, and the proposed data-driven crop models.
a Process-based models are built with human knowledge on plant physiology with explicit assumptions about genotype by environment interactions; numerous traits (modeling parameters) need to be estimated using experiments or survey of the literature. b Data-driven models rely on historical data to approximate the complex relationship between input and output. c The proposed Data-driven Crop model combines the strengths of two types of models.
Fig. 2
Fig. 2. Training performance of proposed model.
The cyan and red curves are, respectively, observed yield and fitted yield using training data between 1981 and 2020, averaged across all counties in the Corn Belt.
Fig. 3
Fig. 3. Spatial extrapolation results.
Green bars are average planted areas from 1981 to 2020. The three curves represent the benchmark nearest-county approach on the test data, and the data-driven crop model on test data and training data.
Fig. 4
Fig. 4. Temporal extrapolation results.
Green bars are average planted areas from 1981 to 2020. The three curves represent the benchmark nearest-year approach, data-driven crop model on test data and training data.
Fig. 5
Fig. 5. Genotype by environment interactions result.
Each colored square in the heat map indicates the predicted yield using the data-driven crop model when the genotype in the year from its corresponding vertical axis was grown in the environmental conditions in the year from its corresponding horizontal axis.
Fig. 6
Fig. 6. Comparison of observed corn yield with improved yield from optimal seed selection under known and unknown weather scenarios.
In both scenarios, optimal genotype were selected from all seeds in all counties in the Corn Belt that were historically available at the time of selection.
Fig. 7
Fig. 7. Illustration of a simplified maize growth model.
Here “w”, “s”, “m” represent weather, soil, and management variables, respectively, and “g” represents the set of parameters that are determined solely by the genotype and independent of the environment. The arrows indicate how environmental variables and genetic parameters influence different modules and eventually determine crop yield.

References

    1. Marko O, et al. Soybean varieties portfolio optimisation based on yield prediction. Comput. Electron. Agric. 2016;127:467–474. doi: 10.1016/j.compag.2016.07.009. - DOI
    1. Messina C, Podlich D, Dong Z, Samples M, Cooper M. Yield–trait performance landscapes: from theory to application in breeding maize for drought tolerance. J. Exp. Bot. 2010;62:855–868. doi: 10.1093/jxb/erq329. - DOI - PubMed
    1. Penning de Vries, F. W., Van Laar, H. & Kropff, M. Simulation and Systems Analysis for Rice Production (SARP) (PUDOC, Wageningen, The Netherlands, 1991).
    1. Bouman B, Van Keulen H, Van Laar H, Rabbinge R. The ‘school of de wit’crop growth simulation models: a pedigree and historical overview. Agric. Syst. 1996;52:171–198. doi: 10.1016/0308-521X(96)00011-X. - DOI
    1. van Ittersum MK, et al. On approaches and applications of the wageningen crop models. Eur. J. Agron. 2003;18:201–234. doi: 10.1016/S1161-0301(02)00106-5. - DOI

Publication types