

Machine learning reveals limited contribution of trans-only encoded variants to the HLA-DQ immunopeptidome
- PMID: 37085710
- PMCID: PMC10121683
- DOI: 10.1038/s42003-023-04749-7
Machine learning reveals limited contribution of trans-only encoded variants to the HLA-DQ immunopeptidome
Abstract
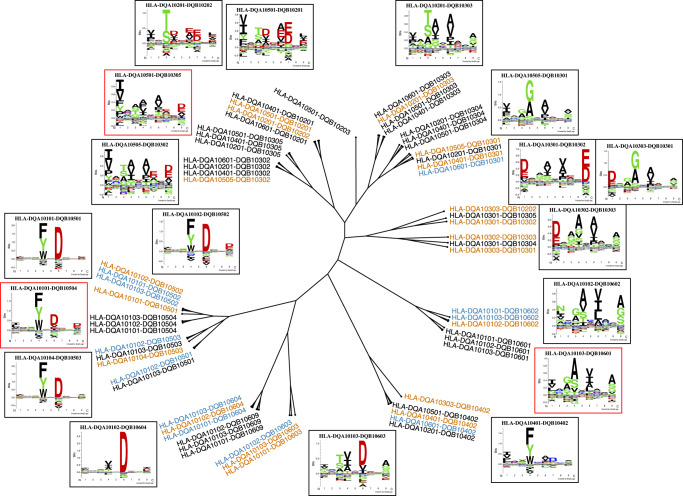
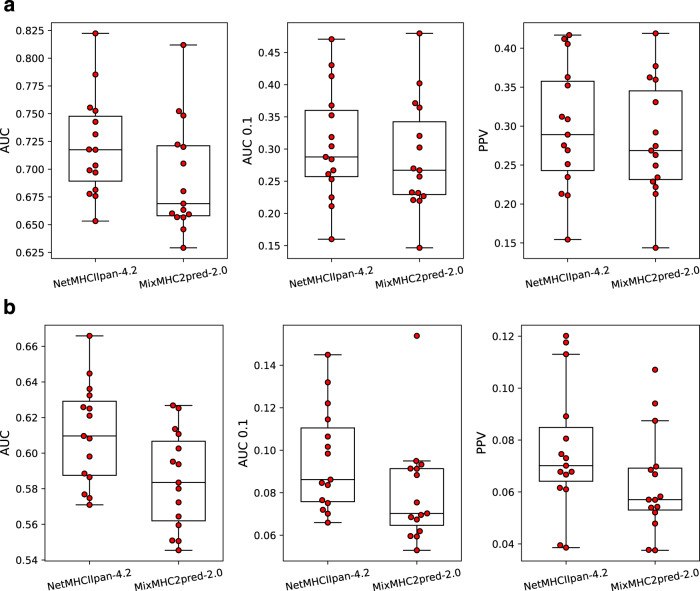
Human leukocyte antigen (HLA) class II antigen presentation is key for controlling and triggering T cell immune responses. HLA-DQ molecules, which are believed to play a major role in autoimmune diseases, are heterodimers that can be formed as both cis and trans variants depending on whether the α- and β-chains are encoded on the same (cis) or opposite (trans) chromosomes. So far, limited progress has been made for predicting HLA-DQ antigen presentation. In addition, the contribution of trans-only variants (i.e. variants not observed in the population as cis) in shaping the HLA-DQ immunopeptidome remains largely unresolved. Here, we seek to address these issues by integrating state-of-the-art immunoinformatics data mining models with large volumes of high-quality HLA-DQ specific mass spectrometry immunopeptidomics data. The analysis demonstrates highly improved predictive power and molecular coverage for models trained including these novel HLA-DQ data. More importantly, investigating the role of trans-only HLA-DQ variants reveals a limited to no contribution to the overall HLA-DQ immunopeptidome. In conclusion, this study furthers our understanding of HLA-DQ specificities and casts light on the relative role of cis versus trans-only HLA-DQ variants in the HLA class II antigen presentation space. The developed method, NetMHCIIpan-4.2, is available at https://services.healthtech.dtu.dk/services/NetMHCIIpan-4.2 .
© 2023. The Author(s).
Conflict of interest statement
S.K. is an employee at Pure MHC, LLC. The remaining authors declare no competing interests.
Figures
Similar articles
-
NetMHCIIpan-3.0, a common pan-specific MHC class II prediction method including all three human MHC class II isotypes, HLA-DR, HLA-DP and HLA-DQ.Immunogenetics. 2013 Oct;65(10):711-24. doi: 10.1007/s00251-013-0720-y. Epub 2013 Jul 31. Immunogenetics. 2013. PMID: 23900783 Free PMC article.
-
Accurate prediction of HLA class II antigen presentation across all loci using tailored data acquisition and refined machine learning.Sci Adv. 2023 Nov 24;9(47):eadj6367. doi: 10.1126/sciadv.adj6367. Epub 2023 Nov 24. Sci Adv. 2023. PMID: 38000035 Free PMC article.
-
Impaired binding of a DQ2 and DQ8-binding HSV VP16 peptide to a DQA1*0501/DQB1*0302 trans class II heterodimer.Tissue Antigens. 1999 Jan;53(1):101-5. doi: 10.1034/j.1399-0039.1999.530111.x. Tissue Antigens. 1999. PMID: 10082436
-
[The role of the HLA system in the genetics of Type I diabetes mellitus].Diabete Metab. 1992 Jul-Aug;18(4):253-63. Diabete Metab. 1992. PMID: 1459312 Review. French.
-
Genetic control of immune response and disease susceptibility by the HLA-DQ gene.Res Immunol. 1991 Jun-Aug;142(5-6):459-66. doi: 10.1016/0923-2494(91)90048-n. Res Immunol. 1991. PMID: 1684444 Review.
Cited by
-
In Silico Tools for Predicting Novel Epitopes.Methods Mol Biol. 2024;2813:245-280. doi: 10.1007/978-1-0716-3890-3_17. Methods Mol Biol. 2024. PMID: 38888783
-
Donor HLA-DQ genetic and functional divergence affect the control of BK polyoma virus infection after kidney transplantation.Sci Adv. 2025 Mar 7;11(10):eadt3499. doi: 10.1126/sciadv.adt3499. Epub 2025 Mar 5. Sci Adv. 2025. PMID: 40043107 Free PMC article.
-
Development and use of machine learning algorithms in vaccine target selection.NPJ Vaccines. 2024 Jan 20;9(1):15. doi: 10.1038/s41541-023-00795-8. NPJ Vaccines. 2024. PMID: 38242890 Free PMC article. Review.
-
Reducing Immunogenicity by Design: Approaches to Minimize Immunogenicity of Monoclonal Antibodies.BioDrugs. 2024 Mar;38(2):205-226. doi: 10.1007/s40259-023-00641-2. Epub 2024 Jan 23. BioDrugs. 2024. PMID: 38261155 Free PMC article. Review.
-
Important denominator between autoimmune comorbidities: a review of class II HLA, autoimmune disease, and the gut.Front Immunol. 2023 Sep 26;14:1270488. doi: 10.3389/fimmu.2023.1270488. eCollection 2023. Front Immunol. 2023. PMID: 37828987 Free PMC article. Review.
References
Publication types
MeSH terms
Substances
Grants and funding
LinkOut - more resources
Full Text Sources
Medical
Research Materials
