. 2023 Jun;28(6):2398-2411.
doi: 10.1038/s41380-023-02052-9. Epub 2023 Apr 22.

Diosgenin restores memory function via SPARC-driven axonal growth from the hippocampus to the PFC in Alzheimer's disease model mice

Affiliations

Diosgenin restores memory function via SPARC-driven axonal growth from the hippocampus to the PFC in Alzheimer's disease model mice

Ximeng Yang et al. Mol Psychiatry. 2023 Jun.

Abstract

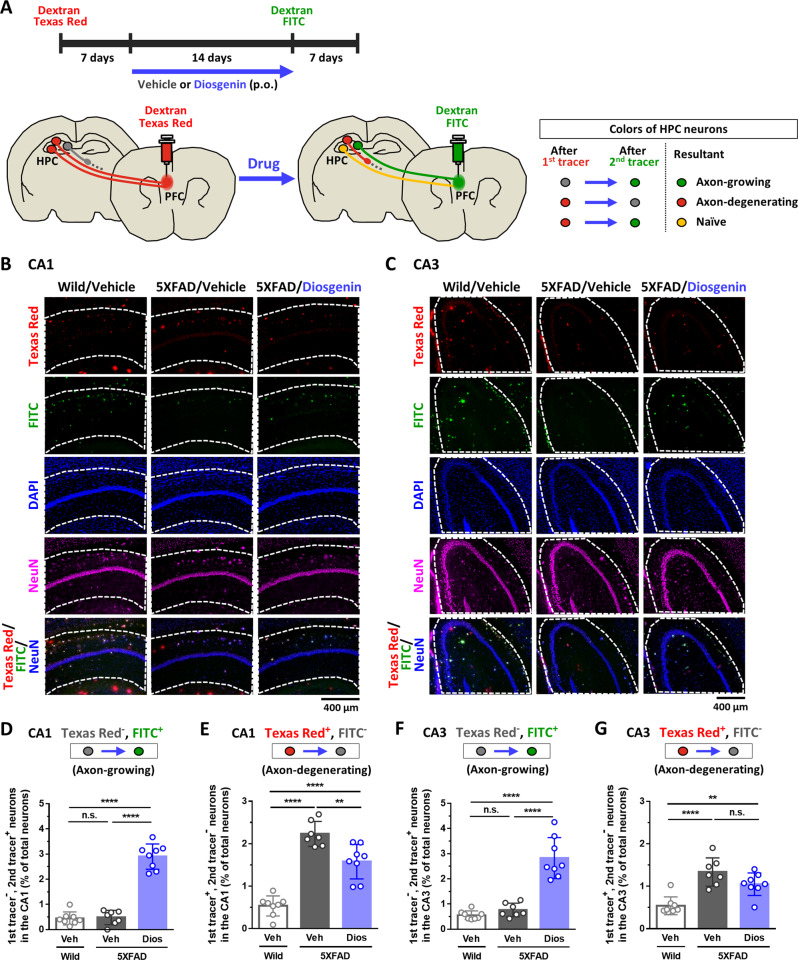
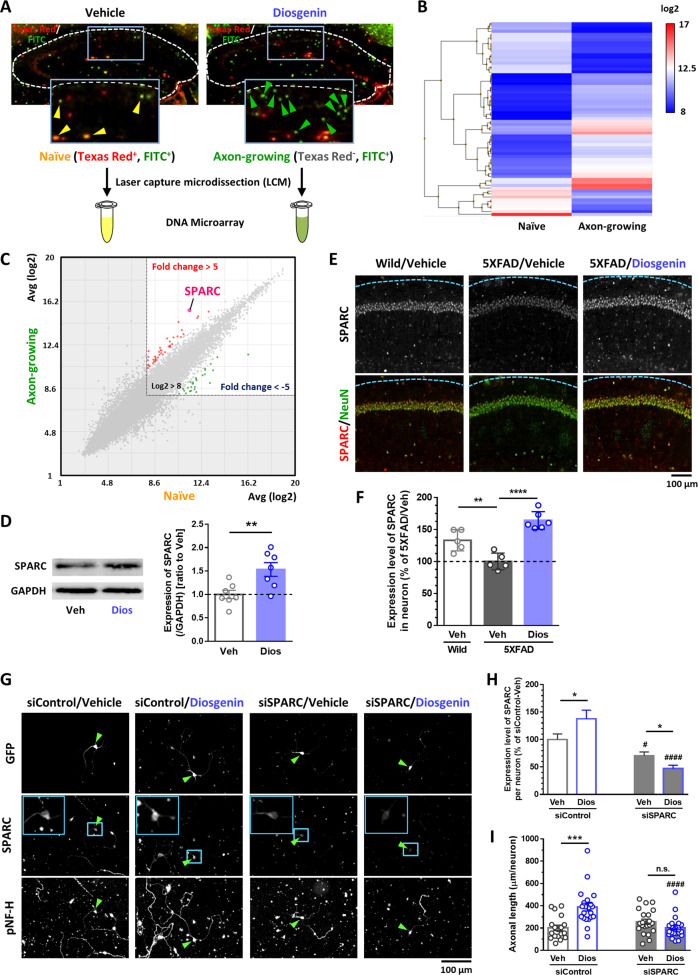
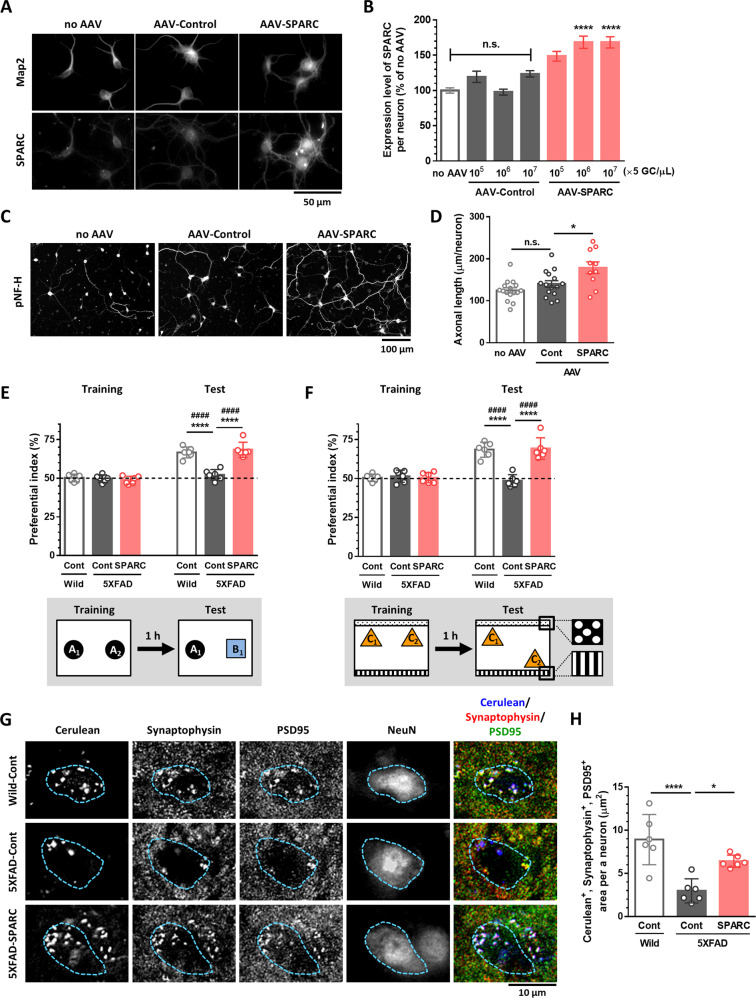
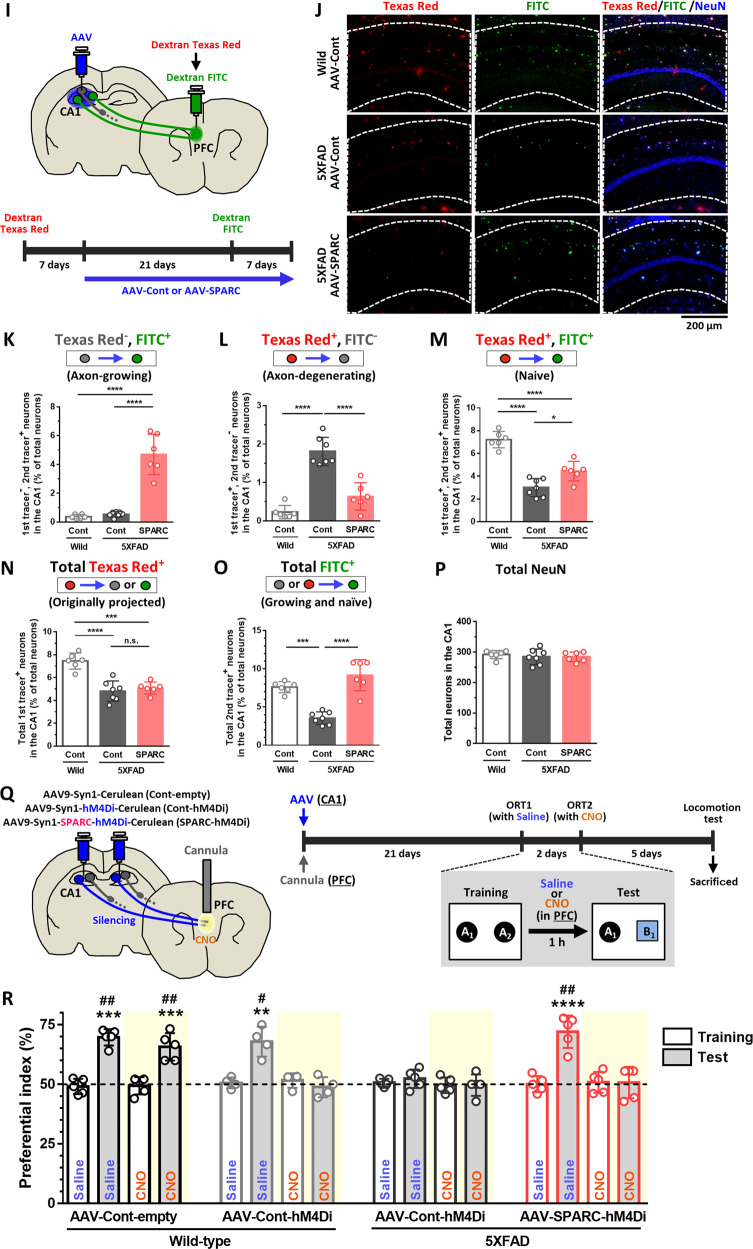
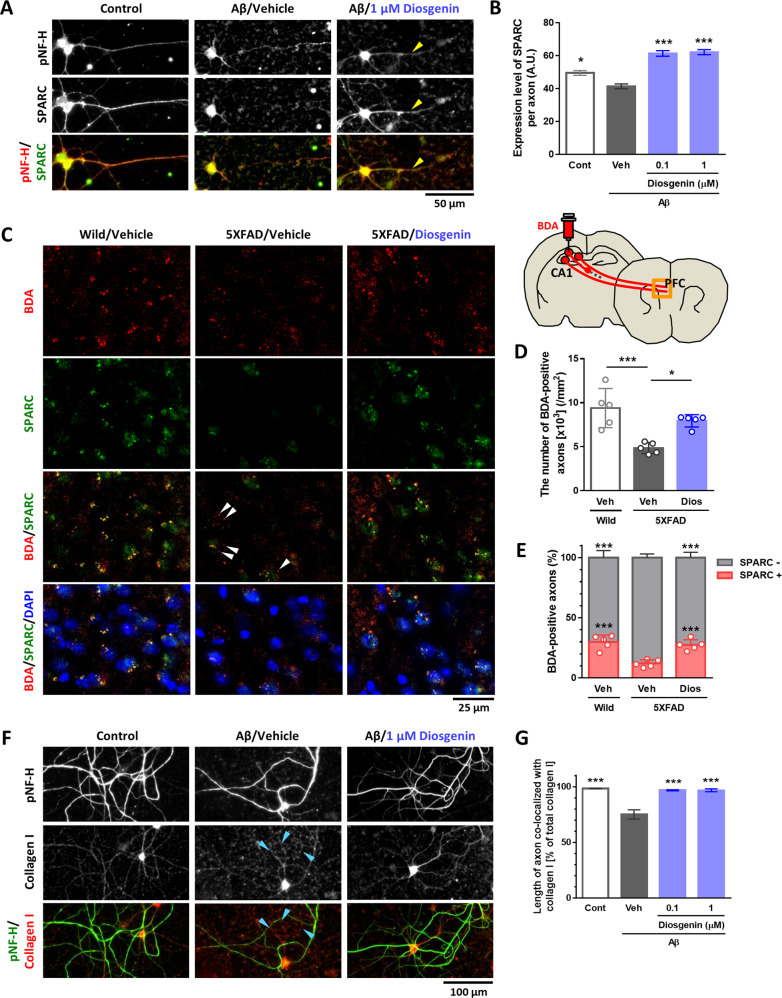
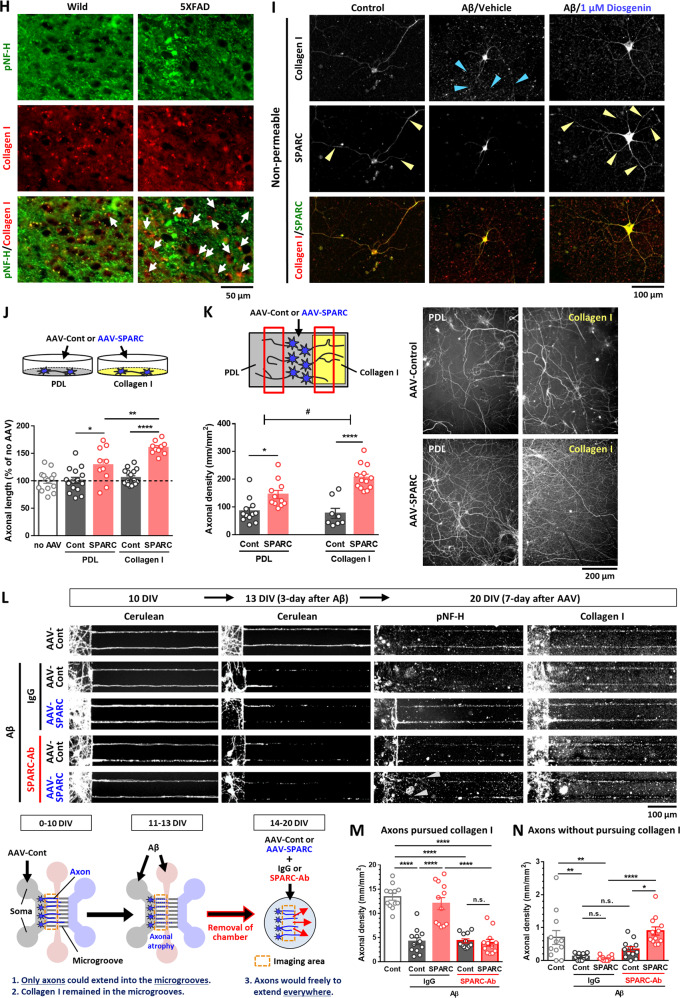
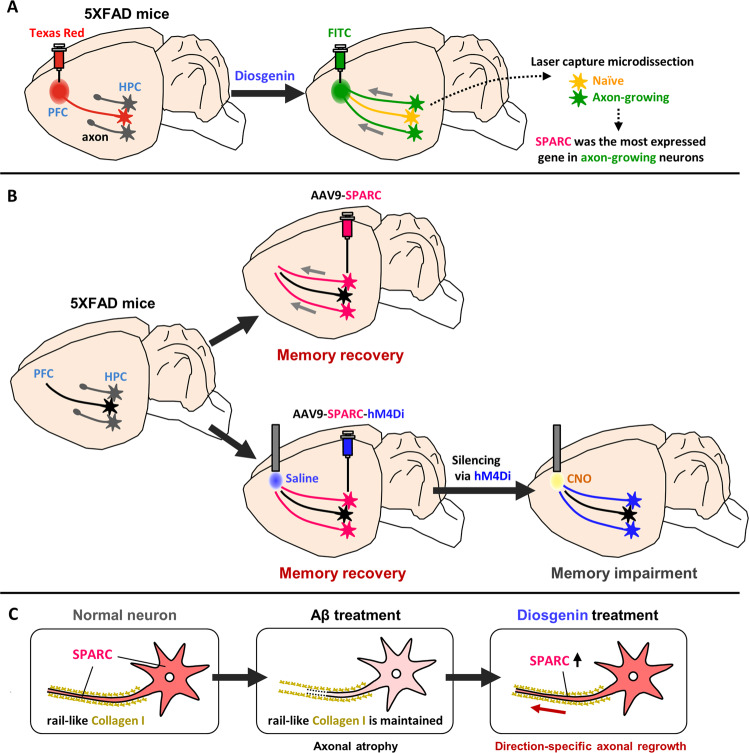
Central nervous system axons have minimal capacity to regenerate in adult brains, hindering memory recovery in Alzheimer's disease (AD). Although recent studies have shown that damaged axons sprouted in adult and AD mouse brains, long-distance axonal re-innervation to their targets has not been achieved. We selectively visualized axon-growing neurons in the neural circuit for memory formation, from the hippocampus to the prefrontal cortex, and showed that damaged axons successfully extended to their native projecting area in mouse models of AD (5XFAD) by administration of an axonal regenerative agent, diosgenin. In vivo transcriptome analysis detected the expression profile of axon-growing neurons directly isolated from the hippocampus of 5XFAD mice. Secreted protein acidic and rich in cysteine (SPARC) was the most expressed gene in axon-growing neurons. Neuron-specific overexpression of SPARC via adeno-associated virus serotype 9 delivery in the hippocampus recovered memory deficits and axonal projection to the prefrontal cortex in 5XFAD mice. DREADDs (Designer receptors exclusively activated by designer drugs) analyses revealed that SPARC overexpression-induced axonal growth in the 5XFAD mouse brain directly contributes to memory recovery. Elevated levels of SPARC on axonal membranes interact with extracellular rail-like collagen type I to promote axonal remodeling along their original tracings in primary cultured hippocampal neurons. These findings suggest that SPARC-driven axonal growth in the brain may be a promising therapeutic strategy for AD and other neurodegenerative diseases.


Conflict of interest statement

The authors declare no competing interests.

Figures

Fig. 1
Fig. 1. Diosgenin administration promotes axonal growth in 5XFAD mice brain.
A Seven days after Dextran Texas Red (1st tracing) was injected into the PFC, diosgenin or vehicle solution was orally administered to wild-type and 5XFAD mice once a day for 14 days. Dextran FITC (2nd tracing) was further injected into the PFC at 7 days before sacrifice. Images for Dextran Texas Red, Dextran FITC, DAPI, and NeuN staining in the CA1 (B) and CA3 (C) were shown. DG The number of axon-growing (Texas Red-, FITC+, NeuN+, DAPI+) neurons and axon-degenerating (Texas Red+, FITC-, NeuN+, DAPI+) neurons in the CA1 and CA3 were quantified. **p < 0.01, ****p < 0.0001, one-way ANOVA post-hoc Bonferroni test, mean ± standard deviation, wild-type mice (Wild)/vehicle (Veh), n = 8; 5XFAD mice (5XFAD)/Veh, n = 7; 5XFAD/diosgenin (Dios), n = 8. D Effect size (r) = 0.959, power (1 − β) = 0.975, E r = 0.918, 1 − β = 0.963, F r = 0.908, 1 − β = 0.959, G r = 0.792, 1 − β = 0.893. High magnification images are shown in Supplementary Figs. 3 and 4.
Fig. 2
Fig. 2. Gene profile of axon-growing neurons by in vivo transcriptome.
A Naive neurons (Texas Red+, FITC+) of vehicle-treated 5XFAD mice (n = 3) and axon-growing neurons (Texas Red-, FITC+) of diosgenin-treated 5XFAD mice (n = 3) were individually isolated by laser capture microdissection. Total RNA was extracted from each pool of neurons to use for DNA microarray. B, C Using transcriptome analysis console, we compared the gene expression profiles in Hierarchical clustering (B) and Scatter plot (C) between naive neurons and axon-growing neurons (log2 > 8, fold change > 5). SPARC was detected as the gene with the highest expression in axon-growing neurons. D Mouse primary HPC neurons were cultured for 3 days and then treated with diosgenin (1 µM) or vehicle solution for 4 days. The neuron lysates were used for western blot analysis. The expression level of SPARC (/GAPDH) was quantified for each neuron lysate. **p < 0.01, two-tailed unpaired t-test, mean ± standard error, vehicle (Veh), n = 7; diosgenin (Veh), n = 7 lysates. Effect size (r) = 0.670, power (1 − β) = 0.873. The image of the complete gel is shown in Supplementary Fig. 5. E, F Diosgenin or vehicle solution was orally administered to wild-type and 5XFAD mice once a day for 14 days. F The expression level of SPARC in CA1 NeuN+ neurons was quantified using immunocytochemistry. **p < 0.01, ****p < 0.0001, one-way ANOVA post-hoc Bonferroni test, mean ± standard deviation, wild-type mice (Wild)/Veh, n = 5; 5XFAD mice (5XFAD)/Veh, n = 5; 5XFAD/Dios, n = 6. r = 0.891, 1 − β = 0.820. GI siRNA for SPARC (30 nM; siSPARC) or control siRNA (30 nM; siControl) was transfected together with GFP vector into mouse primary hippocampal neurons. Three days later, neurons were treated with diosgenin (1 µM) or vehicle solution for 4 days. H The expression level of SPARC and I pNF-H-positive axonal length in GFP+ neurons (green arrowheads) were quantified in each group. Blue rectangles indicate high magnification images of GFP+ neurons. *p < 0.05, ***p < 0.001; #p < 0.05, ####p < 0.0001 vs siControl/Veh or siControl/Dios, two-tailed unpaired t-test, mean ± standard error. H n = 30–51 neurons, siControl: r = 0.214, 1 − β = 0.546, siSPARC: r = 0.302, 1 − β = 0.681. (I) n = 18–24 photos, siControl: r = 0.565, 1 − β = 0.986, siSPARC: r = 0.256, 1 − β = 0.412.
Fig. 3
Fig. 3. Overexpression of SPARC in the hippocampal neurons recovers memory deficits and promotes axonal growth in 5XFAD mice.
Mouse primary hippocampal neurons were treated with 5 × 10⁵, 106, or 107 GC/µl (A, B) or 5 × 10⁶ GC/µl (C, D) of AAV-Control (AAV9-Syn1-Cerulean-WPRE) or AAV-SPARC (AAV9-Syn1-mSparc-IRES-Cerulean-WPRE) for 7 days. A, B SPARC expression levels in MAP2-positive neurons were quantified for each neuron. ****p < 0.0001 vs same concentration of AAV-Control, one-way ANOVA post-hoc Bonferroni test, mean ± standard error, n = 337–558 neurons. Effect size (r) = 0.193, power (1 − β) = 1. C, D pNF-H-positive axon length was quantified for each treatment. *p < 0.05, one-way ANOVA post-hoc Bonferroni test, mean ± standard error, n = 10–16 photos. r = 0.560, 1 − β = 0.879. EH Wild-type and 5XFAD mice were injected with 1010 GC of AAV-Control or AAV-SPARC in the hippocampal CA1 region. Novel object recognition test was performed at 21 days (E) and object location test was performed at 23 days (F) after AAV injections. The preferential indexes of the training and test sessions are shown. ****p < 0.0001, one-way ANOVA post-hoc Bonferroni test. A significant drug × test interaction was found using repeated-measures two-way ANOVA [F(2, 15) = 24.30, p < 0.0001 (E), [F(2, 15) = 35.74, p < 0.0001 (F), ####p < 0.0001, post-hoc Bonferroni test, mean ± standard deviation, n = 6 mice/group. E r = 0.893, 1 − β = 0.874, F r = 0.891, 1 − β = 0.871. G, H 25 days after AAV injection, colocalization of Cerulean+ axons, synaptophysin+ pre-synapse, and PSD95+ post-synapse on NeuN+ neurons (blue dotted line) in the PFC were quantified in each group. *p < 0.05, ****p < 0.0001, one-way ANOVA post-hoc Bonferroni test, mean ± standard deviation, n = 6 mice/group. H r = 0.814, 1 - β = 0.803. IP Seven days after Dextran Texas Red (1st tracing) was injected into the PFC of wild-type and 5XFAD mice, 1010 GC of AAV-Control or AAV-SPARC was injected into the hippocampal CA1 region. After 21 days, Dextran FITC (2nd tracing) was further injected into the PFC. Seven days after the 2nd tracer injection, the number of axon-growing (Texas Red-, FITC+, NeuN+) neurons (K), axon-degenerating (Texas Red+, FITC, NeuN+) neurons (L), naive (Texas Red+, FITC+, NeuN+) neurons (M), originally projected (Texas Red+, NeuN+) neurons (N), axon-growing and naive (FITC+, NeuN+) neurons (O), NeuN+ neurons (P) in the hippocampal CA1 region were quantified. *p < 0.05, ***p < 0.001, ****p < 0.0001, one-way ANOVA post-hoc Bonferroni test, mean ± standard deviation, n = 6–7 mice/group. K r = 0.938, 1 − β = 0.921, L r = 0.921, 1 − β = 0.913, M r = 0.923, 1 − β = 0.915, N r = 0.866, 1 − β = 0.876, O r = 0.895, 1 − β = 0.897, P r = 0.186, 1 − β = 0.093. Q Wild-type and 5XFAD mice were injected with 1010 GC of AAV-Cont-empty, AAV-Cont-hM4Di, or AAV-SPARC-hM4Di in the hippocampal CA1. At the same time, a cannula was infused into the center position covering the right and left PFC. R Novel object recognition test was performed at 21 days (microinjected with 0.3 µl saline in the PFC) and 23 days (microinjected with 0.3 µl 1 mM CNO in the PFC) after AAV injections. The preferential indexes of the training and test sessions are shown. **p < 0.01, ***p < 0.001, ****p < 0.0001, one-way ANOVA post-hoc Bonferroni test. A significant drug × test interaction was found using repeated-measures two-way ANOVA [F(3, 15) = 19.02, p < 0.0001 (Saline), [F(3, 15) = 10.30, p = 0.0006 (CNO). #p < 0.05, ##p < 0.01, post-hoc Bonferroni test, mean ± standard deviation, n = 4–5 mice/group. Saline: r = 0.931, 1 − β = 0.980, CNO: r = 0.793, 1–β = 0.913.
Fig. 4
Fig. 4. Interaction of SPARC on axonal membranes with extracellular collagen I is required for axonal remodeling.
A, B Mouse primary hippocampal neurons were cultured for 3 days and then treated with or without Aβ25-35 (2.5 µM) for 3 days. Next, neurons were treated with diosgenin (0.1 or 1 µM) or vehicle solution for 4 days. The SPARC level was increased particularly on axonal shafts (yellow arrowheads) in diosgenin-treated neurons (A). SPARC expression level on axons was measured for each treatment (B). *p < 0.05, ***p < 0.001 vs Aβ25-35 (Aβ)/Vehicle (Veh), one-way ANOVA post-hoc Bonferroni test, mean ± standard error, n = 92–427 axons. Effect size (r) = 0.248, power (1 − β) = 1. CE Wild-type and 5XFAD mice were administered diosgenin (Dios; 0.1 µmol/kg/day) or vehicle solution (Veh) for a total of 21 days. On administration day 14, anterograde tracer BDA was injected into the hippocampal CA1 region. After 7 days, BDA-positive axons (red), SPARC expression (green), and DAPI (blue) were detected in the PFC (C). The number of BDA-positive axons (D) and percentage of SPARC-positive and BDA-positive or SPARC-negative and BDA-positive axons (E) was measured for each mouse. *p < 0.05, ***p < 0.001 vs 5XFAD/Veh, one-way ANOVA post-hoc Bonferroni test, mean ± standard deviation, n = 5 mice/group. D r = 0.835, 1 − β = 0.722, E r = 0.887, 1 − β = 0.776. F, G Mouse primary hippocampal neurons were cultured for 14 days and treated with Aβ25-35 (2.5 µM) for 3 days, then with diosgenin (0.1 or 1 µM) or vehicle solution for 4 days. F Dot-like traces of collagen I were observed along degenerated axons in Aβ-treated neurons (blue arrowheads). G Length of axons colocalized with collagen I (pNF-H+, collagen I+) was measured in each group. ***p < 0.001 vs Aβ/Veh, one-way ANOVA post-hoc Bonferroni test, mean ± standard error, n = 12 images/group. r = 0.951, 1 − β = 0.999. H Immunohistochemistry detected pNF-H-positive axons (green) and collagen I (red) in the PFC of wild-type and 5XFAD mice. Collagen I-positive but pNF-H-negative axons was often observed in 5XFAD mice (white arrows). I Mouse primary hippocampal neurons were cultured for 14 days and treated with Aβ25–35 (2.5 µM) for 3 days, then with diosgenin (0.1 or 1 µM) or vehicle solution for 4 days. SPARC on plasma membranes and extracellular collagen I were detected by antibodies in non-permeable immunocytochemistry. SPARC on axonal membranes and its colocalization with collagen I were observed in control and Aβ/Diosgenin groups (yellow arrowheads). Collagen I was observed along degenerated-axons in Aβ-treated neurons (blue arrowheads). J Mouse primary hippocampal neurons were cultured on PDL- or collagen I-coated dishes. AAV-Control or AAV-SPARC (5 × 10⁶ GC/µl) was treated for 7 days, and pNF-H-positive axonal lengths were quantified. *p < 0.05, **p < 0.01, ****p < 0.0001, one-way ANOVA post-hoc Bonferroni test, mean ± standard error, n = 10–17 images/group, r = 0.740, 1 − β = 0.999. K PDL and collagen I were coated on the left and right side, respectively. AAV-Control- or AAV-SPARC (5 × 10⁶ GC/µl)-treated mouse primary hippocampal neurons were seeded on PDL-coated center part. pNF-H-positive axonal lengths were quantified after 14 days. *p < 0.05, ****p < 0.0001, one-way ANOVA; #p < 0.05, two-way ANOVA, post-hoc Bonferroni test, mean ± standard error, 8–13 images/group, r = 0.765, 1 − β = 0.989. A significant SPARC × collagen I interaction was found using repeated-measures two-way ANOVA [F(1, 40) = 5.81, p = 0.0206]. LN Mouse primary hippocampal neurons were seeded on the soma space (gray) of a triple chamber neuron device and treated with 5 × 10⁷ GC/µl AAV-control for 10 days. Cerulean-labeled axons in the microgrooves were observed using live cell imaging on 10 DIV (days in vitro). After that, Aβ25–35 (2.5 µM) was treated to soma (gray) and axonal space (pink) for 3 days. Live cell imaging in 13 DIV confirmed Cerulean-labeled axons that originally extended into the microgrooves were atrophied by Aβ25–35. Then, triple chamber neuron devices were removed, and 5 × 10⁶ GC/µl AAV-control or AAV-SPARC were treated together with 2 µg/ml SPARC neutralizing antibody (SPARC-Ab) or control IgG (IgG). Densities of M axons pursued extracellular collagen I and N axons without pursuing extracellular collagen I were quantified at 20 DIV in each group. *p < 0.05, **p < 0.01, ****p < 0.0001, one-way ANOVA, post-hoc Bonferroni test, mean ± standard error, 12 images/group, M r = 0.847, 1–β = 0.999, N r = 0.644, 1 − β = 0.982.
Fig. 5
Fig. 5. Study summary: Diosgenin-induced axonal growth and corresponding molecular mechanisms in 5XFAD mice brain.
A Diosgenin administration promoted axonal growth from the hippocampus (HPC) to the prefrontal cortex (PFC) in 5XFAD mice. Secreted protein acidic and rich in cysteine (SPARC) was the most expressed molecule in the axon-growing neurons. B Overexpression of SPARC (by AAV9 injection) in 5XFAD HPC (without diosgenin administration) recovered memory function and axonal regeneration in this neural circuit. When SPARC overexpression-driven axonal growth from the HPC to the PFC was silenced by DREADDs, memory recovery of 5XFAD mice was diminished. C SPARC interacted with extracellular rail-like collagen I which remained in the place where axons were originally located. Elevated SPARC, especially on axonal membranes, interacted with the guidepost collagen I, resulting in accurate axonal regeneration in primary cultured HPC neurons.

Similar articles

Cited by

References

    1. Dickson TC, Vickers JC. The morphological phenotype of beta-amyloid plaques and associated neuritic changes in Alzheimer’s disease. Neuroscience. 2001;105:99–107. doi: 10.1016/S0306-4522(01)00169-5. - DOI - PubMed
    1. Honig SL, Vellas B, Woodward M, Boada M, Bullock R, Borrie M, et al. Trial of Solanezumab for mild dementia due to Alzheimer’s disease. N Engl J Med. 2018;378:321–30. doi: 10.1056/NEJMoa1705971. - DOI - PubMed
    1. Hung SY, Fu WM. Drug candidates in clinical trials for Alzheimer’s disease. J Biomed Sci. 2017;24:47. doi: 10.1186/s12929-017-0355-7. - DOI - PMC - PubMed
    1. He Z, Jin Y. Intrinsic control of axon regeneration. Neuron. 2016;90:437–51. doi: 10.1016/j.neuron.2016.04.022. - DOI - PubMed
    1. Jin Y, Dougherty SE, Wood K, Sun L, Cudmore RH, Abdalla A, et al. Regrowth of serotonin axons in the adult mouse brain following injury. Neuron. 2016;91:748–62. doi: 10.1016/j.neuron.2016.07.024. - DOI - PMC - PubMed

Publication types