Meta-Analysis
. 2023 Jul;28(7):2811-2825.
doi: 10.1038/s41380-023-02065-4. Epub 2023 Apr 21.

Insulin effects on core neurotransmitter pathways involved in schizophrenia neurobiology: a meta-analysis of preclinical studies. Implications for the treatment

Affiliations
Meta-Analysis

Insulin effects on core neurotransmitter pathways involved in schizophrenia neurobiology: a meta-analysis of preclinical studies. Implications for the treatment

Andrea de Bartolomeis et al. Mol Psychiatry. 2023 Jul.

Abstract

Impairment of insulin action and metabolic dysregulation have traditionally been associated with schizophrenia, although the molecular basis of such association remains still elusive. The present meta-analysis aims to assess the impact of insulin action manipulations (i.e., hyperinsulinemia, hypoinsulinemia, systemic or brain insulin resistance) on glutamatergic, dopaminergic, γ-aminobutyric acid (GABA)ergic, and serotonergic pathways in the central nervous system. More than one hundred outcomes, including transcript or protein levels, kinetic parameters, and other components of the neurotransmitter pathways, were collected from cultured cells, animals, or humans, and meta-analyzed by applying a random-effects model and adopting Hedges'g to compare means. Two hundred fifteen studies met the inclusion criteria, of which 180 entered the quantitative synthesis. Significant impairments in key regulators of synaptic plasticity processes were detected as the result of insulin handlings. Specifically, protein levels of N-methyl-D-aspartate receptor (NMDAR) subunits including type 2A (NR2A) (Hedges' g = -0.95, 95%C.I. = -1.50, -0.39; p = 0.001; I2 = 47.46%) and 2B (NR2B) (Hedges'g = -0.69, 95%C.I. = -1.35, -0.02; p = 0.043; I2 = 62.09%), and Postsynaptic density protein 95 (PSD-95) (Hedges'g = -0.91, 95%C.I. = -1.51, -0.32; p = 0.003; I2 = 77.81%) were found reduced in insulin-resistant animal models. Moreover, insulin-resistant animals showed significantly impaired dopamine transporter activity, whereas the dopamine D2 receptor mRNA expression (Hedges'g = 3.259; 95%C.I. = 0.497, 6.020; p = 0.021; I2 = 90.61%) increased under insulin deficiency conditions. Insulin action modulated glutamate and GABA release, as well as several enzymes involved in GABA and serotonin synthesis. These results suggest that brain neurotransmitter systems are susceptible to insulin signaling abnormalities, resembling the discrete psychotic disorders' neurobiology and possibly contributing to the development of neurobiological hallmarks of treatment-resistant schizophrenia.


Conflict of interest statement

The author declares no competing interests. The authors have no financial or non-financial interests to disclose with regard to the content and aims of the study therein presented.

Figures
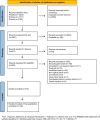
Fig. 1
Fig. 1. PRISMA flow diagram.
Preferred Reporting Items for Systematic Reviews and Meta-Analyses (PRISMA) study selection flow diagram.
Fig. 2
Fig. 2. Effect sizes (Hedges’g) heatmap.
Heatmap illustrating effect sizes (Hedges’g) of each outcome in different models (hyperinsulinemia, hypoinsulinemia, insulin resistance, and brain-limited insulin resistance) grouped into neurotransmitter pathways. The heatmap scale of colors codes the overall effect size (Hedges’g) value (ranging from blue to red as shown in the legend) obtained from each meta-analysis. Red colors implicate higher levels of the outcome in cases whereas blue colors implicate higher levels of outcome in controls. * is used to express a significant result (p<0.05). [3H]-asp binding [3H]-d-aspartate binding, [3H]DA uptake [3H]dopamine uptake, [3-MT] 3-methoxytyramine concentration, [5-HIAA] 5-hydroxyindoleacetic acid concentration, [5-HT] serotonin concentration, [5-HTP] 5-hydroxytryptophan concentration, [DA extracellular] extracellular dopamine concentration, [DA] dopamine concentration, [DOPA] dihydroxyphenylalanine concentration, [DOPAC] 3,4- dihydroxyphenylacetic acid concentration, [D-ser] D-serine concentration, [GABA] gamma-aminobutyric acid concentration, [Glu] glutamate concentration, [Glutamine] glutamine concentration, [Gly] glycine concentration, [HVA] homovanillic acid concentration, [L-ser] L-serine concentration, [Ser] serine concentration, [Trp] tryptophan concentration, [Tyr] tyrosine concentration, 3[H]-AMPAR binding 3[H]-AMPA receptor binding, 3[H]-NMDAR binding 3[H]-NMDA receptor binding, 5-HT R Bmax serotonin receptor maximal binding capacity, 5-HT R Kd serotonin receptor dissociation constant, 5-HT2AR Bmax serotonin receptor 2 A maximal binding capacity, 5-HT2A R Kd serotonin receptor 2A dissociation constant, 5-HTP accumulation 5-hydroxytryptophan accumulation, activity pot n° action potential number, D1R mRNA dopamine D1 receptor mRNA, D2R Bmax dopamine D2 receptor maximal binding capacity, D2R Kd dopamine D2 receptor dissociation constant, D2R prot dopamine D2 receptor protein levels, D3R mRNA dopamine D3 receptor mRNA, D5R mRNA dopamine D5 receptor mRNA, DA clearance dopamine clearance, DA ex fract dopamine extraction fraction, DA turnover dopamine turnover, DAT Bmax dopamine transporter maximal binding capacity, DAT cell surf dopamine transporter cell surface expression, DAT Km dopamine transporter Michaelis constant, DAT mRNA dopamine transporter mRNA, DAT prot dopamine transporter protein levels, DAT Vmax dopamine transporter maximal velocity, DOPA accumulation dihydroxyphenylalanine accumulation, DR Bmax dopamine receptor maximal binding capacity, DR Kd dopamine receptor dissociation constant, DR sens dopamine receptor sensitivity, DβH prot dopamine-β-hydroxylase protein levels, EAAT1 mRNA excitatory amino acid transporter type 1 mRNA, EAAT1 prot excitatory amino acid transporter type 1 protein levels, EAAT2 prot excitatory amino acid transporter type 2 protein levels, EPSCs excitatory postsynaptic currents, GABA t.c. amplitude GABA tonic current amplitude, GABA t.c.d. GABA tonic current density, GABA-A t.c. amplitude GABA A receptor tonic current amplitude, GABA-R Bmax GABA receptor maximal binding capacity, GABA-R Kd GABA receptor dissociation constant, GAD activity glutamic acid decarboxylase activity, GAD mRNA glutamic acid decarboxylase mRNA, GAD-65 prot glutamic acid decarboxylase 65 kDa form protein levels, GAD65/67 prot glutamic acid decarboxylase 65/67 kDa form protein levels, GAD67 prot glutamic acid decarboxylase 67 kDa form protein levels, GDH activity glutamate dehydrogenase activity, GDH Km glutamate dehydrogenase Michaelis constant, GDH Vmax glutamate dehydrogenase maximal velocity, Glu clearance glutamate clearance, Glu uptake glutamate uptake, GluR1 prot glutamate ionotropic receptor AMPA type subunit 1, GluR1 Ser831 ph glutamate ionotropic receptor AMPA type subunit 1 phosphorylation at Ser831, GluR1 Ser845 ph glutamate ionotropic receptor AMPA type subunit 1 phosphorylation at Ser845, GluR2 prot glutamate ionotropic receptor AMPA type subunit 2 protein levels, GluR5 (GRIK1) glutamate ionotropic receptor kainate type 1 subunit, GluR6 (GRIK2) mRNA glutamate ionotropic receptor kainate type 2 subunit mRNA, GS activity glutamine synthase activity, h[Glu] human glutamate concentration, h[Glutamine] human glutamine concentration, KA2 (GRIK5) mRNA glutamate ionotropic receptor kainate type 5 subunit mRNA, MAO activity monoamine oxidases activity, MAO-B mRNA monoamine oxidase B mRNA, mGluR5 mRNAglutamate metabotropic receptor type 5 mRNA, mIPSC amplitude miniature inhibitory postsynaptic currents amplitude, mIPSC Hz miniature inhibitory postsynaptic currents frequency, mIPSCs t.c.d.miniature inhibitory postsynaptic currents total current density, NMDAR Bmax NMDA receptor maximal binding capacity, NMDAR Kd NMDA receptor dissociation constant, NR1 prot glutamate ionotropic receptor NMDA type subunit 1 protein levels, NR2A prot glutamate ionotropic receptor NMDA type subunit 2A protein levels, NR2B  glutamate ionotropic receptor NMDA type subunit 2B protein levels, PSD-95 prot postsynaptic density protein 95 protein levels, SAP-102 prot synapse associated protein 102 protein levels, SERT mRNA serotonin transporter mRNA, sIPSCs amplitude spontaneous inhibitory postsynaptic currents amplitude, sIPSCs Hz spontaneous inhibitory postsynaptic currents frequency, sIPSCs t.c.d. spontaneous inhibitory postsynaptic currents total current density, TH activity tyrosine hydroxylase activity, TH mRNA tyrosine hydroxylase mRNA, TH prot tyrosine hydroxylase protein levels, TH + cell n number of tyrosine hydroxylase + cells, TPH activity tryptophan hydroxylase activity, TPH Km tryptophan hydroxylase Michaelis constant, TPH Vmax tryptophan hydroxylase maximal velocity, Trp accumulation tryptophan accumulation, Tyr accumulation tyrosine accumulation, vGAT prot vesicular GABA transporter protein levels, vGlut1 prot vesicular glutamate transporter 1 protein levels, vGlut2 prot vesicular glutamate transporter 2 protein levels, vMAT mRNA vesicular monoamine transporter mRNA, vMAT1 mRNA vesicular monoamine transporter 1 mRNA, vMAT2 mRNA vesicular monoamine transporter 2 mRNA, α1 mRNA GABA-A receptor α1 subunit mRNA, β2/β3 prot GABA-A receptor β2/β3 subunits protein levels.
Fig. 3
Fig. 3. Glutamatergic outcomes effect sizes (Hedges’g) and 95% confidence intervals.
Effect size and 95% confidence intervals are provided for each outcome included in the glutamatergic pathway and grouped into hyperinsulinemic, hypoinsulinemic, insulin-resistant, and brain insulin-resistant models respectively. [3H]-asp b [3H]-d-aspartate binding, [3H]-NMDA-R b [3H]-NMDA receptor binding, [3H]-AMPA-R b [3H]-AMPA receptor binding, [Glu] glutamate concentration, [Gluta] glutamine concentration, [Gly] glycine concentration, [D-ser] D-serine concentration, [L-ser] L-serine concentration, [Ser] serine concentration, act pot n° activity potential number, EAAT1 mRNA excitatory amino acid transporter type 1 mRNA, EAAT1 prot excitatory amino acid transporter type 1 protein levels, EPSCs excitatory postsynaptic currents, GDH act glutamate dehydrogenase activity, GDH Km glutamate dehydrogenase Michaelis constant, GDH Vmax glutamate dehydrogenase maximal velocity, Glu cl glutamate clearance, Glu upt glutamate uptake, GluR1 prot glutamate ionotropic receptor AMPA type subunit 1 protein levels, GluR1 Ser831 ph glutamate ionotropic receptor AMPA type subunit 1 phosphorylation at Ser831, GluR1 Ser845 ph glutamate ionotropic receptor AMPA type subunit 1 phosphorylation at Ser845, GluR2 prot glutamate ionotropic receptor AMPA type subunit 2 protein levels, GluR5 (GRIK1)  glutamate ionotropic receptor kainate type 1 subunit, GluR6 (GRIK2) mRNA glutamate ionotropic receptor kainate type 2 subunit mRNA, GS act glutamine synthase activity, h[Glu] human glutamate concentration, h[Gluta] human glutamine concentration, KA2 (GRIK5) mRNA glutamate ionotropic receptor kainate type 5 subunit mRNA, mGluR-5 mRNA metabotropic glutamate receptor type 5 subunit mRNA, NMDA-R Bmax NMDA receptor maximal binding capacity, NMDA-R Kd NMDA receptor dissociation constant, NR1 prot glutamate ionotropic receptor NMDA type subunit 1 protein levels, NR2A prot glutamate ionotropic receptor NMDA type subunit 2A protein levels, NR2B prot glutamate ionotropic receptor NMDA type subunit 2B protein level, PSD-95 prot postsynaptic density protein 95 protein levels, SAP-102 prot synapse associated protein 102 protein levels, vGlut1 prot vesicular glutamate transporter 1 protein levels, vGlut2 prot vesicular glutamate transporter 2 protein levels.
Fig. 4
Fig. 4. Dopaminergic outcomes effect sizes (Hedges’g) and 95% confidence intervals.
Effect size and 95% confidence intervals are provided for each outcome included in the dopaminergic pathway and grouped into hyperinsulinemic, hypoinsulinemic, insulin-resistant, and brain insulin-resistant models respectively. [3-MT] 3-methoxytyramine concentration, [3H]DA upt [3H]dopamine uptake, [DA] dopamine concentration, [DA extracell] extracellular dopamine concentration, [DOPA] dihydroxyphenylalanine concentration, [DOPAC] 3,4-dihydroxyphenylacetic acid concentration, [HVA] homovanillic acid concentration, [Tyr] tyrosine concentration, D1R mRNA dopamine D1 receptor mRNA, D2R Bmax dopamine D2 receptor maximal binding capacity, D2R Kd dopamine D2 receptor dissociation constant, D2R mRNA dopamine D2 receptor mRNA, D2R prot dopamine D2 receptor protein levels, D3R mRNA dopamine D3 receptor mRNA, D5R mRNA dopamine D5 receptor mRNA, DA cl dopamine clearance, DA t.o. dopamine turnover, DAT Bmax dopamine transporter maximal binding capacity, DAT cell surf dopamine transporter cell surface expression, DAT ex fract dopamine transporter extraction fraction, DAT Km dopamine transporter Michaelis constant, DAT mRNA dopamine transporter mRNA, DAT prot dopamine transporter maximal protein levels, DAT Vmax dopamine transporter maximal velocity, DβH prot dopamine-β-hydroxylase protein levels, DOPA acc dihydroxyphenylalanine accumulation, DR Bmax dopamine receptor maximal binding capacity, DR Kd dopamine receptor dissociation constant, DR sens dopamine receptor sensitivity, MAO act monoamine oxidases activity, MAO-B mRNA monoamine oxidase B mRNA, TH act tyrosine hydroxylase activity, TH mRNA tyrosine hydroxylase mRNA, TH prot tyrosine hydroxylase protein levels, TH + cell n° number of cells tyrosine hydroxylase+, Tyr acc tyrosine accumulation, vMAT1 mRNA vesicular monoamine transporter 1 mRNA, vMAT2 mRNA vesicular monoamine transporter 2 mRNA.
Fig. 5
Fig. 5. GABAergic outcomes effect sizes (Hedges’g) and 95% confidence intervals.
Effect size and 95% confidence intervals are provided for each outcome included in the GABAergic pathway and grouped into hyperinsulinemic, hypoinsulinemic, and insulin-resistant respectively. α1 GABA-A receptor α1 subunit mRNA, β2/β3 prot GABA-A receptor β2/β3 subunits protein levels, [GABA] GABA concentration, GABA t.c. amp GABA tonic current amplitude, GABA t.c.d. GABA tonic current density, GABA t.o. GABA turnover, GABA upt GABA uptake, GABA-A t.c. amp GABA-A receptor tonic current amplitude, GABA-R Bmax GABA receptor maximal binding capacity, GABA-R Kd GABA receptor dissociation constant, GAD act glutamic acid decarboxylase activity, GAD mRNA glutamic acid decarboxylase mRNA, GAD65 prot glutamic acid decarboxylase 65 kDa form protein levels, GAD65/67 prot glutamic acid decarboxylase 65/67 kDa form protein levels, GAD67 prot glutamic acid decarboxylase 67 kDa form protein levels, mIPSCs amp miniature inhibitory postsynaptic currents amplitude, mIPSCs Hz miniature inhibitory postsynaptic currents frequency, mIPSCs t.c.d. miniature inhibitory postsynaptic currents total current density, sIPSCs amp spontaneous inhibitory postsynaptic currents amplitude, sIPSCs Hz spontaneous inhibitory postsynaptic currents frequency, sIPSCs t.c.d. spontaneous inhibitory postsynaptic currents total current density, vGAT prot vesicular GABA transporter protein levels.
Fig. 6
Fig. 6. Serotonergic outcomes effect sizes (Hedges’g) and 95% confidence intervals.
Effect size and 95% confidence intervals are provided for each outcome included in the serotonergic pathway and grouped into hyperinsulinemic, hypoinsulinemic, and insulin-resistant models respectively. In the hypoinsulinemic model, TPH V max and SERT mRNA values have been scaled for easier viewing; the real values have been reported in the supplementary materials. [5-HIAA] 5-hydroxy indole acetic acid concentration; [5-HT] serotonin concentration; [5-HTP] 5-hydroxytryptophan concentration; [Trp] tryptophan concentration; 5-HT R Bmax serotonin receptor maximal binding capacity; 5-HT R Kd serotonin receptor dissociation constant; 5-HT2A R Bmax serotonin receptor 2 A maximal binding capacity; 5-HT2A R Kd serotonin receptor 2A dissociation constant; 5-HTP acc 5-hydroxytryptophan accumulation; SERT mRNA serotonin transporter mRNA; TPH act tryptophan hydroxylase activity; TPH Km tryptophan hydroxylase Michaelis constant; TPH Vmax tryptophan hydroxylase maximal velocity; Tryp acc tryptophan accumulation.

Similar articles

Cited by

References

    1. Rummel-Kluge C, Komossa K, Schwarz S, Hunger H, Schmid F, Lobos CA, et al. Head-to-head comparisons of metabolic side effects of second generation antipsychotics in the treatment of schizophrenia: a systematic review and meta-analysis. Schizophr Res. 2010;123:225–33. doi: 10.1016/j.schres.2010.07.012. - DOI - PMC - PubMed
    1. Kohen D. Diabetes mellitus and schizophrenia: historical perspective. Br J Psychiatry Suppl. 2004;47:S64–66. doi: 10.1192/bjp.184.47.s64. - DOI - PubMed
    1. Yang W, Zheng L, Zheng B, Zeng S, Li J, Liang B, et al. A meta-analysis of abnormal glucose metabolism in first-episode drug-naive schizophrenia. Psychiatr Danubina. 2020;32:46–54. doi: 10.24869/psyd.2020.46. - DOI - PubMed
    1. Arranz B, Rosel P, Ramírez N, Dueñas R, Fernández P, Sanchez JM, et al. Insulin resistance and increased leptin concentrations in noncompliant schizophrenia patients but not in antipsychotic-naive first-episode schizophrenia patients. J Clin Psychiatry. 2004;65:1335–42. doi: 10.4088/JCP.v65n1007. - DOI - PubMed
    1. Garcia-Rizo C, Kirkpatrick B, Fernandez-Egea E, Oliveira C, Bernardo M. Abnormal glycemic homeostasis at the onset of serious mental illnesses: a common pathway. Psychoneuroendocrinology. 2016;67:70–75. doi: 10.1016/j.psyneuen.2016.02.001. - DOI - PMC - PubMed