. 2023 Jun;33(6):421-433.
doi: 10.1038/s41422-023-00802-6. Epub 2023 Apr 21.

Single-cell RNA sequencing reveals the developmental program underlying proximal-distal patterning of the human lung at the embryonic stage

Affiliations

Single-cell RNA sequencing reveals the developmental program underlying proximal-distal patterning of the human lung at the embryonic stage

Shangtao Cao et al. Cell Res. 2023 Jun.

Abstract

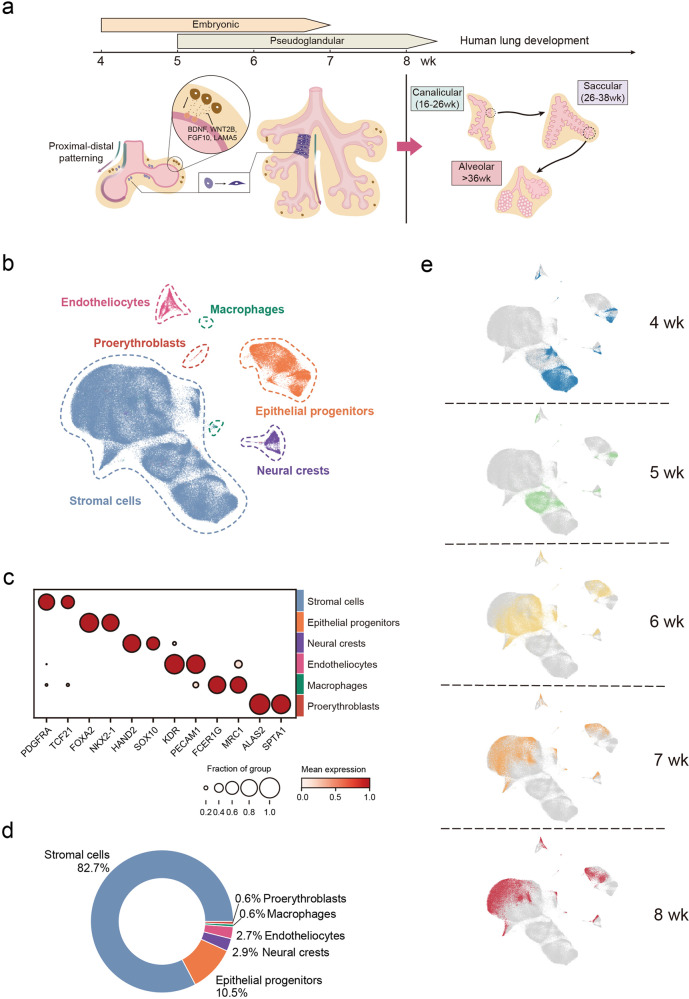
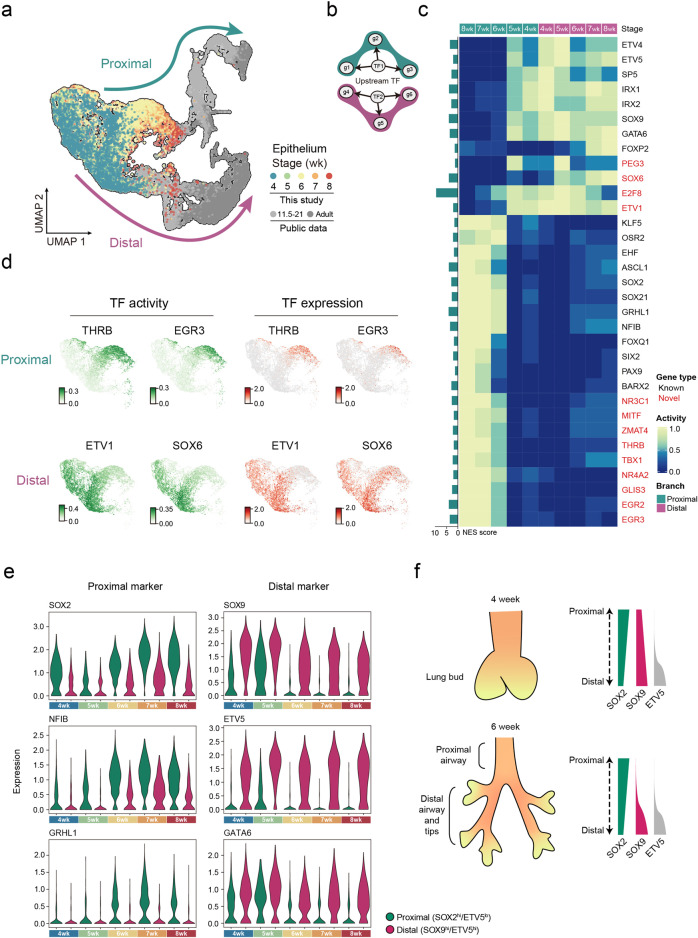
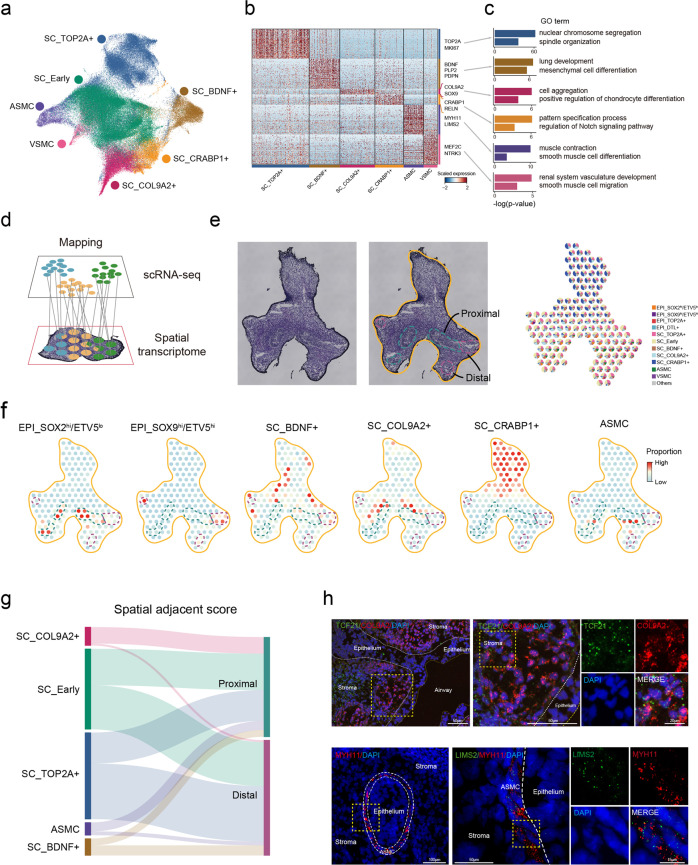
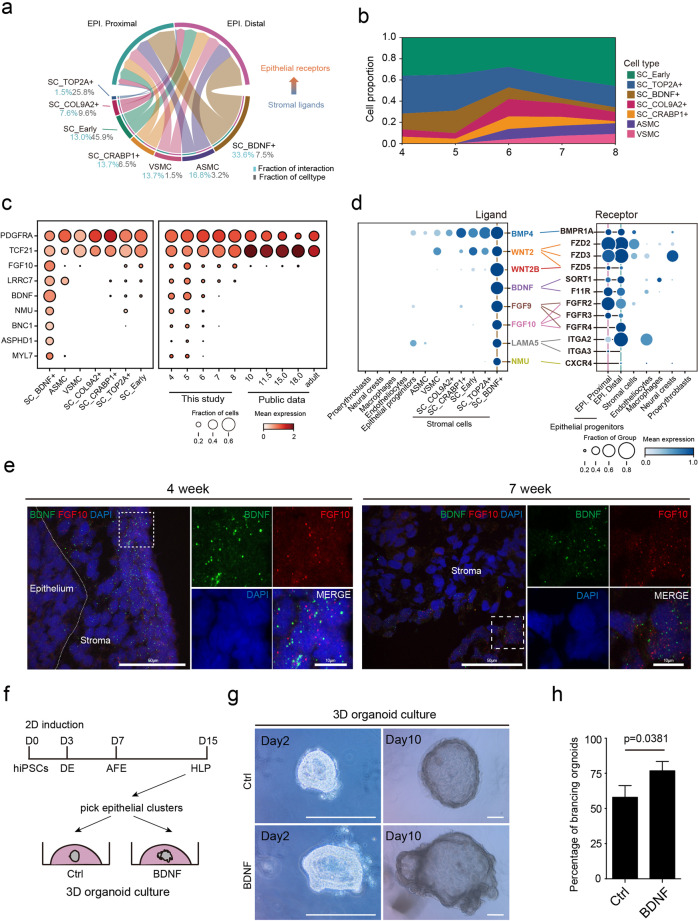
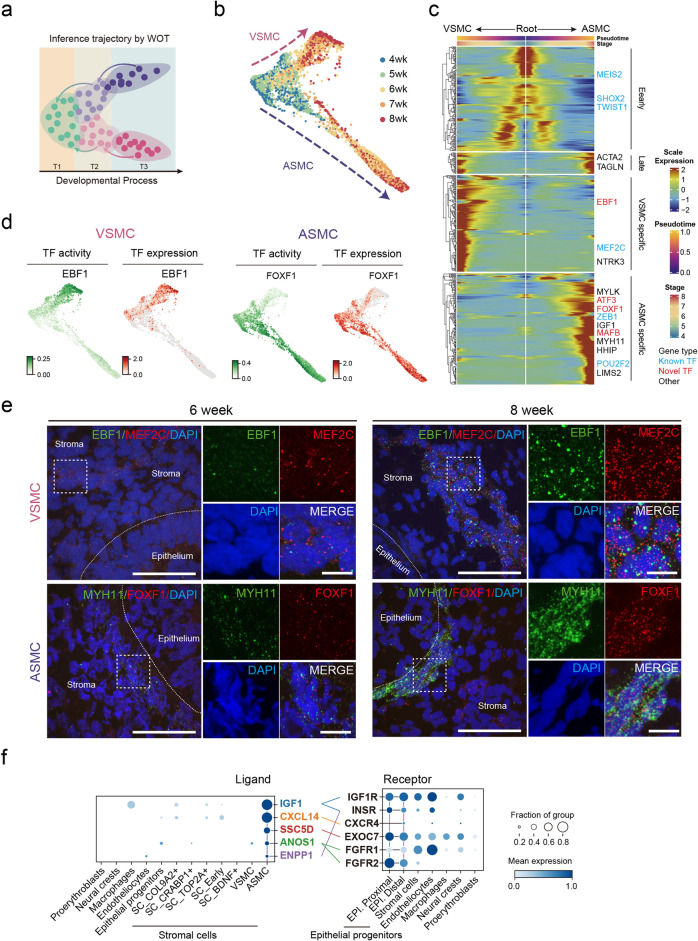
The lung is the primary respiratory organ in human, in which the proximal airway and the distal alveoli are responsible for air conduction and gas exchange, respectively. However, the regulation of proximal-distal patterning at the embryonic stage of human lung development is largely unknown. Here we investigated the early lung development of human embryos at weeks 4-8 post fertilization (Carnegie stages 12-21) using single-cell RNA sequencing, and obtained a transcriptomic atlas of 169,686 cells. We observed discernible gene expression patterns of proximal and distal epithelia at week 4, upon the initiation of lung organogenesis. Moreover, we identified novel transcriptional regulators of the patterning of proximal (e.g., THRB and EGR3) and distal (e.g., ETV1 and SOX6) epithelia. Further dissection revealed various stromal cell populations, including an early-embryonic BDNF+ population, providing a proximal-distal patterning niche with spatial specificity. In addition, we elucidated the cell fate bifurcation and maturation of airway and vascular smooth muscle progenitor cells at the early stage of lung development. Together, our study expands the scope of human lung developmental biology at early embryonic stages. The discovery of intrinsic transcriptional regulators and novel niche providers deepens the understanding of epithelial proximal-distal patterning in human lung development, opening up new avenues for regenerative medicine.


Conflict of interest statement

The authors declare no competing interests.

Figures

Fig. 1
Fig. 1. Major pulmonary cell types emerge at the initiation of human embryonic lung development.
a Schematic overview of scRNA-seq experimental design focusing on embryonic and pseudoglandular stages of human lung development. Sample images are presented in Supplementary information. Fig. S1b. b t-SNE projection visualizing 169,686 human embryonic lung cells, clustered into six major cell types. c Dot plot showing the top 2 cell type marker expression. The size and color of each dot represent the expression percentage and average expression of the indicated gene in each cell type, respectively. d Pie plot showing the proportions of six major cell types. e t-SNE layout mapping the distribution of single-cell profiles of each time point denoted as the embryonic week (wk).
Fig. 2
Fig. 2. TFs regulate early epithelial proximal–distal patterning.
a UMAP layout showing the integration of human epithelial scRNA-seq dataset from this study (colored by sample collection time points) and published datasets, (colored by gray). Upper (green arrow) and lower (magenta arrow) trajectories represent proximal and distal epithelial lineages, separately. b Illustration of TF–gene regulons, inferred by SCENIC. c Heatmap showing temporal changes of regulon activity in proximal (green) and distal (magenta) branches. The bar graph on the left represents the Normalized Enrichment Score (NES) of each TF. Genes marked in red are newly identified TFs in this study. d TF activity (green) and expression (red) of proximal-specific THRB and EGR3 (above) and distal-specific ETV1 and SOX6 (bottom) during weeks 4–8 are projected on UMAP. SCENIC-generated TF activity, represented by AUC score, reflects the co-expression strength of TF and its target genes. e Violin plots showing the expression of the SOX2, NFIB, GRHL1, SOX9, ETV5 and GATA6 in EPI_SOX2hi/ETV5lo and EPI_SOX9hi/ETV5hi cells from weeks 4–8. f Illustrations of the proximal–distal patterning and marker gene expression.
Fig. 3
Fig. 3. Multiple stromal cell types exhibit proximal–distal spatial heterogeneity.
a Seven stromal cell subtypes were identified based on Leiden clustering (r = 0.3). b Heatmap showing differentially expressed genes (DEGs) of six stromal cell subtypes, with no DEGs for SC_Early (Wilcoxon rank-sum test, P value < 0.01). c Bar plots showing the GO terms enriched in six stromal cell subtypes. GO enrichment was performed by clusterProfiler. d Illustration of mapping single-cell transcriptome data to spatial transcriptome data (10× Visium) using Tangram algorithm. e Frozen section of a 6-week human lung (left panel). The illustration in the middle panel shows the outline of lung (colored by orange), the proximal epithelium (colored by green) and the distal epithelium (colored by magenta). Pie plots show the proportion of cell types mapped to each Visium spot from single-cell transcriptome data (right panel). f Dot plots showing the proportion of two epithelial cell types and four stromal cell types mapped to 10× Visium spots. The colored dash lines highlight the proximal and distal regions as illustrated in e. g Sankey plot showing the spatial adjacency of stromal cell types and two epithelial cell types. The line indicates the proportion of stromal subtypes in the epithelium-located spots in the proximal or distal region and the surrounding spots, with thicker lines indicating more stromal cells adjacent to the proximal or distal epithelium, and vice versa (Supplementary information, Table S11; see Materials and Methods). The absence of a connection between stromal and epithelial subtypes means no proximity. h smiFISH showing the expression of COL9A2 (red) and TCF21 (green) in SC_ COL9A2+ along the bronchus, and LIMS2 (green) and MYH11 (red) in ASMC surrounding epithelial cells in the lung at week 8. Data are representative of at least three independent smiFISH experiments.
Fig. 4
Fig. 4. SC_BDNF+ stromal cells provide signals for early lung epithelial development.
a Circos plot illustrating significant ligand–receptor interactions among stromal cells and epithelial cells, determined by permutation test (see Materials and Methods). The percentage in gray represents the proportion of ligand–receptor pairs of each stromal subtype; the percentage in blue represents the proportion of each stromal subtype in all stromal cells. EPI epithelial progenitors. b Stack plot showing the cell proportion of seven stromal subtypes during weeks 4–8. c Dot plot showing the specific gene expression profile of SC_BDNF+ across stromal cell types (left frame) and developmental stages (right frame; weeks 4–8, this study; after week 10, previous studies,,). The size and color of each dot represent the expression percentage and expression level of the indicated marker gene within each cell type (left frame) and at each time point (right frame), respectively. d Dot plot showing the expression percentage and level of ligands (left) and receptors (right) among stromal and epithelial cell types, which highlights a high ligand–receptor interaction between SC_BDNF+ and epithelial cells. Colored lines connect ligand–receptor pairs. e smiFISH (left) showing the expression of BDNF and FGF10 in a group of stromal cells located around the epithelial cells and in the border region of the lung at week 4 while only in the border region at week 7. Data are representative of at least two independent smiFISH experiments. Scale bars, 50 μm (long), 10 μm (short). f Schematic diagram showing human lung epithelial organoids generated from hiPSCs and used for the validation of BDNF effects. DE definitive endoderm, AFE anterior foregut endoderm, HLP human lung progenitors. g Representative morphologies showing that BDNF promotes human lung organoid branching compared with the control group. Data are representative of 10–15 organoids from each of three independent experiments. Scale bars, 250 μm. h Quantification of the percentages of branching organoids upon the addition of BDNF. Data are means ± SD, n = 3 independent experiments. Unpaired Student’s t-test, P < 0.05.
Fig. 5
Fig. 5. The developmental trajectory inferences of ASMC and VSMC.
a Schematic diagram of WOT, an approach for trajectory inference using time-course information. b Force-directed layout embedding (FLE) to visualize the WOT-inferred VSMC and ASMC developmental trajectories, colored by time points. Upper (red arrow) and lower (purple arrow) trajectories represent VSMC and ASMC lineages, respectively. c Heatmap showing the dynamics of gene expression along Palantir pseudotime of ASMC and VSMC development. Genes marked in blue are known TFs, and those in red are newly identified TFs in this study. d TF activity and expression of VSMC-specific EBF1 (left) and ASMC-specific FOXF1 (right) were projected on FLE layout. TF activity reflects the co-expression strength of TF and its target genes. e smiFISH showing the expression of EBF1 (green) and MEF2C (red) in VSMC and MYH11 (green) and FOXF1 (red) in ASMC in the lung at weeks 6 and 8, respectively. Data are representative of at least two independent smiFISH experiments. Scale bars, 50 μm (long), 10 μm (short). f Dot plots showing the expression percentage and level of ligands (left) and receptors (right) between the providers (i.e., stromal cells including ASMC) and the recipients (i.e., epithelial cells). Colored lines connect ligand–receptor pairs.

Comment in

Similar articles

Cited by

References

    1. Swarr DT, Morrisey EE. Lung endoderm morphogenesis: gasping for form and function. Annu. Rev. Cell Dev. Biol. 2015;31:553–573. doi: 10.1146/annurev-cellbio-100814-125249. - DOI - PMC - PubMed
    1. Burri PH. Fetal and postnatal development of the lung. Ann. Rev. Physiol. 1984;46:617–628. doi: 10.1146/annurev.ph.46.030184.003153. - DOI - PubMed
    1. Rackley CR, Stripp BR. Building and maintaining the epithelium of the lung. J. Clin. Invest. 2012;122:2724–2730. doi: 10.1172/JCI60519. - DOI - PMC - PubMed
    1. Nikolic MZ, Sun D, Rawlins EL. Human lung development: recent progress and new challenges. Development. 2018;145:dev163485. doi: 10.1242/dev.163485. - DOI - PMC - PubMed
    1. Domyan ET, Sun X. Patterning and plasticity in development of the respiratory lineage. Dev. Dyn. 2011;240:477–485. doi: 10.1002/dvdy.22504. - DOI - PMC - PubMed

Publication types