. 2023 Apr 21;11(1):86.
doi: 10.1186/s40168-023-01534-w.

Mucin-microbiome signatures shape the tumor microenvironment in gastric cancer

Affiliations

Mucin-microbiome signatures shape the tumor microenvironment in gastric cancer

Baptiste Oosterlinck et al. Microbiome. .

Abstract

Background and aims: We aimed to identify mucin-microbiome signatures shaping the tumor microenvironment in gastric adenocarcinomas and clinical outcomes.

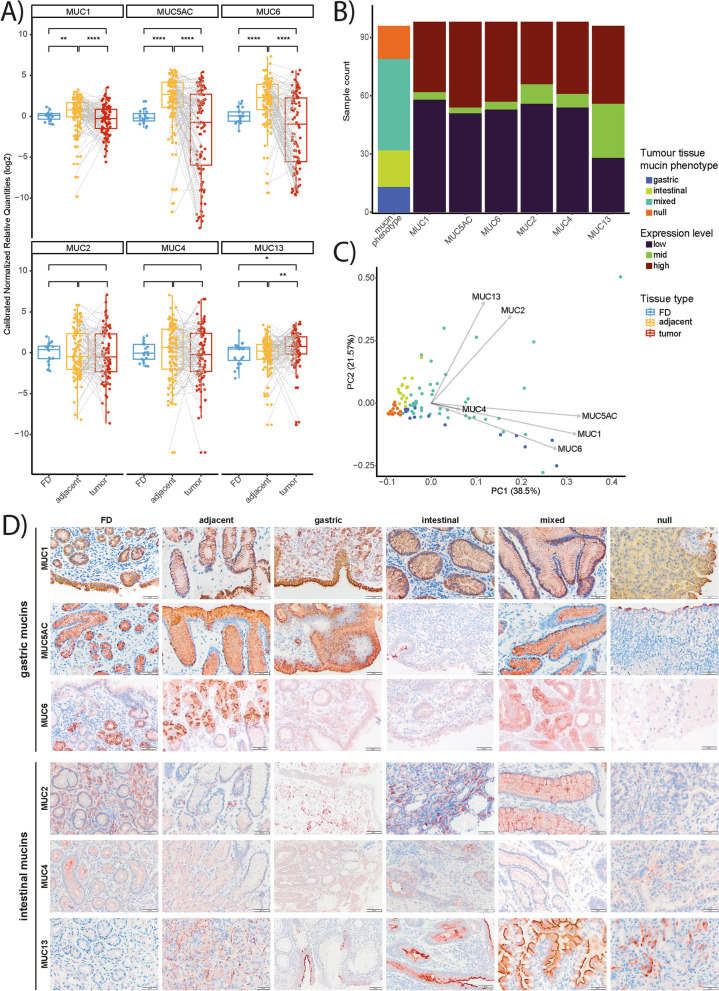
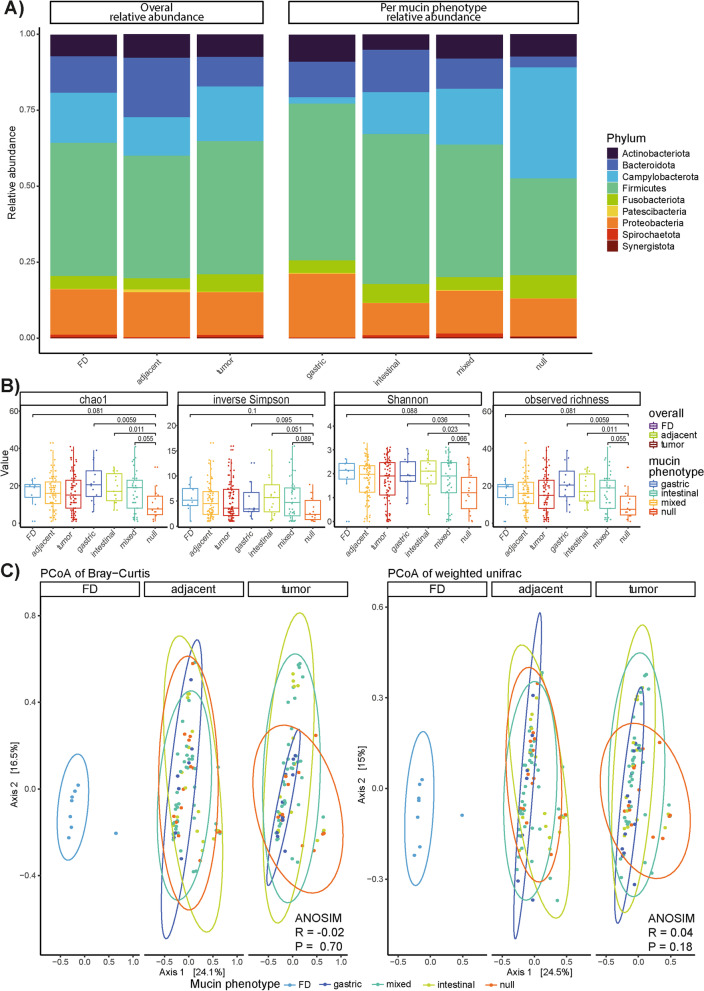
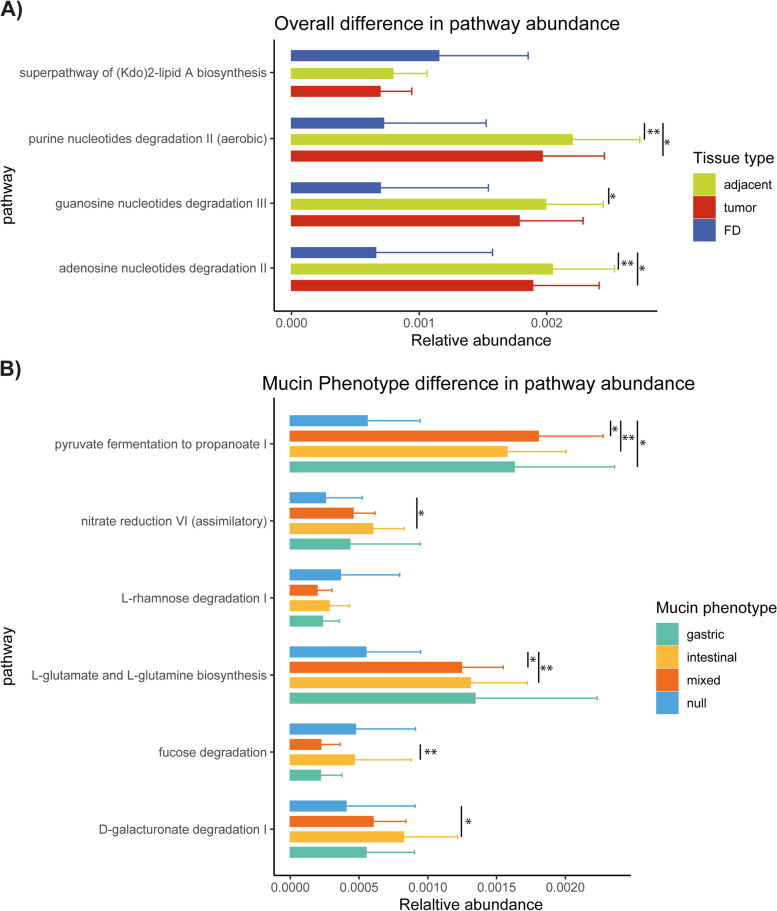
Methods: We performed high-throughput profiling of the mucin phenotypes present in 108 gastric adenocarcinomas and 20 functional dyspepsia cases using validated mucin-based RT-qPCRs with subsequent immunohistochemistry validation and correlated the data with clinical outcome parameters. The gastric microbiota was assessed by 16S rRNA gene sequencing, taxonomy, and community composition determined, microbial networks analyzed, and the metagenome inferred in association with mucin phenotypes and expression.

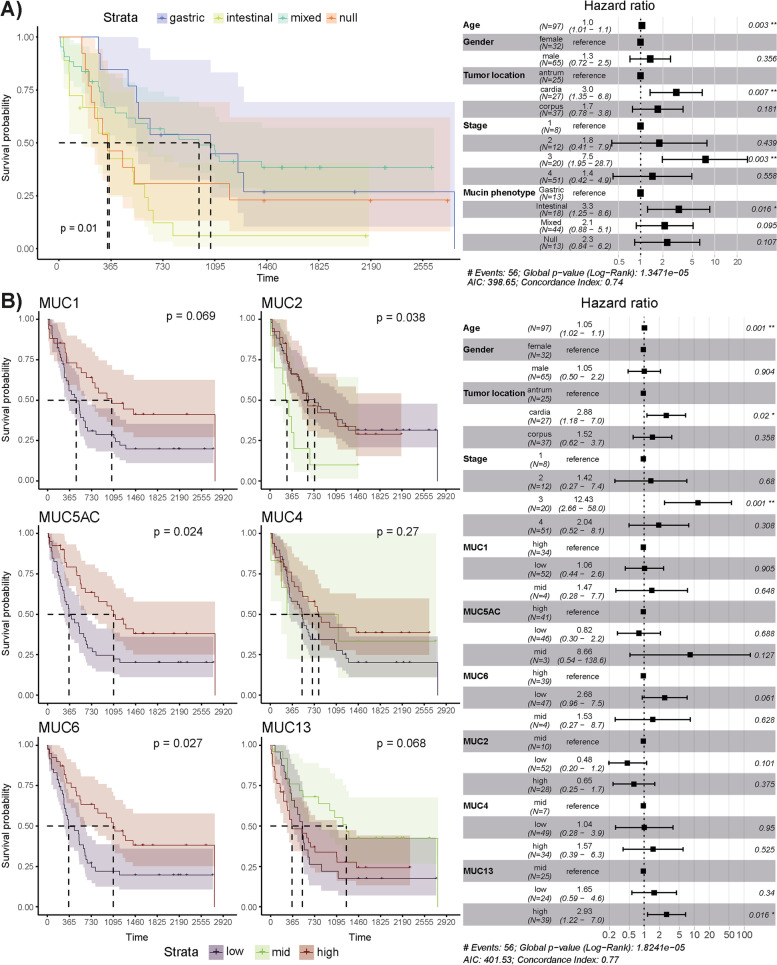
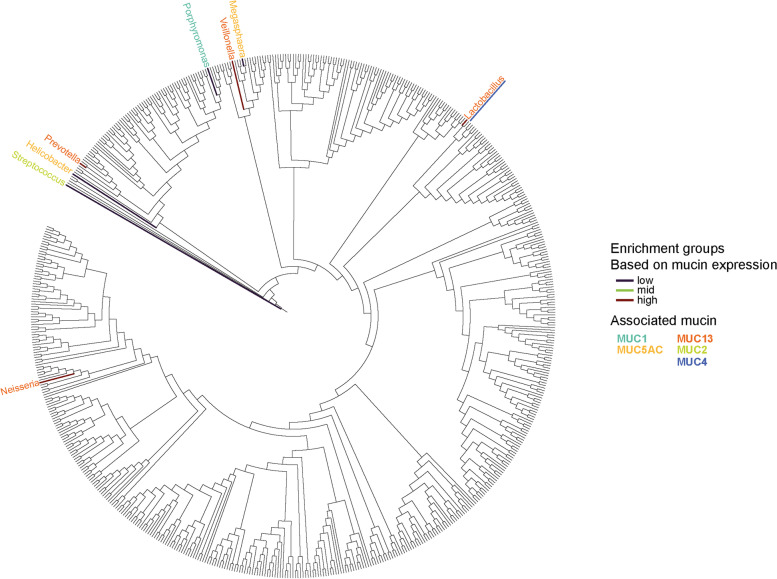
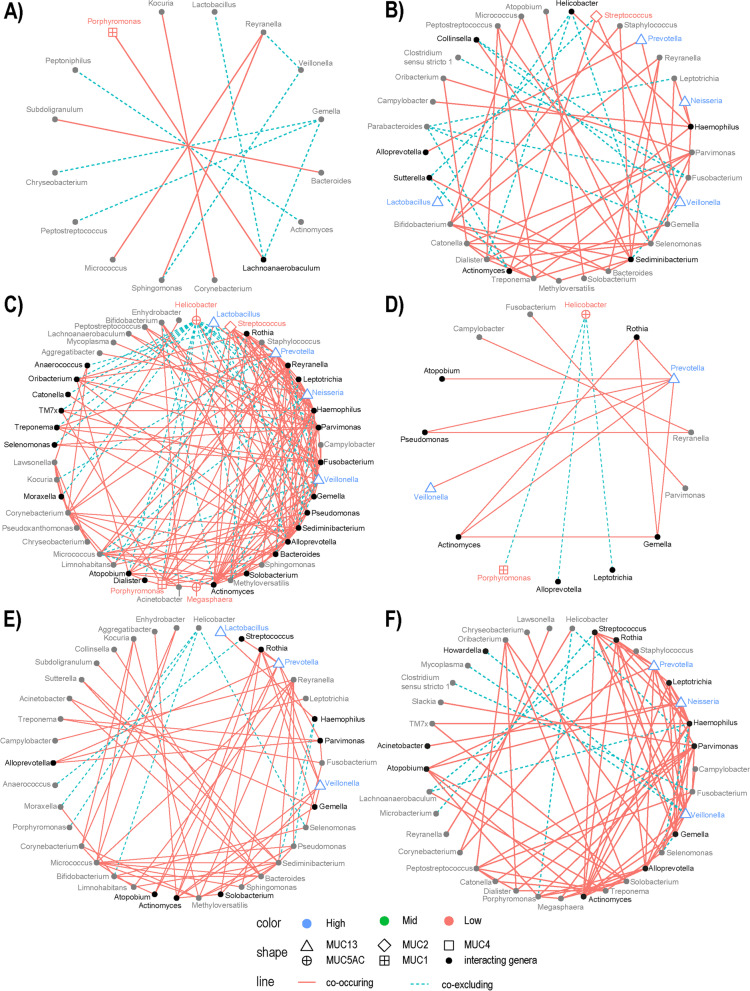
Results: Gastric adenocarcinomas with an intestinal mucin environment or high-level MUC13 expression are associated with poor survival. On the contrary, gastric MUC5AC or MUC6 abundance was associated with a more favorable outcome. The oral taxa Neisseria, Prevotella, and Veillonella had centralities in tumors with intestinal and mixed phenotypes and were associated with MUC13 overexpression, highlighting their role as potential drivers in MUC13 signaling in GC. Furthermore, dense bacterial networks were observed in intestinal and mixed mucin phenotype tumors whereas the lowest community complexity was shown in null mucin phenotype tumors due to higher Helicobacter abundance resulting in a more decreased diversity. Enrichment of oral or intestinal microbes was mucin phenotype dependent. More specifically, intestinal mucin phenotype tumors favored the establishment of pro-inflammatory oral taxa forming strong co-occurrence networks.

Conclusions: Our results emphasize key roles for mucins in gastric cancer prognosis and shaping microbial networks in the tumor microenvironment. Specifically, the enriched oral taxa associated with aberrant MUC13 expression can be potential biomarkers in predicting disease outcomes. Video Abstract.

Keywords: Microbiota; Mucin; Stomach cancer; Survival.


Conflict of interest statement

The authors declare no competing interests.

Figures

Fig. 1
Fig. 1
Aberrant mucin signatures in the stomach of GC patients compared to FD patients. A Relative mRNA expression of gastric (MUC1, MUC5AC, and MUC6; n = 100) and intestinal mucins (MUC2, MUC4, and MUC13; n = 100, 99, and 97, respectively) in gastric biopsies from FD patients (n = 20) and paired (highlighted by gray dashed lines) tumor and adjacent non-tumor tissues of 3 GC patient cohorts. Significant differences between FD, tumor, and adjacent non-tumor tissues are indicated by *P < 0.05, **P < 0.01, ***P < 0.001, and ****P < 0.0001 (Wilcoxon rank-sum test). B The bar sizes represent the number of patients per mucine phenotype (null, n = 13; intestinal, n = 19; mixed, n = 47; null, n = 17) or expression level (i.e., high, mid, or low expression of MUC1, MUC5AC, MUC6, MUC2, MUC4, and MUC13). For each mucin expression level, the mean CNRQ (SD) is shown here: MUC1, high: 3.01 (2.05), mid: 1.07 (0.08), low: 0.46 (0.29); MUC5AC, high: 10.8 (9.04), mid: 1.38 (0.03), low: 0.13 (0.22); MUC6, high: 9.72 (10.82), mid: 1.39 (0.2), low: 0.11 (0.2); MUC2, high: 15.94 (25.98), mid:1.35 (0.13), low: 0.33 (0.28); MUC4, high: 14.72 (22.91), mid: 1.29 (0.19), low: 0.35 (0.3); and MUC13, high: 5.27 (2.88), mid: 1.56 (0.33), low: 0.47 (0.3). C PCA plot based on mucin mRNA expression in tumor and adjacent non-tumor tissues of 3 GC patient cohorts (n = 97–100). PC1 explains 38.5% of the variation; PC2 explains 21.57% of the variation. D Immunohistochemistry was assessed to analyze MUC1, MUC2, MUC5AC, MUC4, MUC6, and MUC13 protein expression in the different tissue types (n = 5 per tissue type; i.e., FD, adjacent non-tumor, and gastric adenocarcinomas with gastric, intestinal, mixed, or null mucin phenotypes). Representative images were selected. Pictures were taken at 20 × magnification and scale bars are 20 µm or 50 µm
Fig. 2
Fig. 2
Intestinal mucin phenotype and aberrant MUC13 expression correlate with worse survival in GC patients. A Kaplan–Meier curve (left-hand side) and Cox-proportional hazards model (right-hand side) for survival analysis between patients with gastric tumors assigned to different mucin phenotypes (A) and showing low, mid, or high mRNA levels of a gastric (MUC1, MUC5AC, MUC6) or intestinal (MUC2, MUC4, MUC13) mucin (B). For the gastric mucins (MUC5AC, MUC6, and MUC1), the mid-level expression data was excluded due to a small number of observations (n ≤ 4). A forest plot of the Cox-proportional hazards model is shown (right). For the Kaplan–Meier curves (left), the P values were calculated using the log-rank test whereas the Wald test statistic was performed for the Cox-proportional hazards model (n for each group is shown on the forest plot)
Fig. 3
Fig. 3
Differences in microbiota composition between FD, tumor, and adjacent non-tumor tissues and between tumors with gastric, intestinal, mixed, and null mucin phenotypes. A Mean relative abundance of phyla in all tissue types (FD, tumor, and adjacent non-tumor samples; n = 8, 83, and 80, respectively) and in each mucin phenotype group assigned to the gastric tumor samples (gastric, intestinal, mixed, and null; n = 12, 15, 41, and 14, respectively). B Boxplots of four common alpha-diversity indices (i.e., chao1, inverse Simpson, observed richness, and Shannon index) for FD, tumor, and adjacent non-tumor tissues (n = 8, 83, and 80, respectively) as well as for tumors with gastric, intestinal, mixed, and null mucin phenotypes (n = 12, 15, 41, and 14, respectively). C PCoA using the Bray–Curtis (left) and weighted unifrac (right) distance measures for FD, tumor, and adjacent non-tumor tissue samples (n = 8, 83, and 80, respectively). The points were colored according to the mucin phenotype assigned to each tumor. The percentage of variance captured by the axes and the 95% confidence intervals per mucin phenotype (drawn as ellipses) are also shown
Fig. 4
Fig. 4
Phylogenetic tree of GC-enriched and GC-depleted bacteria associated with aberrant mucin expression. Genera that are significantly abundant or underrepresented in gastric tumors (n = 82) with mid, low, or high mRNA expression of a gastric (MUC1, MUC5AC, MUC6) or intestinal (MUC2, MUC4, MUC13) mucin are shown by color. The colored branches highlight the mucin mRNA expression levels (low, mid, or high) whereas the corresponding-colored genera represent the mucins they associate with. In case of overlapping mucin associations, the color of the underlining indicates the second mucin association
Fig. 5
Fig. 5
Correlation of GC-enriched and GC-depleted genera associated with a mucin phenotype or aberrant MUC13 expression. Each sphere represents the bacterial network of gastric adenocarcinomas with A gastric mucin phenotype (n = 12), B intestinal mucin phenotype (n = 15), C mixed mucin phenotype (n = 41), D null mucin phenotype (n = 14), E low MUC13 mRNA expression (n = 26), and F high MUC13 mRNA expression (n = 34). Each genus found to participate in the bacterial community is represented by a point and connected through lines with interacting bacterial taxa. The red lines are positive associations between bacterial genera while the blue dotted lines are negative interactions. The point shape represents the association between a genus and a specific mucin (i.e., the genus is found to be differentially abundant with different expression levels of the mucin). The color of the point (+ genus name) represents the mucin mRNA expression level in which the genus was found to be enriched. If the genus was not found to be differentially abundant with different mucin expression levels, the shape is a full circle that is either gray (does not directly interact with other genera associated with a specific mucin) or black (the genus interacts directly with a mucin-associated bacterial taxa)
Fig. 6
Fig. 6
Relative abundance of metagenomic pathways is defined by the mucin phenotype present in gastric adenocarcinomas. Functional classification of the predicted metagenome content of the microbiota of FD, tumor, and adjacent non-tumor samples (n = 8, 83, and 80, respectively) (A) and of gastric adenocarcinomas with gastric, intestinal, mixed, or null mucin phenotypes (n = 12, 15, 41, and 14, respectively) (B) using PICRUSt2. Significance was considered for P < 0.05 and indicated by *P < 0.05 and **P < 0.01

Similar articles

Cited by

References

    1. Sung H, Ferlay J, Siegel RL, Laversanne M, Soerjomataram I, Jemal A, et al. Global Cancer Statistics 2020: GLOBOCAN estimates of incidence and mortality worldwide for 36 cancers in 185 countries. CA Cancer J Clin. 2021;71:209–49. doi: 10.3322/caac.21660. - DOI - PubMed
    1. Hunt RH, Camilleri M, Crowe SE, El-Omar EM, Fox JG, Kuipers EJ, et al. The stomach in health and disease. Gut BMJ Publishing Group. 2015;64:1650–1668. - PMC - PubMed
    1. Correa P. Human gastric carcinogenesis: a multistep and multifactorial process--First American Cancer Society Award Lecture on Cancer Epidemiology and Prevention. Cancer Res. 1992;52(24):6735-40. - PubMed
    1. Lofgren JL, Whary MT, Ge Z, Muthupalani S, Taylor NS, Mobley M, et al. Lack of Commensal Flora in Helicobacter pylori–infected INS-GAS mice reduces gastritis and delays intraepithelial neoplasia. Gastroenterology. 2011;140:210–220.e4. doi: 10.1053/j.gastro.2010.09.048. - DOI - PMC - PubMed
    1. Ferreira RM, Pereira-Marques J, Pinto-Ribeiro I, Costa JL, Carneiro F, Machado JC, et al. Gastric microbial community profiling reveals a dysbiotic cancer-associated microbiota. Gut. 2018;67:226–236. doi: 10.1136/gutjnl-2017-314205. - DOI - PMC - PubMed

Publication types