. 2023 Apr 21;27(1):158.
doi: 10.1186/s13054-023-04436-3.

Identification of a sub-group of critically ill patients with high risk of intensive care unit-acquired infections and poor clinical course using a transcriptomic score

Affiliations

Identification of a sub-group of critically ill patients with high risk of intensive care unit-acquired infections and poor clinical course using a transcriptomic score

Maxime Bodinier et al. Crit Care. .

Abstract

Background: The development of stratification tools based on the assessment of circulating mRNA of genes involved in the immune response is constrained by the heterogeneity of septic patients. The aim of this study is to develop a transcriptomic score based on a pragmatic combination of immune-related genes detected with a prototype multiplex PCR tool.

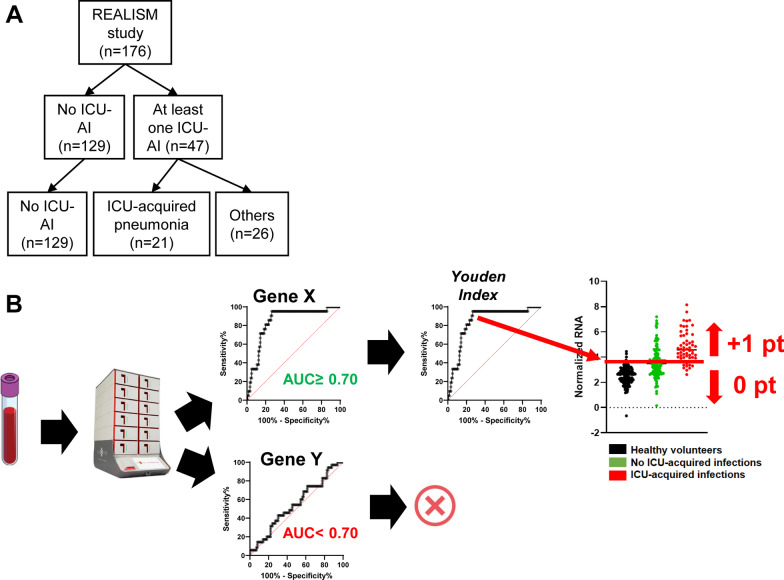
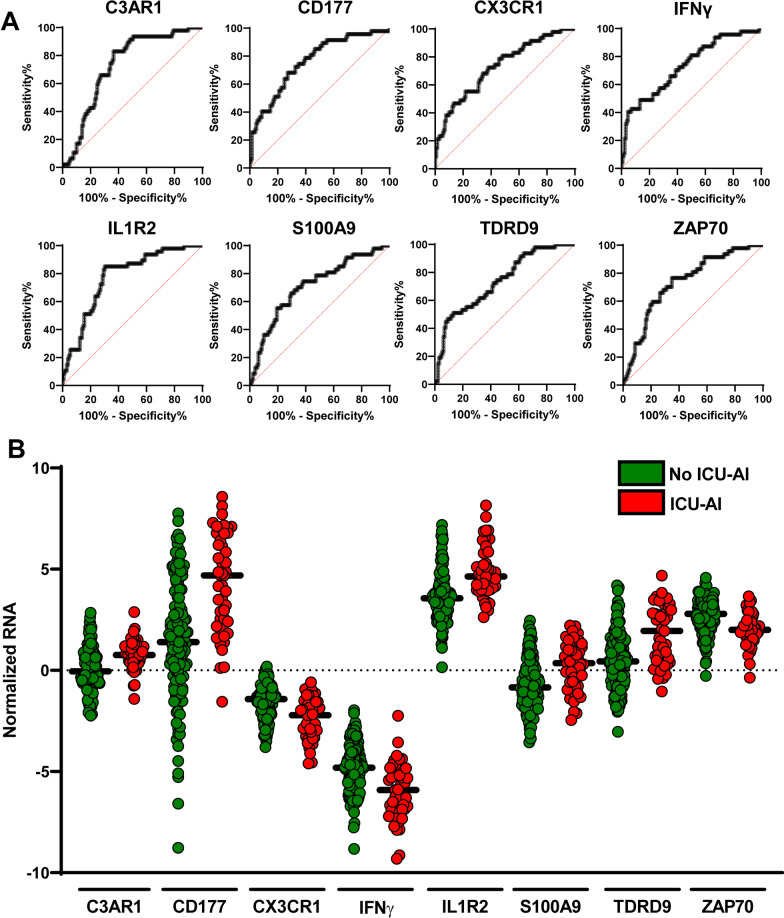
Methods: As training cohort, we used the gene expression dataset obtained from 176 critically ill patients enrolled in the REALISM study (NCT02638779) with various etiologies and still hospitalized in intensive care unit (ICU) at day 5-7. Based on the performances of each gene taken independently to identify patients developing ICU-acquired infections (ICU-AI) after day 5-7, we built an unweighted score assuming the independence of each gene. We then determined the performances of this score to identify a subgroup of patients at high risk to develop ICU-AI, and both longer ICU length of stay and mortality of this high-risk group were assessed. Finally, we validated the effectiveness of this score in a retrospective cohort of 257 septic patients.

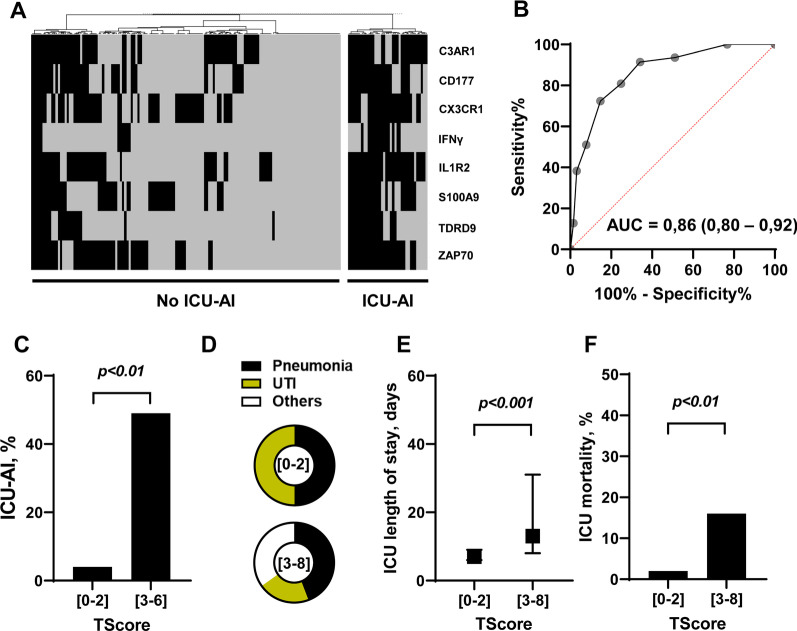
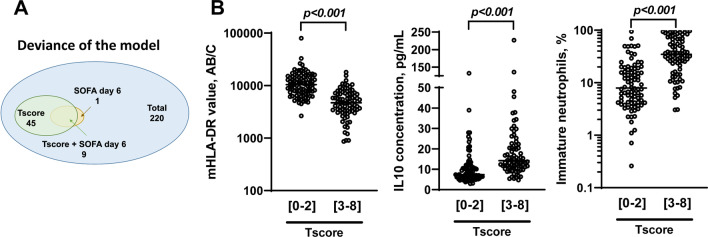
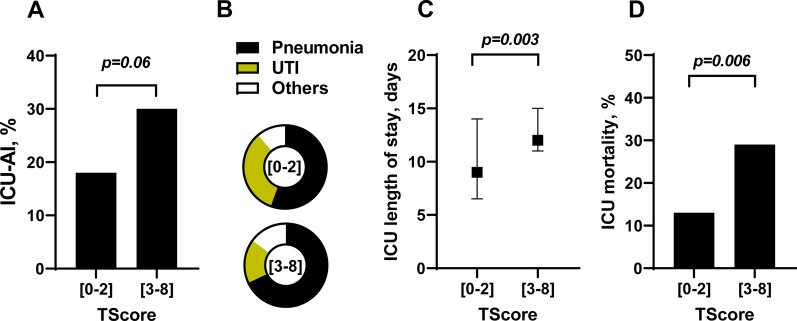
Results: This transcriptomic score (TScore) enabled the identification of a high-risk group of patients (49%) with an increased rate of ICU-AI when compared to the low-risk group (49% vs. 4%, respectively), with longer ICU length of stay (13 days [95% CI 8-30] vs. 7 days [95% CI 6-9], p < 0.001) and higher ICU mortality (15% vs. 2%). High-risk patients exhibited biological features of immune suppression with low monocytic HLA-DR levels, higher immature neutrophils rates and higher IL10 concentrations. Using the TScore, we identified 160 high-risk patients (62%) in the validation cohort, with 30% of ICU-AI (vs. 18% in the low-risk group, p = 0.06), and significantly higher mortality and longer ICU length of stay.

Conclusions: The transcriptomic score provides a useful and reliable companion diagnostic tool to further develop immune modulating drugs in sepsis in the context of personalized medicine.

Keywords: Acquired infections; Intensive care unit; Personalized medicine; Sepsis; Transcriptomic.


Conflict of interest statement

MB, MC, AF, MAC, EC, EP, KBP and JFL are bioMérieux’s employees. JFL and GM are co-inventors in patent applications covering the previous markers. bioFire—a bioMérieux company—holds patents on the technology. This does not alter the authors’ adherence to all the policies on sharing data and materials.

Figures

Fig. 1
Fig. 1
Characteristics and methods for the discovery cohort. A Flow-chart diagram of the discovery cohort, B Scheme depicting the method used to identify candidate genes
Fig. 2
Fig. 2
Gene’s identification process in the discovery cohort. A ROC (Receiver Operating Characteristics) curves with AUC (area under the curve) upper than 0.70 of several genes (C3AR1: Complement C3a Receptor 1, CD177: CD177 molecule, CX3CR1: C-X3-C motif chemokine receptor 1, IFNγ: Interferon gamma, IL1R2: Interleukin 1 receptor 2, S100A9: S100 calcium binding protein A9, TDRD9: Tudor domain containing 9, ZAP70: Zeta chain of T cell receptor-associated protein kinase 70), B Normalized RNA values for identified genes in patient with (red dots) or without (green) ICU-acquired infections (ICU-AI)
Fig. 3
Fig. 3
Clinical outcomes of high- and low-risk patients in the discovery cohort using the TScore. A Heatmap of unsupervised hierarchical clustering in patients with or without ICU-acquired infections using individual gene score, B ROC (Receiver Operating Characteristics) curve with AUC (area under the curve) value of the ability of the TScore obtained at day 5–7 to distinguish between patients that will develop or not at least an ICU-acquired infection during their ICU stay, C Intensive care unit acquired infection (ICU-AI) proportion in patients with a TScore between 0 and 2 (low risk) or upper or equal to 3 (high risk), D Distribution of the type of ICU-AI in patients with a TScore between 0 and 2 (low risk) or upper or equal to 3 (high risk) (UTI: urinary tract infections), E Median and interquartile duration of intensive care unit length of stay in patients with a TScore between 0 and 2 (low risk) or upper or equal to 3 (high risk), F: intensive care unit mortality rate in patients with a TScore between 0 and 2 (low risk) or upper or equal to 3 (high risk)
Fig. 4
Fig. 4
Statistical and immunological validity of the TScore in the discovery cohort. A picture representing the respective participation of each parameter in the deviance of the model and their overlap, B level of expression of several immunological parameters (monocytic HLA-DR, IL-10 and immature neutrophils proportion) measured in blood of patients with a TScore between 0 and 2 (low risk) or upper or equal to 3 (high risk) and C clinical parameters and outcomes of patients with a TScore between 0 and 2 (low risk) or upper or equal to 3 (high risk) sub-classified according to their subgroup
Fig. 5
Fig. 5
Clinical outcomes of high- and low-risk patients in the validation cohort using the TScore. A Intensive care unit acquired infection (ICU-AI) proportion in patients with a TScore between 0 and 2 (low risk) or upper or equal to 3 (high risk), B Distribution of the type of ICU-AI in patients with a TScore between 0 and 2 (low risk) or upper or equal to 3 (high risk) (UTI: urinary tract infections), C Median and interquartile duration of intensive care unit length of stay in patients with a TScore between 0 and 2 (low risk) or upper or equal to 3 (high risk), D intensive care unit mortality rate in patients with a TScore between 0 and 2 (low risk) or upper or equal to 3 (high risk)

Similar articles

Cited by

References

    1. Singer M, Deutschman CS, Seymour CW, Shankar-Hari M, Annane D, Bauer M, et al. The third international consensus definitions for sepsis and septic shock (Sepsis-3) JAMA. 2016;315(8):801. doi: 10.1001/jama.2016.0287. - DOI - PMC - PubMed
    1. Hotchkiss RS, Monneret G, Payen D. Immunosuppression in sepsis: a novel understanding of the disorder and a new therapeutic approach. Lancet Infect Dis. 2013;13(3):260–268. doi: 10.1016/S1473-3099(13)70001-X. - DOI - PMC - PubMed
    1. van Vught LA, Klein Klouwenberg PMC, Spitoni C, Scicluna BP, Wiewel MA, Horn J, et al. Incidence, risk factors, and attributable mortality of secondary infections in the intensive care unit after admission for sepsis. JAMA. 2016;315(14):1469–1479. doi: 10.1001/jama.2016.2691. - DOI - PubMed
    1. Llitjos JF, Bounab Y, Rousseau C, Dixneuf S, Rimbault B, Chiche JD, et al. Assessing the functional heterogeneity of monocytes in human septic shock: a proof-of-concept microfluidic assay of TNFα secretion. Front Immunol. 2021;12:686111. doi: 10.3389/fimmu.2021.686111. - DOI - PMC - PubMed
    1. Avraham R, Haseley N, Brown D, Penaranda C, Jijon HB, Trombetta JJ, et al. Pathogen cell-to-cell variability drives heterogeneity in host immune responses. Cell. 2015;162(6):1309–1321. doi: 10.1016/j.cell.2015.08.027. - DOI - PMC - PubMed