

Lung-gut axis of microbiome alterations following co-exposure to ultrafine carbon black and ozone
- PMID: 37085867
- PMCID: PMC10122302
- DOI: 10.1186/s12989-023-00528-8
Lung-gut axis of microbiome alterations following co-exposure to ultrafine carbon black and ozone
Abstract
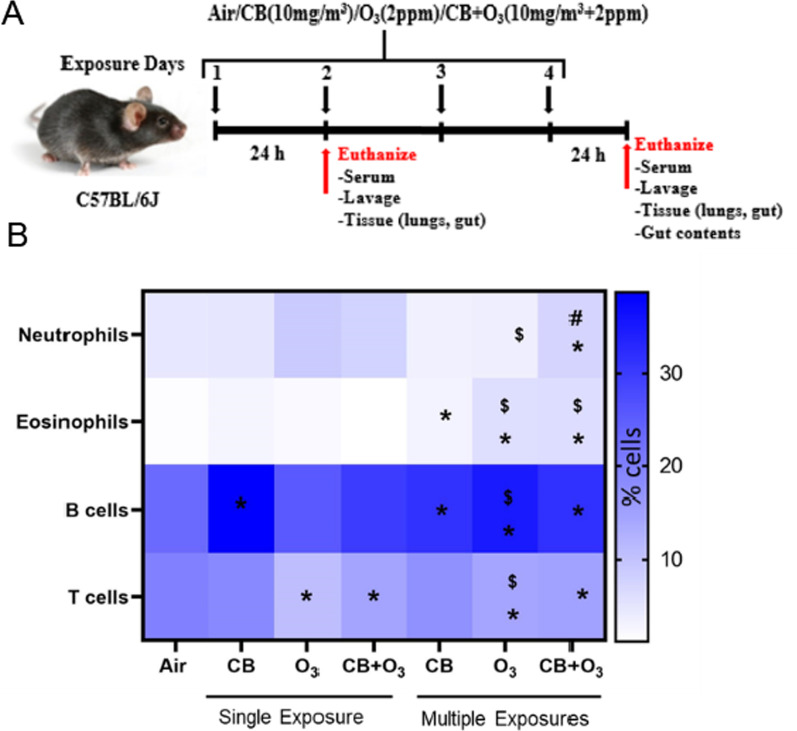
Background: Microbial dysbiosis is a potential mediator of air pollution-induced adverse outcomes. However, a systemic comparison of the lung and gut microbiome alterations and lung-gut axis following air pollution exposure is scant. In this study, we exposed male C57BL/6J mice to inhaled air, CB (10 mg/m3), O3 (2 ppm) or CB + O3 mixture for 3 h/day for either one day or four consecutive days and were euthanized 24 h post last exposure. The lung and gut microbiome were quantified by 16 s sequencing.
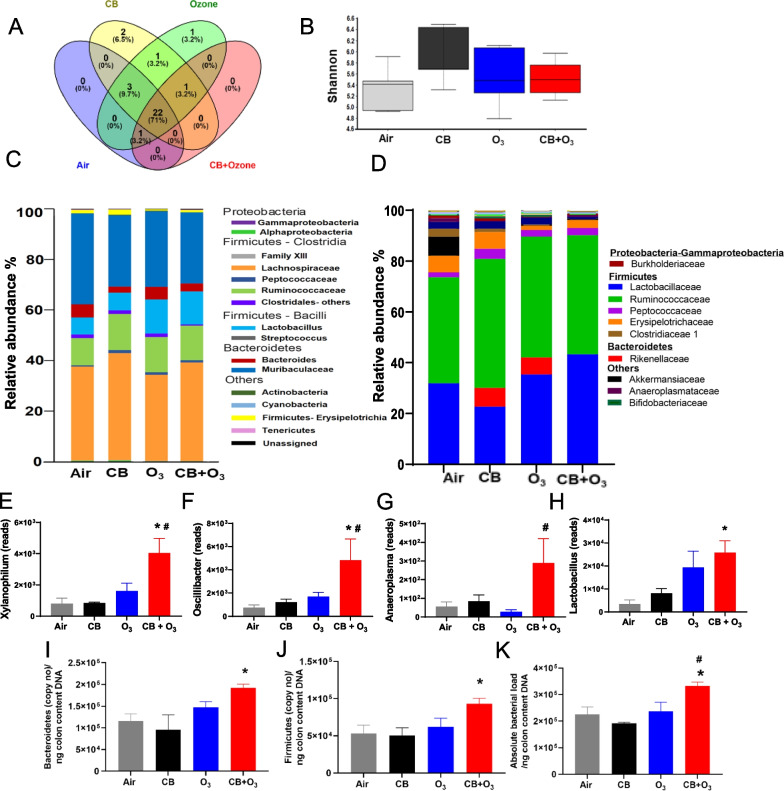
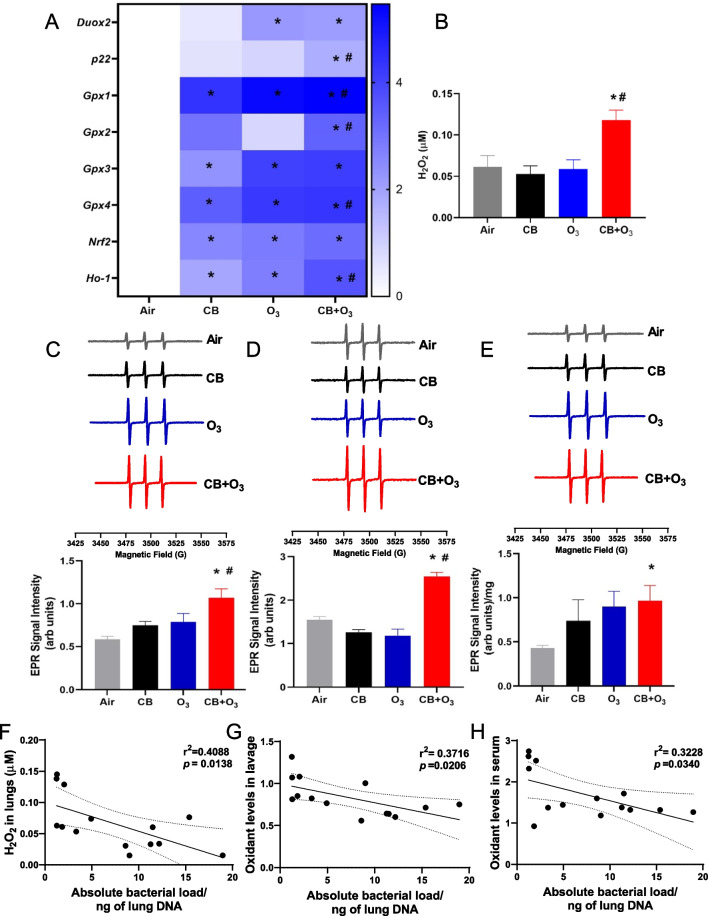
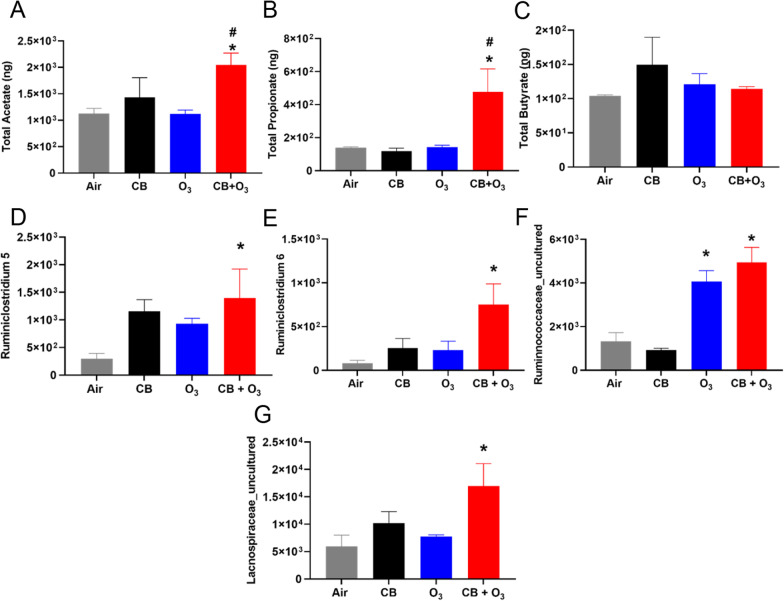
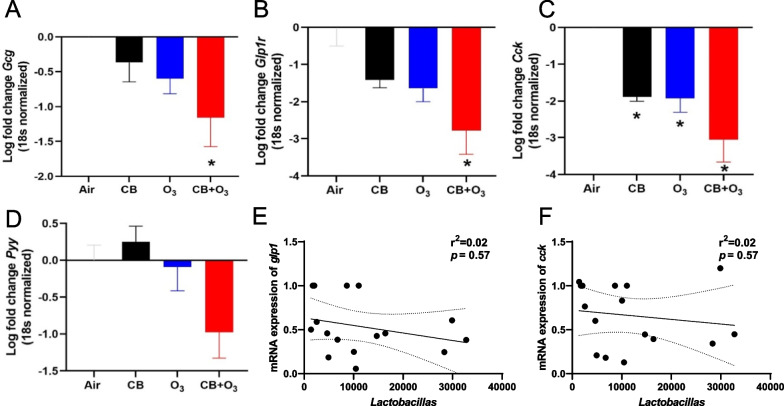
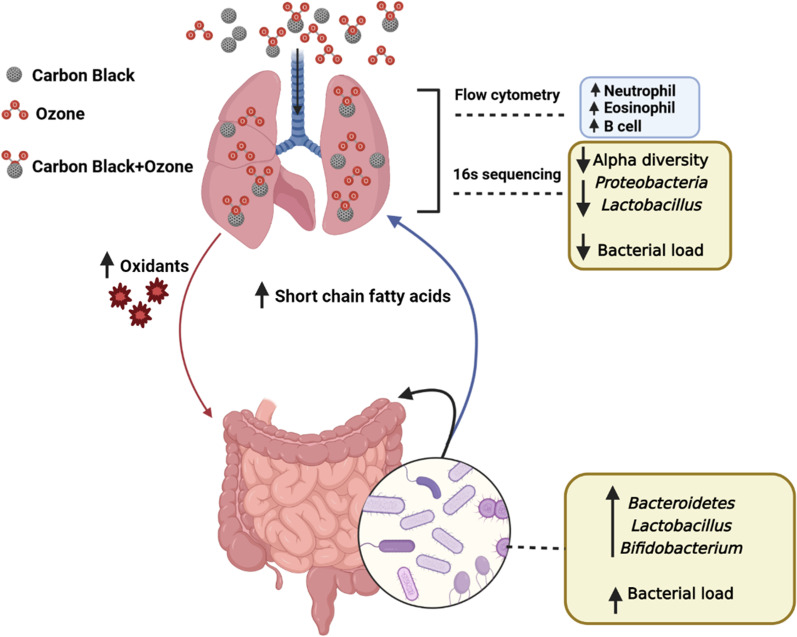
Results: Multiple CB + O3 exposures induced an increase in the lung inflammatory cells (neutrophils, eosinophils and B lymphocytes), reduced absolute bacterial load in the lungs and increased load in the gut. CB + O3 exposure was more potent as it decreased lung microbiome alpha diversity just after a single exposure. CB + O3 co-exposure uniquely increased Clostridiaceae and Prevotellaceae in the lungs. Serum short chain fatty acids (SCFA) (acetate and propionate) were increased significantly only after CB + O3 co-exposure. A significant increase in SCFA producing bacterial families (Ruminococcaceae, Lachnospiraceae, and Eubacterium) were also observed in the gut after multiple exposures. Co-exposure induced significant alterations in the gut derived metabolite receptors/mediator (Gcg, Glp-1r, Cck) mRNA expression. Oxidative stress related mRNA expression in lungs, and oxidant levels in the BALF, serum and gut significantly increased after CB + O3 exposures.
Conclusion: Our study confirms distinct gut and lung microbiome alterations after CB + O3 inhalation co-exposure and indicate a potential homeostatic shift in the gut microbiome to counter deleterious impacts of environmental exposures on metabolic system.
Keywords: Co-exposure; EPR; Inflammation; Inhalation; Microbial dysbiosis; Ozone; Ultrafine carbon black.
© 2023. The Author(s).
Conflict of interest statement
The authors declare no competing interests.
Figures

Similar articles
-
Transcriptomics of single dose and repeated carbon black and ozone inhalation co-exposure highlight progressive pulmonary mitochondrial dysfunction.Part Fibre Toxicol. 2021 Dec 15;18(1):44. doi: 10.1186/s12989-021-00437-8. Part Fibre Toxicol. 2021. PMID: 34911549 Free PMC article.
-
Aerosol physicochemical determinants of carbon black and ozone inhalation co-exposure induced pulmonary toxicity.Toxicol Sci. 2023 Jan 31;191(1):61-78. doi: 10.1093/toxsci/kfac113. Toxicol Sci. 2023. PMID: 36303316 Free PMC article.
-
Modification of gut and airway microbiota on ozone-induced airway inflammation.Sci Total Environ. 2024 Dec 1;954:176604. doi: 10.1016/j.scitotenv.2024.176604. Epub 2024 Sep 29. Sci Total Environ. 2024. PMID: 39353487
-
Air-Pollution-Mediated Microbial Dysbiosis in Health and Disease: Lung-Gut Axis and Beyond.J Xenobiot. 2024 Oct 21;14(4):1595-1612. doi: 10.3390/jox14040086. J Xenobiot. 2024. PMID: 39449427 Free PMC article. Review.
-
Inhalation exposure to chemicals, microbiota dysbiosis and adverse effects on humans.Sci Total Environ. 2024 Dec 10;955:176938. doi: 10.1016/j.scitotenv.2024.176938. Epub 2024 Oct 15. Sci Total Environ. 2024. PMID: 39414049 Review.
Cited by
-
The causal relationship between the gut microbiota and acute pancreatitis: A 2-sample Mendelian randomization study.Medicine (Baltimore). 2024 May 31;103(22):e38331. doi: 10.1097/MD.0000000000038331. Medicine (Baltimore). 2024. PMID: 39259083 Free PMC article.
-
Air Pollution and Disrupted Microbiomes: Tracing the Impact on Human Health.Cureus. 2025 Aug 2;17(8):e89267. doi: 10.7759/cureus.89267. eCollection 2025 Aug. Cureus. 2025. PMID: 40904971 Free PMC article. Review.
-
The Impact of Pulmonary Disorders on Neurological Health (Lung-Brain Axis).Immune Netw. 2024 May 29;24(3):e20. doi: 10.4110/in.2024.24.e20. eCollection 2024 Jun. Immune Netw. 2024. PMID: 38974208 Free PMC article. Review.
-
Air pollution, dysbiosis and diseases: pneumonia, asthma, COPD, lung cancer and irritable bowel syndrome.Future Microbiol. 2024;19(17):1497-1513. doi: 10.1080/17460913.2024.2401263. Epub 2024 Sep 30. Future Microbiol. 2024. PMID: 39345043 Review.
-
Distinct enterotypes and dysbiosis: unraveling gut microbiota in pulmonary and critical care medicine inpatients.Respir Res. 2024 Aug 10;25(1):304. doi: 10.1186/s12931-024-02943-7. Respir Res. 2024. PMID: 39127664 Free PMC article.
References
-
- Fann N, Risley D. The public health context for PM2.5 and ozone air quality trends. Air Qual Atmosphere Health. 2013;6(1):1–11. doi: 10.1007/s11869-010-0125-0. - DOI
-
- Hathaway QA, Majumder N, Goldsmith WT, Kunovac A, Pinti MV, Harkema JR, et al. Transcriptomics of single dose and repeated carbon black and ozone inhalation co-exposure highlight progressive pulmonary mitochondrial dysfunction. Part Fibre Toxicol. 2021;18(1):1–19. doi: 10.1186/s12989-021-00437-8. - DOI - PMC - PubMed
-
- Majumder N, Goldsmith WT, Kodali VK, Velayutham M, Friend SA, Khramtsov VV, et al. Oxidant-induced epithelial alarmin pathway mediates lung inflammation and functional decline following ultrafine carbon and ozone inhalation co-exposure. Redox Biol. 2021;46:102092. doi: 10.1016/j.redox.2021.102092. - DOI - PMC - PubMed
Publication types
MeSH terms
Substances
Grants and funding
LinkOut - more resources
Full Text Sources
Medical
