

Intravenous antibiotics in preterm infants have a negative effect upon microbiome development throughout preterm life
- PMID: 37085896
- PMCID: PMC10120188
- DOI: 10.1186/s13099-023-00544-1
Intravenous antibiotics in preterm infants have a negative effect upon microbiome development throughout preterm life
Abstract
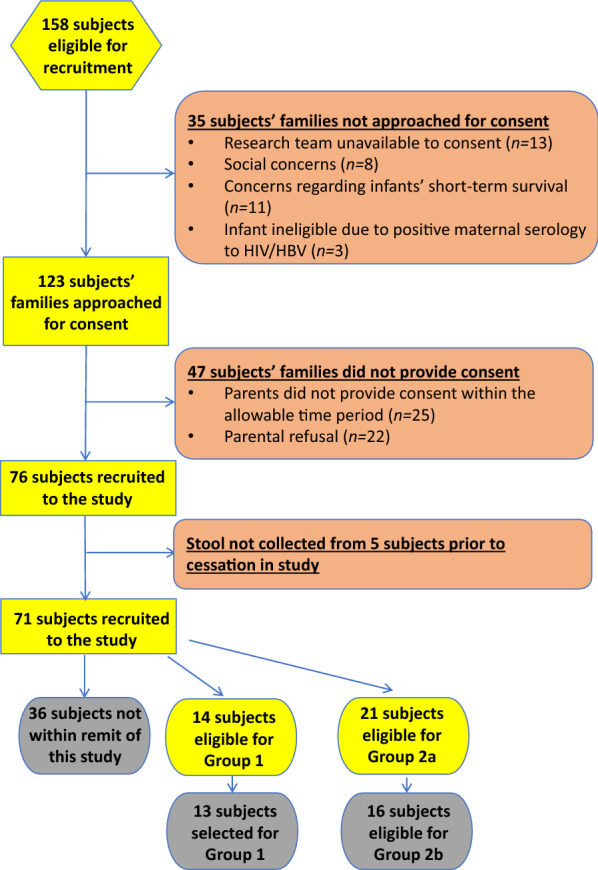
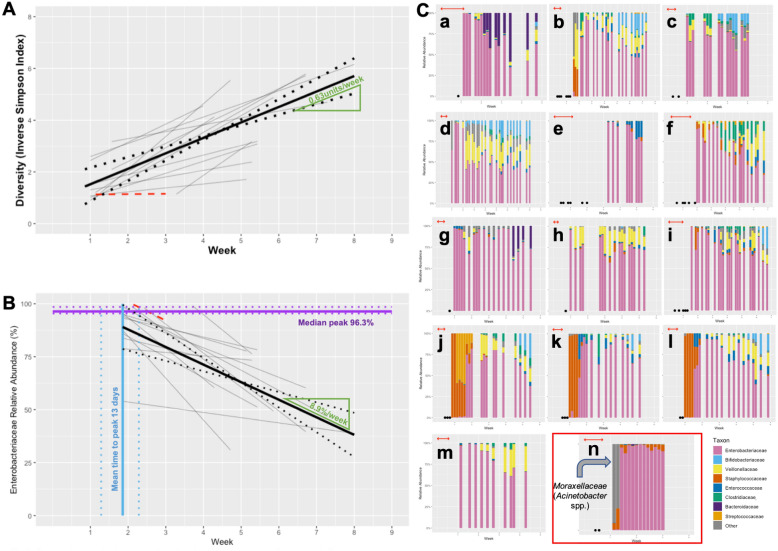
Background: Intestinal dysbiosis is implicated in the origins of necrotising enterocolitis and late-onset sepsis in preterm babies. However, the effect of modulators of bacterial growth (e.g. antibiotics) upon the developing microbiome is not well-characterised. In this prospectively-recruited, retrospectively-classified, case-control study, high-throughput 16S rRNA gene sequencing was combined with contemporaneous clinical data collection, to assess the within-subject relationship between antibiotic administration and microbiome development, in comparison to preterm infants with minimal antibiotic exposure.
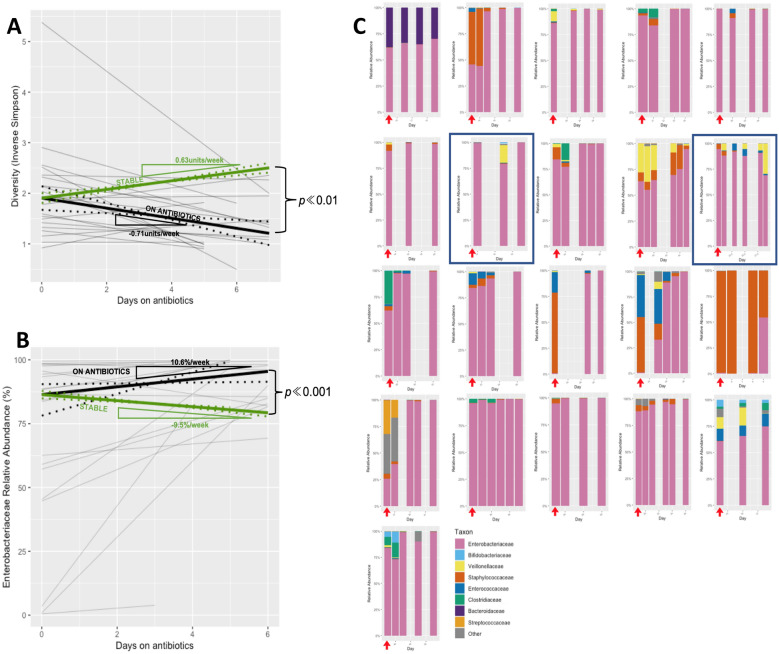
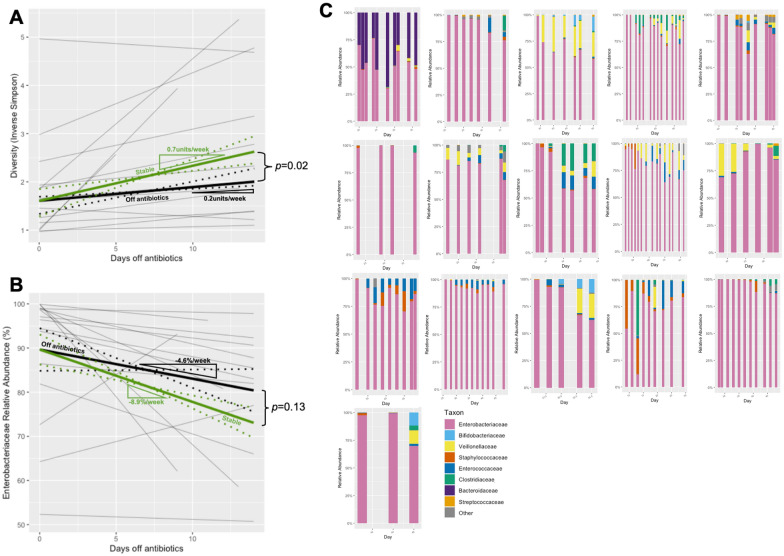
Results: During courses of antibiotics, diversity progression fell in comparison to that seen outside periods of antibiotic use (-0.71units/week vs. + 0.63units/week, p < 0.01); Enterobacteriaceae relative abundance progression conversely rose (+ 10.6%/week vs. -8.9%/week, p < 0.01). After antibiotic cessation, diversity progression remained suppressed (+ 0.2units/week, p = 0.02).
Conclusions: Antibiotic use has an acute and longer-lasting impact on the developing preterm intestinal microbiome. This has clinical implications with regard to the contribution of antibiotic use to evolving dysbiosis, and affects the interpretation of existing microbiome studies where this effect modulator is rarely accounted for.
© 2023. The Author(s).
Conflict of interest statement
The authors declare that they have no competing interests.
Figures
Similar articles
-
Changes in the intestinal microbiome of the preterm baby associated with stopping non-invasive pressure support: a prospective cohort study.BMJ Paediatr Open. 2024 Oct 3;8(1):e002675. doi: 10.1136/bmjpo-2024-002675. BMJ Paediatr Open. 2024. PMID: 39362793 Free PMC article.
-
The Microbiome and Metabolome of Preterm Infant Stool Are Personalized and Not Driven by Health Outcomes, Including Necrotizing Enterocolitis and Late-Onset Sepsis.mSphere. 2018 Jun 6;3(3):e00104-18. doi: 10.1128/mSphere.00104-18. Print 2018 Jun 27. mSphere. 2018. PMID: 29875143 Free PMC article.
-
Association between duration of intravenous antibiotic administration and early-life microbiota development in late-preterm infants.Eur J Clin Microbiol Infect Dis. 2018 Mar;37(3):475-483. doi: 10.1007/s10096-018-3193-y. Epub 2018 Jan 24. Eur J Clin Microbiol Infect Dis. 2018. PMID: 29368074 Free PMC article.
-
Pathogenesis of necrotising enterocolitis: The impact of the altered gut microbiota and antibiotic exposure in preterm infants.Acta Paediatr. 2021 Feb;110(2):433-440. doi: 10.1111/apa.15559. Epub 2020 Sep 28. Acta Paediatr. 2021. PMID: 32876963 Review.
-
Does antibiotic choice for the treatment of suspected late-onset sepsis in premature infants determine the risk of developing necrotising enterocolitis? A systematic review.Early Hum Dev. 2018 Aug;123:6-10. doi: 10.1016/j.earlhumdev.2018.06.009. Epub 2018 Jul 3. Early Hum Dev. 2018. PMID: 30025222
Cited by
-
The effect of antibiotics on the intestinal microbiota in children - a systematic review.Front Allergy. 2024 Oct 7;5:1458688. doi: 10.3389/falgy.2024.1458688. eCollection 2024. Front Allergy. 2024. PMID: 39435363 Free PMC article.
-
Risk of neurodevelopmental impairment in Swedish preterm children treated for necrotizing enterocolitis: retrospective cohort study.BJS Open. 2024 Oct 29;8(6):zrae131. doi: 10.1093/bjsopen/zrae131. BJS Open. 2024. PMID: 39513327 Free PMC article.
-
Changes in the intestinal microbiome of the preterm baby associated with stopping non-invasive pressure support: a prospective cohort study.BMJ Paediatr Open. 2024 Oct 3;8(1):e002675. doi: 10.1136/bmjpo-2024-002675. BMJ Paediatr Open. 2024. PMID: 39362793 Free PMC article.
-
Necrotizing Enterocolitis and the Preterm Infant Microbiome.Adv Exp Med Biol. 2024;1449:29-41. doi: 10.1007/978-3-031-58572-2_2. Adv Exp Med Biol. 2024. PMID: 39060729 Review.
-
Late-onset sepsis treatment in very preterm infants alters longitudinal microbiome trajectory with lower abundance of Bifidobacterium despite probiotic supplementation.Gut Microbes. 2025 Dec;17(1):2523808. doi: 10.1080/19490976.2025.2523808. Epub 2025 Jul 6. Gut Microbes. 2025. PMID: 40618372 Free PMC article.
References
Grants and funding
LinkOut - more resources
Full Text Sources
