Review
. 2023 Jun;10(17):e2300283.
doi: 10.1002/advs.202300283. Epub 2023 Apr 21.

Electrolyte-Wettability Issues and Challenges of Electrode Materials in Electrochemical Energy Storage, Energy Conversion, and Beyond

Affiliations
Review

Electrolyte-Wettability Issues and Challenges of Electrode Materials in Electrochemical Energy Storage, Energy Conversion, and Beyond

Lei Zhao et al. Adv Sci (Weinh). 2023 Jun.

Abstract

The electrolyte-wettability of electrode materials in liquid electrolytes plays a crucial role in electrochemical energy storage, conversion systems, and beyond relied on interface electrochemical process. However, most electrode materials do not have satisfactory electrolyte-wettability for possibly electrochemical reaction. In the last 30 years, there are a lot of literature have directed at exploiting methods to improve electrolyte-wettability of electrodes, understanding basic electrolyte-wettability mechanisms of electrode materials, exploring the effect of electrolyte-wettability on its electrochemical energy storage, conversion, and beyond performance. This review systematically and comprehensively evaluates the effect of electrolyte-wettability on electrochemical energy storage performance of the electrode materials used in supercapacitors, metal ion batteries, and metal-based batteries, electrochemical energy conversion performance of the electrode materials used in fuel cells and electrochemical water splitting systems, as well as capacitive deionization performance of the electrode materials used in capacitive deionization systems. Finally, the challenges in approaches for improving electrolyte-wettability of electrode materials, characterization techniques of electrolyte-wettability, as well as electrolyte-wettability of electrode materials applied in special environment and other electrochemical systems with electrodes and liquid electrolytes, which gives future possible directions for constructing interesting electrolyte-wettability to meet the demand of high electrochemical performance, are also discussed.

Keywords: electrode materials; electrode/electrolyte interface; electrolyte-wettability; energy conversion; energy storage.


Conflict of interest statement

The authors declare no conflict of interest.

Figures

Figure 1
Figure 1
Schematic illustration of a) super electrolyte‐wetting, b) electrolyte‐wetting, and c) electrolyte‐nonwetting. Wetting model of electrode surface: d) Wenzel model, e) Cassie model, and f) Wenzel–Cassie model. Reproduced with permission.[ 39 ] Copyright 2022, The Royal Society of Chemistry.
Figure 2
Figure 2
Schematic illustration of capillarity. When capillary tube is placed in the liquid electrolyte (middle), the electrolyte‐wettable capillary tube surface causes the liquid level to rise and the liquid level to be concave (left), while the electrolyte‐nonwettable capillary tube surface causes the liquid level to drop and makes it convex (right). Reproduced with permission.[ 40 ] Copyright 2011, Chemical Industry Press.
Figure 3
Figure 3
Schematics of charge‐storage mechanisms for a) an EDLC and b) different types of pseudocapacitor (underpotential deposition pseudocapacitor, redox pseudocapacitor, and ion intercalation pseudocapacitor from left to right). (a) Reproduced with permission.[ 19 ] Copyright 2018, American Chemical Society. (b) Reproduced with permission.[ 88 ] Copyright 2014, The Royal Society of Chemistry.
Figure 4
Figure 4
a) Supercapacitor performance of macroporous carbon film. N‐doped macroporous carbon film showing high specific capacitance owing to a large surface area and superior electrolyte‐wettability. Reproduced with permission.[ 63 ] Copyright 2010, Wiley‐VCH. b) SEM image of N/P‐NPCNFs‐20 (where the numbers (5, 10, 20, and 30) represent the mass ratio of C and N source to P source in the electrospinning solution), c) specific capacitance of each sample at different current densities (0.5–30 A g−1), and d) Nyquist plots of all samples in the frequency range of 100 kHz and 10 mHz (the inset is the magnified region). Reproduced with permission.[ 26 ] Copyright 2014, Elsevier. e) Galvanostatic charging/discharging test from the first cycle at 1 A g−1 and f) complex‐plane plots of AC impedance for OMC, OMFLC, OMFLC‐S1, and OMFLC‐SM) (the inset shows phase angle versus frequency). Reproduced with permission.[ 24 ] Copyright 2015, American Association for the Advancement of Science. g) A schematic illustration of B‐containing groups in the BKB carbon structure (black = carbon, green = boron, and red = oxygen). Reproduced with permission.[ 91 ] Copyright 2022, Elsevier. h) Water CA test of OMCs and OMCs‐PVP samples. Reproduced with permission.[ 25 ] Copyright 2016, Elsevier. i) Specific capacitance and its retention ratio at different current densities for NMCSs and j) water CA test of NMCSs and MCSs samples (undoped microporous carbon sheets). Reproduced with permission.[ 92 ] Copyright 2014, Wiley‐VCH. k) The mechanism of energy storage and possible atomic configuration for O, N, and S incorporation in MPCNS electrode materials, and l) volumetric capacitance of MPCNS, MPCB, and MPCNS‐800 electrode at the current densities from 0.1 to 200 A g−1. Reproduced with permission.[ 64 ] Copyright 2018, Elsevier. m) Ragone plots and n) Nyquist plots of the hNCNC‐SC and hCNC‐SC in 6 m KOH electrolyte (the inset magnifies the high‐frequency range). Reproduced with permission.[ 53 ] Copyright 2015, Wiley‐VCH. o) Dynamic water CA measurement results of dopant‐free carbon and doped carbon. Reproduced with permission.[ 65 ] Copyright 2021, The Royal Society of Chemistry. p) Schematic illustration of EEM‐g‐polymer. Reproduced with permission.[ 66 ] Copyright 2019, American Chemical Society.
Figure 5
Figure 5
a) Schematic diagrams of representative slit pore from the porous carbon materials. b) Change of the surface charge density with time under different conditions (λ = 0.3 nm represents a solvent‐philic surface and λ = 1.5 nm represents a solvent‐phobic surface). c) Capacitance against the surface wetting parameter under H/σ = 2 and H/σ = 5. Reproduced with permission.[ 100 ] Copyright 2022, American Chemical Society. d) Capillary effect diagram. e) CA of WCS, f) noncapillary effect diagram, CA of g) longitudinally cut block carbon materials activated at 900 °C, and h) conventional powder carbon materials. Reproduced with permission.[ 67 ] Copyright 2021, Elsevier.
Figure 6
Figure 6
a) The simulated electrostatic potential surface and optimized configuration of TEA+ adsorbed for pure carbon and fluorinated carbon. b) CA of electrolyte (TEABF4) on pure carbon and fluorinated carbon and c) relationship of the specific capacitance and current densities and Nyquist plots of different fluorinated carbons electrode materials (F contents of FNC‐1, FNC‐2, FNC‐3, and FNC‐4 are 7.8%, 8.1%, 12.9%, and 17.5%, respectively). Reproduced with permission.[ 110 ] Copyright 2016, Elsevier.
Figure 7
Figure 7
a) Schematic diagram of rGO, molecular formula of poly(ionic liquid), and cationic and anionic model of ionic liquid electrolyte. b) Plot of specific capacitance versus the current density and energy density versus power density at operating voltages of 3.0 and 3.5 V (the specific capacitance value is obtained from the galvanostatic charging–discharging (GCD) measurement. The energy and power density are normalized to the total mass of the two electrodes employed including the electrolyte and current collector (solid circle) and the mass of two poly(ionic liquid) modified rGO materials (dashed circle)). Reproduced with permission.[ 111 ] Copyright 2011, American Chemical Society. c) Schematic illustration and of the functionalized multiwalled carbon nanotube/hydrogen exfoliated graphene/1‐butyl‐3‐methylimidazolium bis(trifluoromethyl sulfonyl)imide (f‐MWNTs/HEG/[BMIM] [TFSI]) ternary nanocomposite electrode and Ragone plot of f‐MWNTs/HEG/[BMIM] [TFSI] nanocomposite‐based supercapacitors. d) Specific capacitance of the f‐MWNTs/HEG/[BMIM] [TFSI] nanocomposite as a function of specific current (inset: cyclic stability of the nanocomposite at specific current of 10 A g−1). Reproduced with permission.[ 112 ] Copyright 2012, American Chemical Society. e) Schematic diagram of the dominant role of electrolyte‐wettability in the utilization of electrode surface area (inferior electrolyte‐wettability leads to a small effective specific surface area (A1), resulting in a low energy density (E1). The enhancement of electrolyte‐wettability gives rise to an increase of the utilization of surface area (A2) and the energy density of supercapacitors (E2)), and f) the CA of the 1‐ethyl‐3‐methylimidazolium tetrafluoroborate ionic liquid droplet on the sample unmodified and modified by paraffin. Reproduced with permission.[ 59 ] Copyright 2019, KeAi Publishing Communications Ltd.
Figure 8
Figure 8
a) Water adsorption in hexagonal arrays and the most stable configuration of Ni(OH)2 on nickel foam (NO/NF) (001) (left) and sulfate functionalized Ni(OH)2 on nickel foam (SNO/NF) (001) (right) surfaces (gray, red, blue, pink, and yellow colors were used to represent Ni and O atoms in nickel hydroxides, O atoms in water, H atoms and S atoms, respectively). b) The calculated adsorption energies of water, c) water CA of NO/NF and SNO/NF, and d) areal capacity and coulombic efficiency of SNO/NF at serial current densities. Reproduced with permission.[ 50 ] Copyright 2019, Wiley‐VCH. e) Electrolyte CA of CoB, CoB@Mt, and CoB@Ver. Reproduced with permission.[ 71 ] Copyright 2022, Elsevier. f) Specific capacitances of PESAC (active carbon and PES acting as an electrochemically active material and a substrate material, respectively), PESAC‐X (X (X = Cl/Br/I)‐incorporated flexible electrode membrane) at different scan rates. Reproduced with permission.[ 70 ] Copyright 2021, Elsevier. g) Water CA of the FME‐Ni(OH)2), and flexible membrane electrode no polymer (FME‐NP). Reproduced with permission.[ 119 ] Copyright 2017, The Royal Society of Chemistry. h) Specific capacitance of the fabricated flexible membrane electrodes at different current densities (PAA‐b‐PAN‐b‐PAA modifying, F127 modifying, PDMC‐b‐PAN‐b‐PDMC modifying, and PVP‐b‐PAN‐b‐PVP modifying flexible membrane electrodes express as FME‐PAA, FME‐F127, FME‐PMDC, and FME‐PVP, respectively). Reproduced with permission.[ 120 ] Copyright 2017, The Royal Society of Chemistry.
Figure 9
Figure 9
SEM images of PANI thin film at a) ×5000 and b) ×10 000 magnifications (inset shows water CA of PANI thin film), and c) CV curves of PANI thin film electrode at various scan rates in 1 m H2SO4 electrolyte. Reproduced with permission.[ 45 ] Copyright 2013, Elsevier. d) The CA of water on DCP PPy and PCP PPy films and e) electrochemical impedance spectroscopy of PCP PPy and DCP PPy films in 3 m KCl aqueous solution (PCP PPy films: R s = 0.52 Ω, R ct < 0.1 Ω; DCP PPy films: R s = 1 Ω, R ct = 1 Ω). Reproduced with permission.[ 126 ] Copyright 2010, Elsevier.
Figure 10
Figure 10
a) The basic configuration and working mechanism of a battery (a typical battery device consists of an anode and cathode film sandwiched between two current collectors and isolated by an insulating separator). Reproduced with permission.[ 134 ] Copyright 2019, Springer Nature. b) Photographs of water droplets resting on the pristine graphene, the N‐doped graphene, and the B‐doped graphene films for 0 s and 4 min, showing that the pristine graphene sheets have better wettability toward water than doped graphene sheets. Rate capabilities and cycle performance of c) the pristine graphene, d) N‐doped graphene, and e) B‐doped graphene electrodes obtained over a wide range of high current densities, from 0.5 to 25 A g−1. f) Ragone plots for the pristine graphene, N‐doped graphene, B‐doped graphene, graphene oxide (GO), and GO500 (GO500 is prepared by thermal reduction of GO at 500 °C for 2 h) based cells with lithium metal as the counter/reference electrode (the calculation of gravimetric energy and power density is based on the active material mass of a single electrode). g) Nyquist plots of pristine, N‐doped, and B‐doped graphene (inset, high‐frequency region Nyquist plots). h) Modeled equivalent circuit and schematic of EIS, where R Ω stands for the electrolyte resistance, R CT the charge transfer resistance, ZW the “Warburg”‐type element related to Li+ diffusion, CPE the constant phase element, and the potential‐dependent capacitance. Reproduced with permission.[ 27 ] Copyright 2011, American Chemical Society. i) A typical photograph of water droplets resting on G, hG, N‐G, and N‐hG electrodes for 0, 5, and 10 min (the CA measurements are carried out by three times and the average values of CA are presented). j) Rate capability of G, hG, N‐G, and N‐hG measured in the voltage range of 0.02–2.5 V. Reproduced with permission.[ 28 ] Copyright 2015, Wiley‐VCH.
Figure 11
Figure 11
a) Schematic diagram of the synthesis process and ions transport of N‐doped porous carbon anode materials; and b) rate capacity performance of N‐doped porous carbon in K+ batteries and Na+ batteries at different current rates. Reproduced with permission.[ 142 ] Copyright 2019, Elsevier. High‐resolution XPS spectra of c) N1s and d) P2p of N, P codoped carbon sheets. e) Long‐term cycling performance of N, P codoped carbon sheets anode over 2000 cycles at a rate of 5 C after 70 cycles rate performance measurement (the inset is the rate performance of N, P codoped carbon sheets at a variety of current rates). Reproduced with permission.[ 29 ] Copyright 2018, Elsevier. Morphological characterizations of the MoP@NPCNFs nanocomposite membrane: f) SEM image and g) scanning transmission electron microscope (STEM) image and the corresponding N, Mo, and P elemental mapping images of MoP@NPCNFs and h) the CA testing results of NCNFs and MoP@NPCNFs. Reproduced with permission.[ 72 ] Copyright 2015, Wiley‐VCH.
Figure 12
Figure 12
a) Rate capability and b) electrochemical impedance spectroscopy measurements for unmodified LFP/C and LFP/C‐BTFSI electrodes. Reproduced with permission.[ 73 ] Copyright 2015, American Chemical Society. c) Schematic micromorphology and crystal structure of LZPO–LCO. d) Schematic illustration of how LZPO–LCO achieves superwettability. e) The contact angle of each sample with the electrolyte at room temperature. Reproduce with permission.[ 74 ] Copyright 2023, American Chemical Society.
Figure 13
Figure 13
a) The voltage–time curves during Li nucleation at 0.05 mA cm−2 on Cu foil, graphene (G), and N‐doped graphene (NG) electrodes. b) Schematic representation of the Li nucleation and plating process on NG electrode and Cu foil electrode and c) coulombic efficiency of Cu foil and NG electrode with a cycling capacity of 1.0 mAh cm−2, at current density of 1.0 mA cm−2. Reproduce with permission.[ 57 ] Copyright 2017, Wiley‐VCH. d) Ex situ SEM images of Na deposits on d) NSCNT paper, e) Cu foil, and f) Al foil at a current density of 0.1 mA cm−2 with a nucleation capacity of 0.1 mA h cm−2. g) The voltage–capacity profiles during Na nucleation on different current collectors at a current density of 0.05 mA cm−2. h) Coulombic efficiencies of Na plating/stripping on Cu foil, Al foil, CNT paper, and NSCNT paper at a current density of 1 mA cm−2 with a capacity limitation of 1 mA h cm−2 and i) the corresponding voltage profiles of Na plating/stripping on different current collectors at 10th, 50th, and 100th cycles. Reproduce with permission.[ 96 ] Copyright 2018, Wiley‐VCH. The summary of binding energy on carbon materials: j) the binding energy between Na and carbon and k) the binding energy between K and carbon. Reproduce with permission.[ 154 ] Copyright 2020, Elsevier.
Figure 14
Figure 14
a) Schematic illustration for the fabrication of F‐terminated Ti3C2 via a conventional F‐containing strategy and P.F. strategy for the fabrication of F‐free Ti3C2. b) CA measurements between electrolyte and F‐free Ti3C2/S and F‐terminated Ti3C2/S electrodes. Reproduced with permission.[ 77 ] Copyright 2022, American Chemical Society. c) Transmission electron microscope (TEM) image of polydopamine‐coated CNTs. d) Initial discharging–charging profiles of the dopa electrodes (the electrode employing polydopamine‐coated CNTs as the “dopa electrode” and the electrode employing uncoated CNTs as the “pristine electrode”) measured using LiI‐containing electrolyte at current densities of 400, 600, and 1000 mA g−1. Reproduced with permission.[ 76 ] Copyright 2014, The Royal Society of Chemistry. e) Initial discharging–charging profiles of pristine and dopa electrodes measured using pristine electrolyte. Reproduced with permission.[ 158 ] Copyright 2014, Springer. f) Comparison of CA and interface resistance of MWCNT with different treatments and g) full discharge/charge curves of Na–CO2 batteries with normal cathode at 1 A g−1 (the discharging and charging capacities equal to 60 000 mAh g−1 based on the mass of t‐MWCNTs). Reproduced with permission.[ 159 ] Copyright 2016, Wiley‐VCH. h) Discharging capacities at different current rates when the electrode has different saturation levels. Reproduced with permission.[ 160 ] Copyright 2018, American Chemical Society.
Figure 15
Figure 15
a) Homogenization of Li nucleation from the nucleation stage and normalization of Li growth can be achieved on PNIPAM polymer brushes with lithophilic functional groups modified Cu current collector and the obtained planar columnar Li anode exhibits excellent cycle stability at an ultrahigh current density of 20 mA cm−2 (insets: detailed voltage profiles of 40 h to 50 h, and 420 h to 430 h; the deposition capacity of Li is 5.0 mAh cm−2) and b) coulombic efficiency of different anodes at current densities of 1, 2, and 5 mA cm−2 (top) and cycling performances of PNIPAM‐2@Cu@Li||LFP and Cu@Li||LFP full batteries at the current density of 1 C (bottom). Reproduced with permission.[ 165 ] Copyright 2019, Wiley‐VCH. c) Comparison of tilted‐view SEM images of Li deposition on bare Cu and oxide PAN‐coated Cu (the growth of Li is confined within the polymer fiber layer and scale bars is 5 µm). Reproduced with permission.[ 30 ] Copyright 2015, American Chemical Society. d) The schematic diagram of the mechanism for the electrolyte‐wettable PDA layer guided Li metal deposition. e) Coulombic efficiency of Li deposition and stripping on the plane Cu, 3D Cu, and PDA@3D Cu at a current density of 2.0 mA cm−2 with a total capacity of 1.0 mAh cm−2 and f) voltage–time profiles of metallic Li symmetric batteries with plane Cu and PDA@3D Cu electrodes. Reproduced with permission.[ 166 ] Copyright 2020, Elsevier.
Figure 16
Figure 16
a) Schematic illustrations of Li deposition on the Cu current collector within the α‐Si3N4 membrane and b) voltage–time curves of Li deposition/stripping in the symmetrical Li||Li batteries (top) and the Li‐α‐Si3N4||α‐Si3N4‐Li batteries (bottom) (inset: magnified view of the voltage–time curve of the Li||Li batteries, the amount of plated Li is 1.0 mAh cm−2, and the current density is 1.0 mA cm−2 in each cycle). Reproduced with permission.[ 173 ] Copyright 2018, American Chemical Society. c) Coulombic efficiency test of CTM/Li wafer, Ti‐mesh/Li wafer, and Cu foil/Li wafer at 10 mA cm−2 with 1 mAh cm−2 and d) Nyquist plots of Li wafer (left) and LCTM anode (right) for symmetrical batteries measured at 1 mA cm−2 with 1 mAh cm−2 after different cycles. Reproduced with permission.[ 31 ] Copyright 2019, Wiley‐VCH. e) High‐resolution TEM (HRTEM) image of LIA anode after stripping Li completely from the skeleton; and f) galvanostatic cycling performance of LIA||LFP and bare Li||LFP full batteries at a rate of 1 C (top), and LIA||LTO and bare Li||LTO full batteries at a rate of 4 C (bottom). Reproduced with permission.[ 77 ] Copyright 2018, Wiley‐VCH.
Figure 17
Figure 17
a) Schematic illustration of morphology evolution for the bare Zn–Zn batteries, the PVB@Zn‐PVB@Zn, PDA@Zn‐PDA@Zn, and PVDF@Zn‐PVDF@Zn batteries during repeated cycles of stripping/plating, and b) in situ CA measurements of bare Zn and PDA@Zn foil, respectively. Reproduced with permission.[ 32 ] Copyright 2022, Wiley‐VCH. c) Long‐term cycling stability of MnO2/Zn and MnO2/PVB@Zn batteries at 5 C with the corresponding CEs. Reproduced with permission.[ 78 ] Copyright 2020, Wiley‐VCH. d) Schematic illustrations showing Zn deposition behavior on the bare Zn and APTES coated Zn surface. Reproduced with permission.[ 82 ] Copyright 2022, American Chemical Society. e) Schematic illustration of the self‐phase transition of silk fibroin molecule layer. Reproduced with permission.[ 80 ] Copyright 2022, Elsevier.
Figure 18
Figure 18
a) Schematic illustration of preparing Zn electrodes with Sn particles and Zn deposition on Zn/Sn‐20 nm electrodes. b) The CA on bare Zn, Zn/Sn‐1 µm, Zn/Sn‐500 nm, and Zn/Sn‐20 nm. Reproduced with permission.[ 177 ] Copyright 2022, Elsevier. c) DFT calculations of the adsorption energy of Zn atoms on the bare Zn and the ZnSe coating layer, respectively. d) CA of 2 m ZnSO4 droplets on these two substrates. Reproduced with permission.[ 178 ] Copyright 2022, Wiley‐VCH. e) SEM images of bare Zn and Zn@ZCO anodes after 50 cycles. Reproduced with permission.[ 55 ] Copyright 2022, Wiley‐VCH.
Figure 19
Figure 19
a) Schematic illustration of the 3D porous structure and dual‐channel skeletons endowing the DCP‐Zn with suppressed dendrite growth and promoted kinetics. Reproduced with permission.[ 86 ] Copyright 2020, Elsevier. b) Schematic illustrating the top‐down fabrication of the LLP@ZF by nanosecond laser lithography. c) High‐resolution XPS O 1s spectra of LLP@ZF, ZnO coated ZF (ZnO@ZF), and bare ZF. d‐f) Optical images of the 2 m ZnSO4 electrolyte‐electrode CA, comparing LLP@ZF versus ZnO@ZF and bare ZF. Reproduced with permission.[ 181 ] Copyright 2022, Elsevier.
Figure 20
Figure 20
a) Schematic illustration of the commercial air electrode with an additional MPL located between CFP and Pt/C catalyst (Pt/C‐MPL‐CFP) and a three‐phase contact point (TPCP) for oxygen (gas), electrolyte (liquid), and catalyst (solid) under electrolyte. Reproduced with permission.[ 182 ] Copyright 2016, Wiley‐VCH. b) The linear sweep voltammetry curves of ORR reaction on three platinum‐coated samples (the inset shows the SEM images of the three conductive columnar structures and the water CAs of the three samples). For the underwater system, the typical three wetting state of a hydrophobic surface can be labeled as the nature of gas–liquid–solid interface, as schematically shown in c) underwater Wenzel state, d) underwater Wenzel–Cassie coexistent state, and e) underwater Cassie state (the schematic diagram of three‐phase interface is denoted by the red color). Reproduced with permission.[ 183 ] Copyright 2017, Wiley‐VCH.
Figure 21
Figure 21
a) Illustration of the relationship between the pathways for liquid water (blue) and for reactant gases (green) in gas diffusion layer with patterned hydrophilicity. b) EDX elemental mapping of a modified region of 500 µm showing two elements: F (representative of coating), and Cl (representative of the grafted modification and ion exchange), and c) polarization curves at 50 °C, 100/30% RH anode/cathode of the following three materials. Toray commercial, Toray 30% FEP (Toray TPG‐H‐060 coated in‐house with 30%, FEP), Toray 30% FEP‐patterned‐ (Toray TPG‐H‐060 coated in‐house with 30% FEP and pattern‐grafted with NVF). Reproduced with permission.[ 38 ] Copyright 2015, Wiley‐VCH. d) Polarization and power curves for the single cell with different membrane‐electrode assemblies under wet conditions (60 °C, 100% RH). Reproduced with permission.[ 185 ] Copyright 2018, Elsevier. e) Depiction of gas and water transport through the MPL with a focus on the catalyst layer‐MPL interface at dry conditions (≤80% RH) e) H‐philic NCS and f) H‐phobic NCS. Reproduced with permission.[ 191 ] Copyright 2020, American Chemical Society. g) Schematic illustrations of preparation of MLG‐coated Ni foam with patterned wettability. Reproduced with permission.[ 192 ] Copyright 2019, American Chemical Society.
Figure 22
Figure 22
a) Schematic illustration of improving electrolyte‐wettability of Ni–Fe diselenide catalyst by coating hydrophilic PVP. b) Plots of the current density (at 1.15 V) versus the scan rate of NFSHPs and P‐NFSHPs, and c) schematic mechanism diagram of the functional PVP on Ni–Fe diselenide hollow nanoparticles toward OER. Reproduced with permission.[ 202 ] Copyright 2018, Elsevier. d) The iR‐corrected the linear sweep voltammetry (LSV) curves of the Ni/Gr/PAA, Ni/Gr, and Ni/PAA electrodes for OER and HER measured in O2/N2 saturated 1.0 m phosphate buffer saline (PBS) solution (pH 7.0), respectively. Reproduced with permission.[ 188 ] Copyright 2018, Wiley‐VCH. e) HRTEM images of Ni(OH) x /Ni3S2/NF, f) CA of Ni3S2 and Ni(OH) x /Ni3S2, and g) LSV curves of NF, Ni(OH)2/NF, Ni3S2/NF, Ni(OH) x /Ni3S2/NF, and Pt/C/NF. Reproduced with permission.[ 203 ] Copyright 2022, Wiley‐VCH.
Figure 23
Figure 23
SEM image of a) pine‐shaped Pt nanostructured film and b) Pt flat film (the insets display the wettability of pine‐shaped Pt nanostructured film and Pt flat film to 0.5 m H2SO4 electrolyte. Reproduced with permission.[ 207 ] Copyright 2015, Wiley‐VCH. c) Schematic illustration of different wrinkle structure and gas detachment from the surface during the HER. Reproduced with permission.[ 208 ] Copyright 2019, American Chemical Society. d) SEM image of LaCoO3/nickel foam (NF), e) OER polarization curves, and f) Tafel slopes of LaCoO3/NF, bulk LaCoO3, Ir/C, and NF. Reproduced with permission.[ 209 ] Copyright 2020, American Chemical Society. g) The CA of water on Ni3Se2 microspheres/Ni foil (top) and Ni3Se2 nanoforest/Ni foil (bottom). h) IR corrected HER polarization curves of Ni3Se2 microspheres/Ni foil, Ni3Se2 nanoforest/Ni foil, and 20 wt% Pt/C on Ni foam (Pt/C), and i) OER polarization curves of NF‐Ni3Se2/Ni and MS‐Ni3Se2/Ni at a scan rate of 10 mV s−1 before IR correction. Reproduced with permission.[ 33 ] Copyright 2016, Elsevier.
Figure 24
Figure 24
a) A fluorine‐anion surface engineering has been first put forward to activate catalytic active species of Co‐based materials, representing a completely new reconstruction way toward OER active species. b) Static water contact‐angle measurements of F‐CoOOH and CoOOH products. c) IR‐corrected OER polarization curves, d) Tafel slope, and e) electrochemical impedance spectra of FCoOOH/NF, F‐Co3O4/NF, CoOOH/NF, Co3O4/NF, RuO2/NF, and NF electrodes in 1 m KOH solution. Reproduced with permission.[ 34 ] Copyright 2018, Wiley‐VCH. f) SEM image of the F‐CoP‐Vp NSs grown on carbon cloth. g) Static water CA measurements, and h) calculated water adsorption energy of CoP and F‐CoP‐Vp. Reproduced with permission.[ 54 ] Copyright 2020, American Chemical Society.
Figure 25
Figure 25
a) Schematic illustration of CDI device and preparation of N, P codoped 3DHCA. b) Plots of SAC versus time (the solid line) and solution conductivity versus time (the dot line) of different samples: NP‐3DHCA (the green line), P‐3DHCA (the red line), N‐3DHCA (the blue line), 3DHCA (the black line), and AC (the yellow line). c) Ragone plots of SAR versus SAC of different samples (all the above curves are measured at 1.2 V, 500 ppm, and 40 mL min−1). Reproduced with permission.[ 36 ] Copyright 2018, The Royal Society of Chemistry. d) The changes in captive bubble CA of the O plasma treated carbon electrode (top) and the pristine activated carbon electrode (bottom). Reproduced with permission.[ 217 ] Copyright 2013, Elsevier. e) The geometric and effective diameter of the SWCNT pores corresponding to different chiral indices and f) the number of electrosorbed/repulsed ions (left axis), SAC (right axis in black), and SAR (right axis in purple) for each of the SWCNT CDI systems (where the D and W initials are referring to the wettable and nonwettable states of the pores, respectively). Reproduced with permission.[ 218 ] Copyright 2022, The Royal Society of Chemistry.
Figure 26
Figure 26
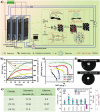
Future perspectives for electrolyte‐wettability of electrode materials.

Similar articles

Cited by

References

    1. Mittal K. L., Contact Angle, Wettability and Adhesion, VSP/Brill, Leiden, Netherlands: 2009.
    1. Zhang X., Shi F., Niu J., Jiang Y., Wang Z., J. Mater. Chem. 2008, 18, 621.
    1. Sun T., Feng L., Gao X., Jiang L., Acc. Chem. Res. 2005, 38, 644. - PubMed
    1. Liu K., Yao X., Jiang L., Chem. Soc. Rev. 2010, 39, 3240. - PubMed
    1. Thomas P., Surf. Coat. Int. 1998, 81, 604.

Publication types

LinkOut - more resources