

Identification and validation of autophagy-related genes in Kawasaki disease
- PMID: 37085930
- PMCID: PMC10120123
- DOI: 10.1186/s41065-023-00278-9
Identification and validation of autophagy-related genes in Kawasaki disease
Abstract
Background: Kawasaki disease (KD) is a systemic vasculitis of unknown etiology affecting mainly children. Studies have shown that the pathogenesis of KD may be related to autophagy. Using bioinformatics analysis, we assessed the significance of autophagy-related genes (ARGs) in KD.
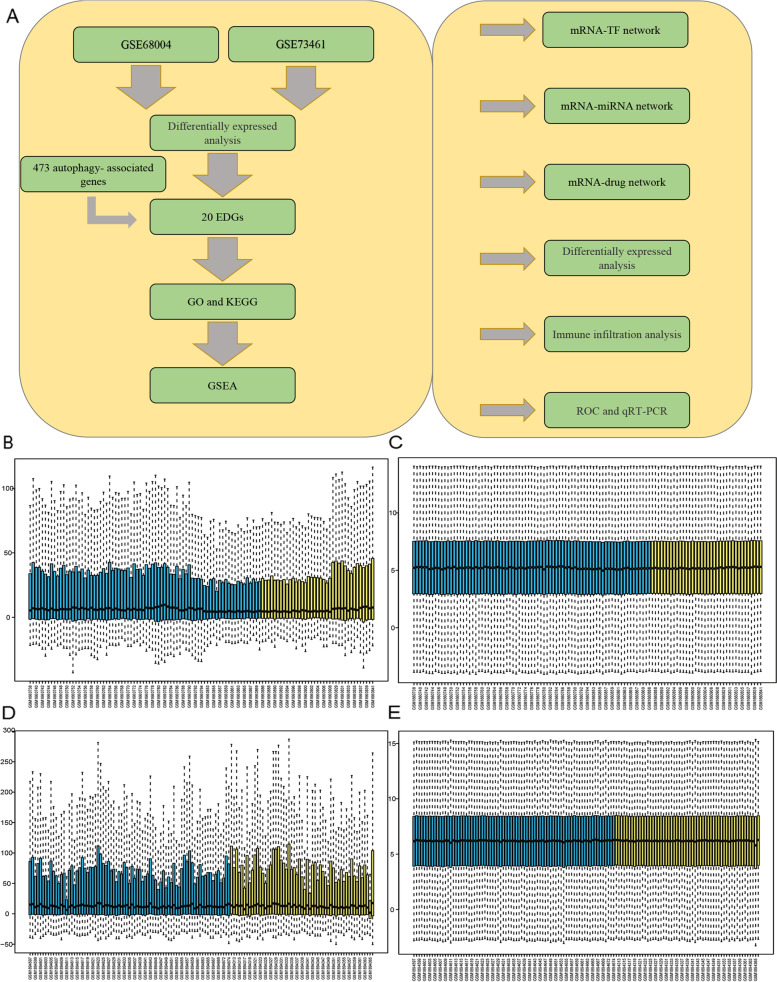
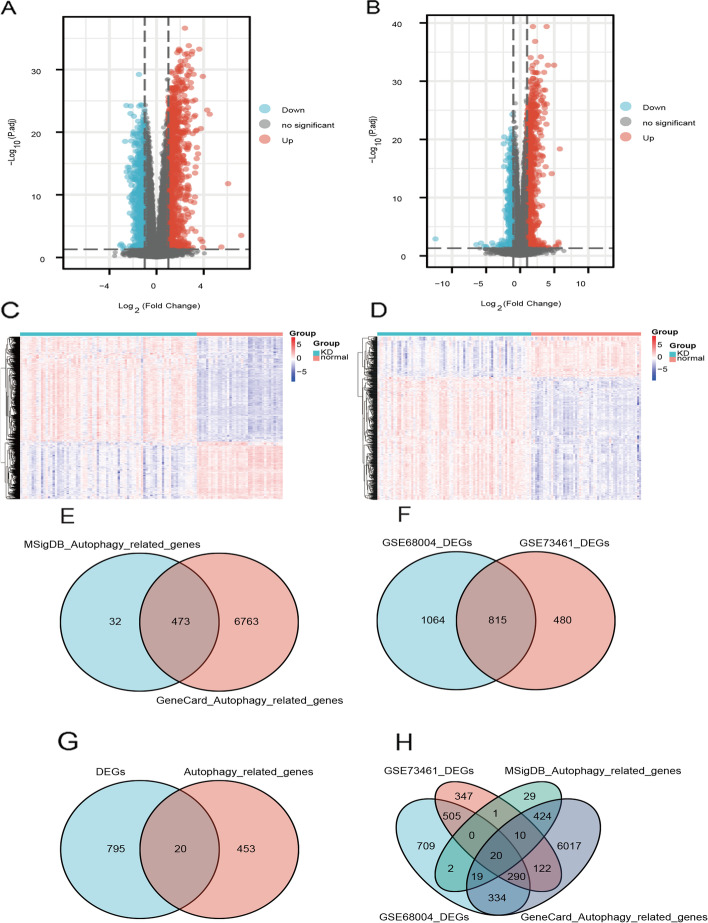
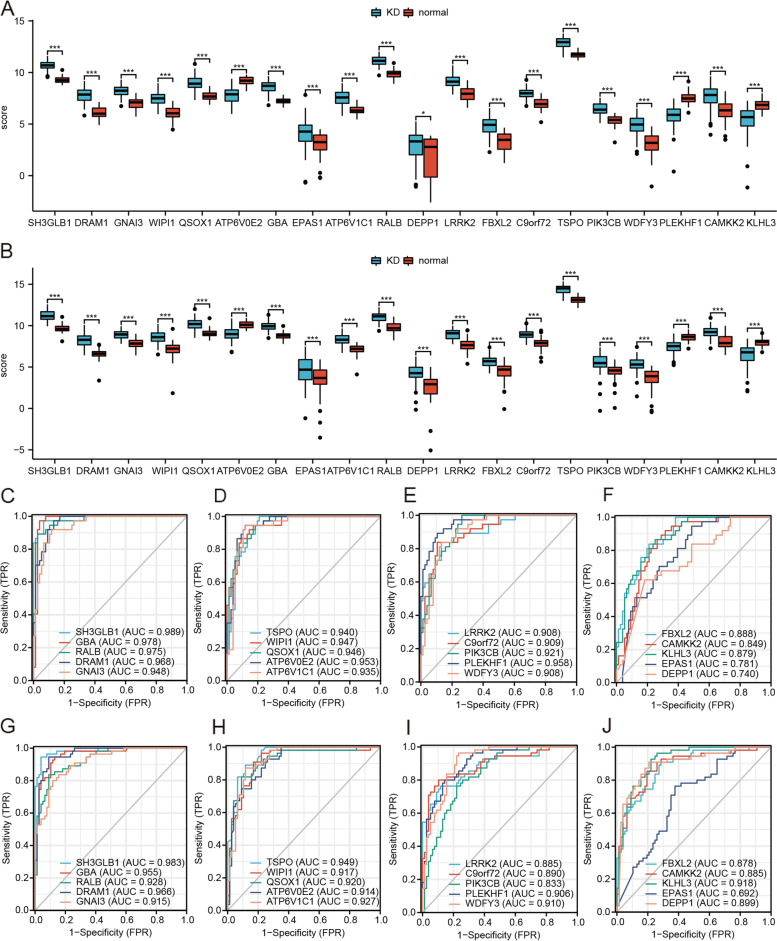
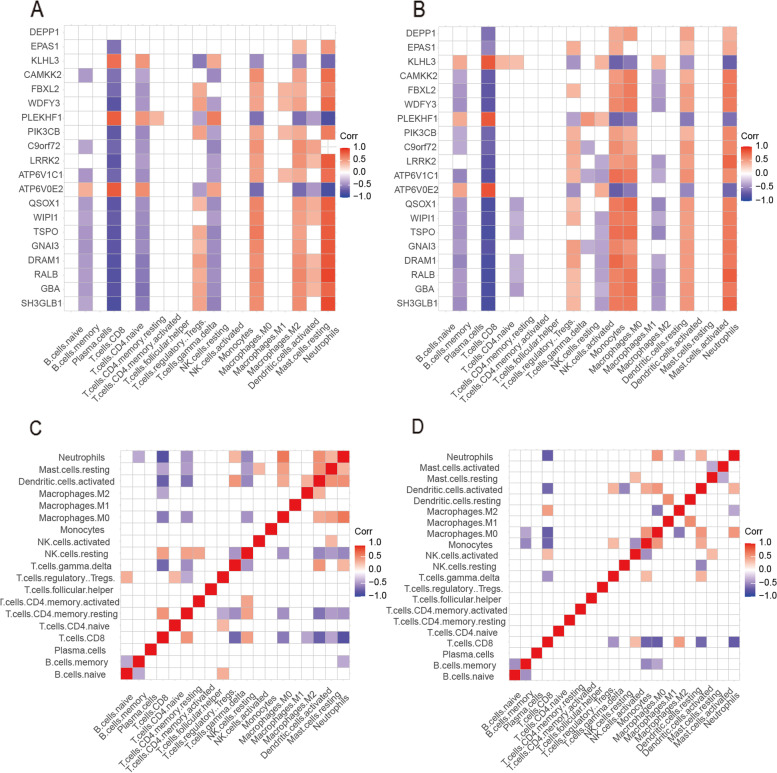
Methods: Common ARGs were identified from the GeneCards Database, the Molecular Signatures Database (MSigDB), and the Gene Expression Omnibus (GEO) database. ARGs were analyzed by Gene Ontology (GO) and Kyoto Encyclopedia of Genes and Genomes (KEGG) enrichment analysis and protein-protein interaction (PPI) network analysis. Furthermore, related microRNAs (miRNAs), transcription factors (TFs), and drug interaction network were predicted. The immune cell infiltration of ARGs in tissues was explored. Finally, we used receiver operating characteristic (ROC) curves and quantitative real-time PCR (qRT-PCR) to validate the diagnostic value and expression levels of ARGs in KD.
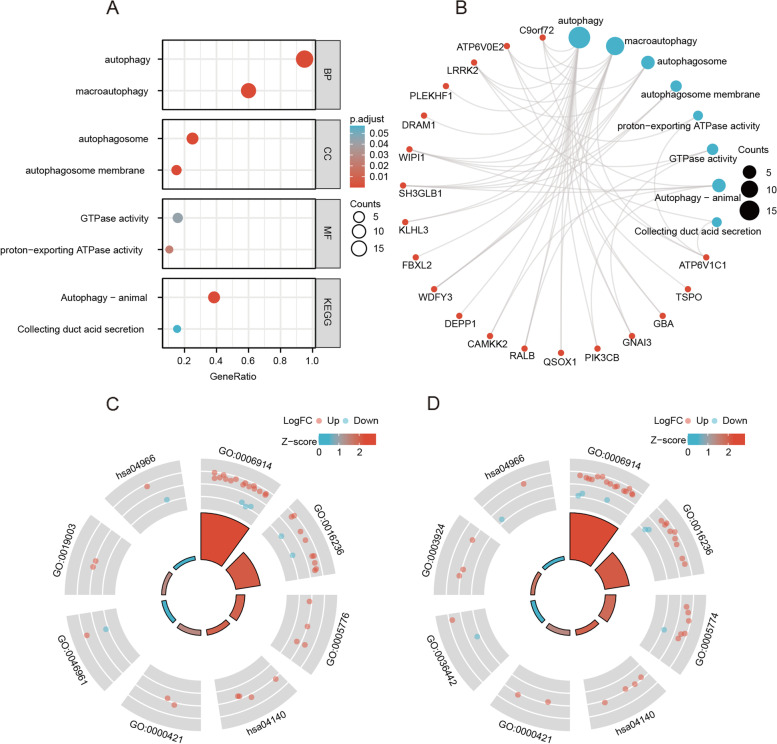
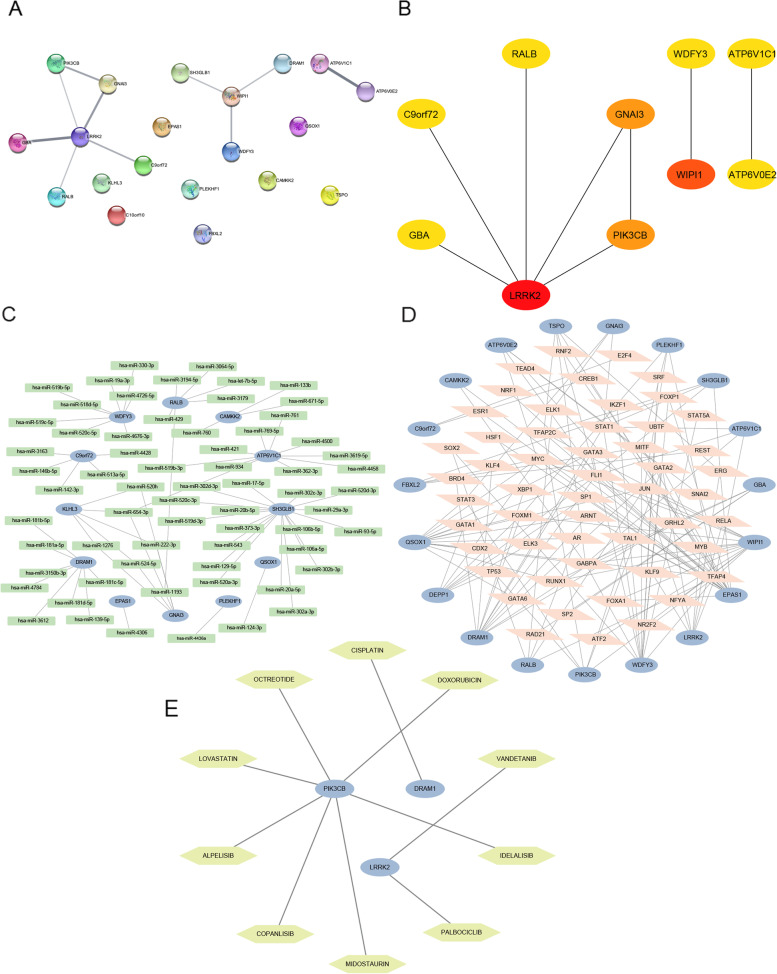
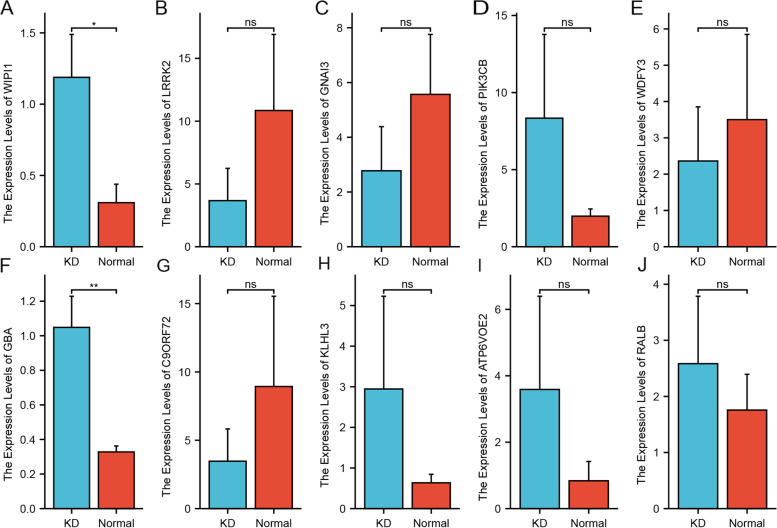
Results: There were 20 ARGs in total. GO analysis showed that ARGs were mainly rich in autophagy, macro-autophagy, and GTPase activity. KEGG analysis showed that ARGs were mainly rich in autophagy-animal and the collecting duct acid secretion pathway. The expression of WIPI1, WDFY3, ATP6V0E2, RALB, ATP6V1C1, GBA, C9orf72, LRRK2, GNAI3, and PIK3CB is the focus of PPI network. A total of 72 related miRNAs and 130 related TFs were predicted by miRNA and TF targeting network analyses. Ten pairs of gene-drug interaction networks were also predicted; immune infiltration analysis showed that SH3GLB1, ATP6V0E2, PLEKHF1, RALB, KLHL3, and TSPO were closely related to CD8 + T cells and neutrophils. The ROC curve showed that ARGs had good diagnostic value in KD. qRT-PCR showed that WIPI1 and GBA were significantly upregulated.
Conclusion: Twenty potential ARGs were identified by bioinformatics analysis, and WIPI1 and GBA may be used as potential drug targets and biomarkers.
Keywords: Autophagy; Bioinformatics; GEO database; Kawasaki disease; qRT-PCR.
© 2023. The Author(s).
Conflict of interest statement
The authors declare they have no competing interests.
Figures
Similar articles
-
MAPK8 and HDAC6: potential biomarkers related to autophagy in diabetic retinopathy based on bioinformatics analysis.Front Endocrinol (Lausanne). 2025 May 21;16:1487007. doi: 10.3389/fendo.2025.1487007. eCollection 2025. Front Endocrinol (Lausanne). 2025. PMID: 40469433 Free PMC article.
-
Identification of novel mitophagy-related biomarkers for Kawasaki disease by integrated bioinformatics and machine-learning algorithms.Transl Pediatr. 2024 Aug 31;13(8):1439-1456. doi: 10.21037/tp-24-230. Epub 2024 Aug 26. Transl Pediatr. 2024. PMID: 39263286 Free PMC article.
-
MAPK8 and CAPN1 as potential biomarkers of intervertebral disc degeneration overlapping immune infiltration, autophagy, and ceRNA.Front Immunol. 2023 May 30;14:1188774. doi: 10.3389/fimmu.2023.1188774. eCollection 2023. Front Immunol. 2023. PMID: 37325630 Free PMC article.
-
Identification of Hub Biomarkers and Immune and Inflammation Pathways Contributing to Kawasaki Disease Progression with RT-qPCR Verification.J Immunol Res. 2023 Apr 6;2023:1774260. doi: 10.1155/2023/1774260. eCollection 2023. J Immunol Res. 2023. PMID: 39670237 Free PMC article.
-
Identification of Serum Exosome-Derived circRNA-miRNA-TF-mRNA Regulatory Network in Postmenopausal Osteoporosis Using Bioinformatics Analysis and Validation in Peripheral Blood-Derived Mononuclear Cells.Front Endocrinol (Lausanne). 2022 Jun 9;13:899503. doi: 10.3389/fendo.2022.899503. eCollection 2022. Front Endocrinol (Lausanne). 2022. PMID: 35757392 Free PMC article.
Cited by
-
Integrated multiomics analysis identifies potential biomarkers and therapeutic targets for autophagy associated AKI to CKD transition.Sci Rep. 2025 Apr 21;15(1):13687. doi: 10.1038/s41598-025-97269-9. Sci Rep. 2025. PMID: 40258914 Free PMC article.
-
The application of weighted gene co-expression network analysis and support vector machine learning in the screening of Parkinson's disease biomarkers and construction of diagnostic models.Front Mol Neurosci. 2023 Oct 16;16:1274268. doi: 10.3389/fnmol.2023.1274268. eCollection 2023. Front Mol Neurosci. 2023. PMID: 37908486 Free PMC article.
References
-
- Esmaeili S, Mehrgou A, Kakavandi N, Rahmati Y. Exploring Kawasaki disease-specific hub genes revealing a striking similarity of expression profile to bacterial infections using weighted gene co-expression network analysis (WGCNA) and co-expression modules identification tool (CEMiTool): An integrated bioinformatics and experimental study. Immunobiology. 2020;225(4):15. doi: 10.1016/j.imbio.2020.151980. - DOI - PubMed
MeSH terms
Substances
LinkOut - more resources
Full Text Sources
Medical
Research Materials
Miscellaneous
