. 2023 Jul;12(19):e2202422.
doi: 10.1002/adhm.202202422. Epub 2023 May 10.

An Automation Workflow for High-Throughput Manufacturing and Analysis of Scaffold-Supported 3D Tissue Arrays

Affiliations

An Automation Workflow for High-Throughput Manufacturing and Analysis of Scaffold-Supported 3D Tissue Arrays

Ruonan Cao et al. Adv Healthc Mater. 2023 Jul.

Abstract

Patient-derived organoids have emerged as a useful tool to model tumour heterogeneity. Scaling these complex culture models while enabling stratified analysis of different cellular sub-populations, however, remains a challenge. One strategy to enable higher throughput organoid cultures is the scaffold-supported platform for organoid-based tissues (SPOT). SPOT allows the generation of flat, thin, and dimensionally-defined microtissues in both 96- and 384-well plate footprints that are compatible with longitudinal image-based readouts. SPOT is currently manufactured manually, however, limiting scalability. In this study, an automation approach to engineer tumour-mimetic 3D microtissues in SPOT using a liquid handler is optimized and comparable within- and between-sample variation to standard manual manufacturing is shown. Further, a liquid handler-supported cell extraction protocol to support single-cell-based end-point analysis using high-throughput flow cytometry and multiplexed cytometry by time of flight is developed. As a proof-of-value demonstration, 3D complex tissues containing different proportions of tumour and stromal cells are generated to probe the reciprocal impact of co-culture. It is also demonstrated that primary patient-derived organoids can be incorporated into the pipeline to capture patient-level tumour heterogeneity. It is envisioned that this automated 96/384-SPOT workflow will provide opportunities for future applications in high-throughput screening for novel personalized therapeutic targets.

Keywords: 3D in vitro cancer models; automation; tumour microenvironments.


Conflict of interest statement

The authors declare no conflict of interest.

Figures

Figure 1
Figure 1
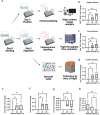
An integrated high‐throughput automation workflow to generate, perturb, and analyze 3D in vitro SPOT cultures. a) Schematic representation of the 96‐SPOT components. 96/384‐SPOT uses an embedded PMMA‐patterned scaffold sheet to support the growth of 3D cell‐gel microtissues. The PMMA‐patterned paper scaffold (shown in blue) is attached to a bottomless well plate (top, shown in black) using two layers of double‐sided tape (shown in yellow) and a semi‐rigid polycarbonate film (bottom). The semi‐rigid polycarbonate film is optically transparent and thin to enable microscopy. b) Schematic representation of the proposed automated workflow performed by the OT2 liquid handler. 1) The OT2 is used to automate the generation of engineered 3D microtissues. Immortalized cell lines or organoid‐based cells can be incorporated into SPOT using the optimized cell‐gel dispensing OT2 sequence. 2) The OT2 automates high‐throughput screening by assisting in drug and reagent addition and culture maintenance. The engineered tissue arrays can be analyzed by time‐course high‐content microscopy and plate‐reader‐based assays, such as AlamarBlue. 3) The OT2 is also used to automate gel digestion. The cell‐gel within the tissue is mechanically and enzymatically degraded using an optimized digestion sequence. Single cells can then be extracted for end‐point downstream analysis, such as high‐throughput flow cytometry (bottom). 4) 96‐barcode master plate can be generated using OT2 to multiplexed digested single cells for high‐content proteomics analysis using CyTOF.
Figure 2
Figure 2
Comparison of scaffold candidates to identify material compatible with automation. a) Representative SEM images of the I) original SPOT scaffold and II–IV) 3 paper scaffold candidates. The scale bar is 500 µm. b) Wicking time was measured by observing the amount of time required for dyed PBS to wick radially within one well in 96‐SPOT for each scaffold candidate. Scaffold III offered the most superior wicking ability (shown in green). Statistical significance was assessed using ANOVA. Mean ± SD of 3 independent experiments. c) Pore area coverage as a percentage for all 4 paper scaffolds was measured based on brightfield images taken under 4x magnification. Scaffold IV exhibited the most condensed cellulose fibres. Mean ± SD of 3 independent samples size of around 12 mm2. d) Representative images showing GFP‐expressing KP4 cells on day 0 and day 3 seeded at 5 × 106 cells mL−1 hydrogel using 3 mg mL−1 type I bovine collagen into each scaffold candidate. The scale bar is 500 µm.
Figure 3
Figure 3
Optimization of OT2 parameters to achieve robust seeding in 96/384‐SPOT. a) GFP‐expressing cells were seeded at 30 × 106 cells mL−1 hydrogel using 3 mg mL−1 type I bovine collagen to evaluate the coverage of cell‐gel mixture inside the wells seeded using various parameters. i) The offset of tip z‐axis, ii) tip hold time on the paper scaffold after dispensing, iii) 96‐SPOT gel volume, and iv) 384‐SPOT gel volume were selected as −0.5 mm, 1 s, 5 μL, and 2 μL, respectively, for further OT2 sequence optimization. Statistical analysis was performed using ANOVA. b) Schematic representation of two OT2 cell‐gel deposition sequences i) sequence 1: droplet formation, in which the cell‐gel droplet (pink) is formed before contact with the scaffold, and ii) sequence 2: direct dispense, in which contact is made before the cell‐gel (pink) is dispensed. c) Assessment of i) intrawell variation using coefficient of variation and ii) intrawell variation using MGV for 96‐SPOT. d) Assessment of i) intrawell variation using coefficient of variation and ii) intrawell variation using MGV for 384‐SPOT. The #2 direct dispense sequence offers consistently better seeding results, especially for 384‐SPOT. Statistical analysis was performed using the t‐test. Mean ± SD of 3 independent experiments.
Figure 4
Figure 4
Benchmarking optimized OT2 automated seeding to manual seeding. a) GFP‐expressing cells were seeded at 30 × 106 cells mL−1 hydrogel using 3 mg mL−1 type I bovine collagen into 96/384‐SPOT either by the optimized OT2 sequence or manually by an experienced user. 96‐SPOT seeded by the OT2 offered a significantly lower intrawell variation. A similar interwell variation was observed in 96‐SPOT using both automation and manual seeding. 384‐SPOT seeded by the OT2 had similar intrawell and interwell variations. Statistical analysis was performed using a Student t‐test. b) Representative images of live/dead staining using calcein‐AM and propidium iodide on day 0 and day 3 for OT2 and manual seeded cells. c) The proportion of dead cells was estimated by obtaining the ratio of dead cells' MGV over live cells' MGV. The OT2 seeded wells showed more cell death only on day 0. d) When focusing on the live cell population only, cells seeded by manual and OT2 demonstrated a similar growth pattern characterized by the mean gray value of live cells. Statistical analysis was performed using a Student t‐test. Mean ± SD of 3 independent experiments.
Figure 5
Figure 5
Assessment of fabrication variation associated with 96/384‐SPOT generated using optimized OT2 sequence. a) Representative widefield image showing 96‐SPOT and b) 384‐SPOT seeded using the optimized OT2 sequence with GFP‐expressing KP4 cells (green) at 30 × 106 cells mL−1. The scale bar is 5 mm. c) Assessment of coefficient of variation measured from widefield images of 96‐SPOT on day 0. Mean ±SD of 3 independent experiments are organized by i) columns and ii) rows for 96‐SPOT (N = 3). ANOVA revealed no statistical significance between columns or rows across 3 independent experiments. d) Similarly consistent and reproducible results were obtained for 384‐SPOT in i) columns and ii) rows. e,f) The interwell variation for both 96/384‐SPOT was quantified based on the MGV. No statistically significant differences were observed between i) columns and ii) rows. Statistical analysis was performed using ANOVA. Mean ± SD of 3 independent experiments.
Figure 6
Figure 6
The use of the OT2 to automate cell extraction and facilitate high‐throughput end‐point single‐cell analyses of the 96‐SPOT. a) The workflow of proof‐of‐value single‐cell‐based analyses compatible with OT2 and SPOT. A total cell density of 15 × 106 cells mL−1 in 6 mg mL−1 bovine collagen was seeded into the 96‐SPOT with various tumour and stromal population ratios, KP4 monoculture, 30% PSCs, 50% PSCs, and PSCs monoculture, using the OT2. After 3 days of co‐culture, wells or cells were processed accordingly for downstream high‐content image analysis, high‐throughput flow cytometry or multiplexed CyTOF after barcoding. b) Using Ki67 expression as a surrogate for proliferative cells, the number of GFP+ Ki67+ (proliferative KP4 cells) and GFP+ cells (KP4 cells) in each stromal condition were quantified. After normalization to KP4 monoculture, an increasing trend of proliferative cells was observed, particularly in the 50% PSCs group. c) Cells could be digested out for high‐throughput flow cytometry analysis. After 3 days of co‐culture, an EdU assay was performed, and cells were digested out of the paper scaffold by the OT2. A similar increasing percentage of proliferative KP4 cells was also observed based on high‐throughput flow cytometry when co‐cultured with a higher percentage of PSCs. d) Similarly, multiplexed CyTOF analysis also captured the same effect of stimulated proliferation by the presence of PSCs. e–g) Assessment of EMT markers on KP4 cells using CyTOF revealed upregulation in mesenchymal markers (Vimentin and Laminin) was correlated with the increasing percentage of PSCs. Correspondingly, the epithelial marker (Pan‐CK) in KP4 cells was downregulated significantly when co‐cultured with PSCs. h) At the same time, PSCs were further activated when co‐cultured with more KP4 cells, as shown in the upregulation in FAP. Statistical analysis was performed using ANOVA. Mean ± SD of 3 independent experiments.
Figure 7
Figure 7
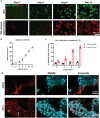
Translation of automated OT2 pipeline to incorporate fragile patient‐derived organoid cells. a) GFP‐expressing PPTO.46 cells were seeded at 3 × 106 cells mL−1 in a hydrogel blend (3 mg mL−1 bovine collagen (75%) and Matrigel (25%). Representative images of GFP expressing PPTO.46 seeded using OT2 on days 0, 4, 8, and 12. Dead cells (red) were stained with propidium iodide, while GFP expression was used as the surrogate for live cells (green). Cells were treated with ice‐cold 70% ethanol for 10 min to induce complete cell death at each time point as a negative control. b) Growth curve for GFP‐expressing PPTO.46 cells after being seeded using the OT2 in SPOT for up to 12 days based on MGV. c) The dead cells were quantified based on the MGV of propidium iodide staining. There was no apparent increase in dead cells over the 12‐day culture compared to the dead control, confirming SPOT platforms coupling with OT2 seeding support patient‐derived organoid cell culture. d) The health/polarization of organoids on day 12 was assessed based on CK19 and ZO‐1 immunostaining. Confocal images were taken with a 20x objective. As expected, CK19 expression was seen at the edge of organoids. Lumens were observed (white arrows) based on ZO‐1 staining indicating a healthy status of PDAC organoids. Plots show the mean ±SD of 3 independent experiments.

Similar articles

Cited by

References

    1. Costard L. S., Hosn R. R., Ramanayake H., O'Brien F. J., Curtin C. M., Acta Biomater. 2021, 132, 360. - PubMed
    1. Henke E., Nandigama R., Ergün S., Front. Mol. Biosci. 2020, 6, 160. - PMC - PubMed
    1. Brancato V., Oliveira J. M., Correlo V. M., Reis R. L., Kundu S. C., Biomaterials 2020, 232, 119744. - PubMed
    1. Broutier L., Mastrogiovanni G., Verstegen M. M., Francies H. E., Gavarró L. M., Bradshaw C. R., Allen G. E., Arnes‐Benito R., Sidorova O., Gaspersz M. P., Georgakopoulos N., Koo B.‐K., Dietmann S., Davies S. E., Praseedom R. K., Lieshout R., IJzermans J. N. M., Wigmore S. J., Saeb‐Parsy K., Garnett M. J., van der Laan L. J., Huch M., Nat. Med. 2017, 23, 1424. - PMC - PubMed
    1. Vlachogiannis G., Hedayat S., Vatsiou A., Jamin Y., Fernández‐Mateos J., Khan K., Lampis A., Eason K., Huntingford I., Burke R., Rata M., Koh D.‐M., Tunariu N., Collins D., Hulkki‐Wilson S., Ragulan C., Spiteri I., Moorcraft S. Y., Chau I., Rao S., Watkins D., Fotiadis N., Bali M., Darvish‐Damavandi M., Lote H., Eltahir Z., Smyth E. C., Begum R., Clarke P. A., Hahne J. C., et al., Science 2018, 359, 920. - PMC - PubMed

Publication types