. 2023 Jun;45(3):1913-1931.
doi: 10.1007/s11357-023-00776-8. Epub 2023 Apr 22.

Advancing age increases the size and severity of spontaneous atheromas in mouse models of atherosclerosis

Affiliations

Advancing age increases the size and severity of spontaneous atheromas in mouse models of atherosclerosis

Venkateswara R Gogulamudi et al. Geroscience. 2023 Jun.

Abstract

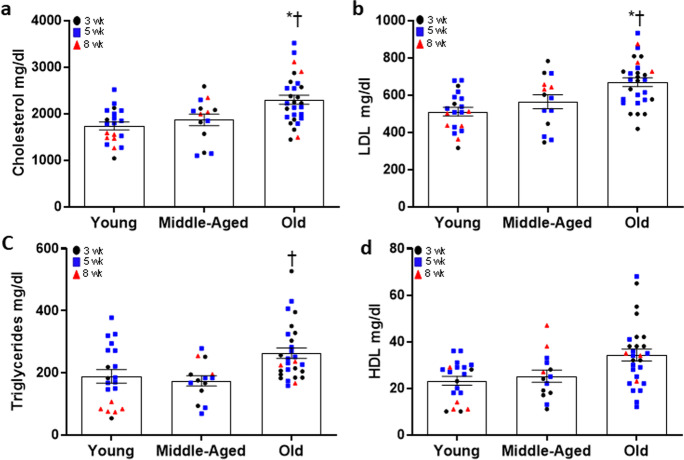
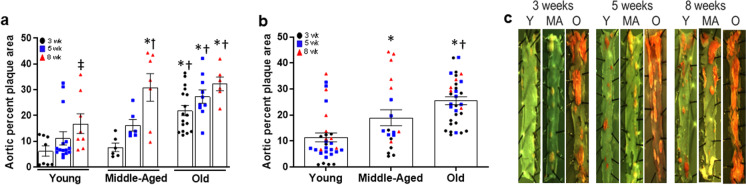
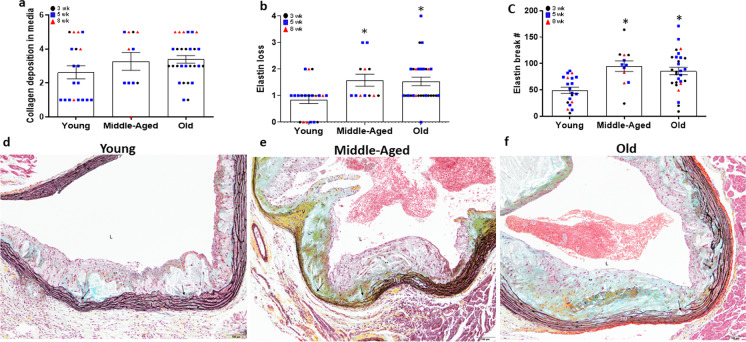
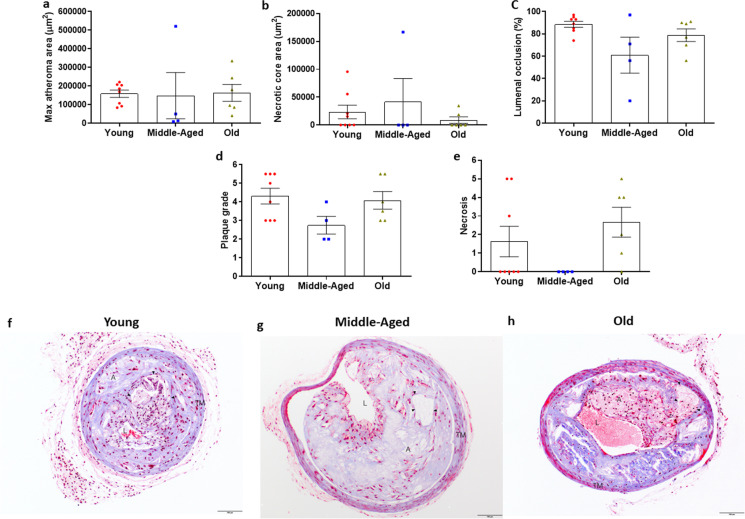
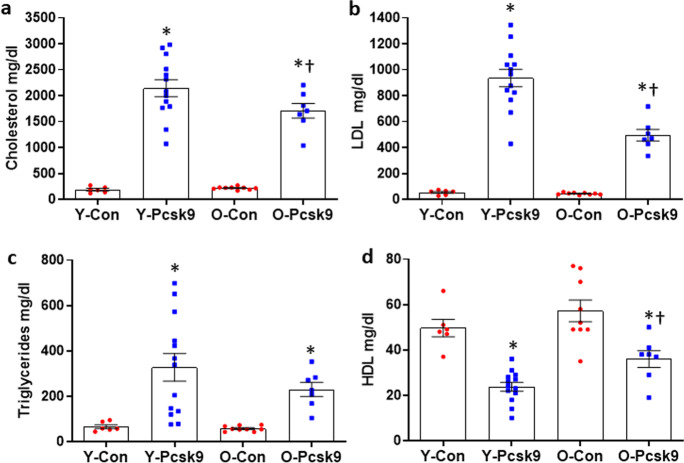
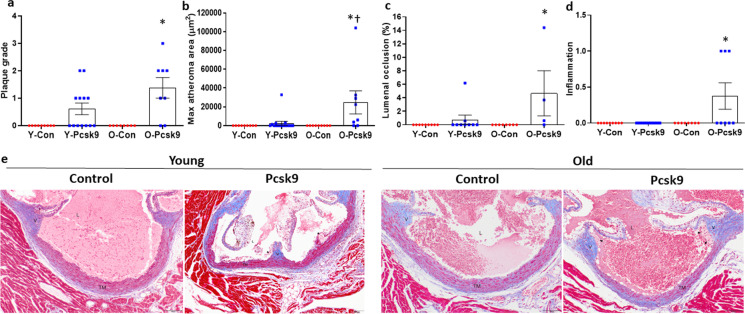
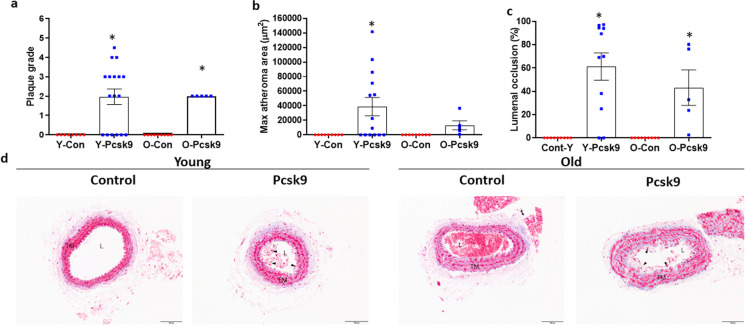
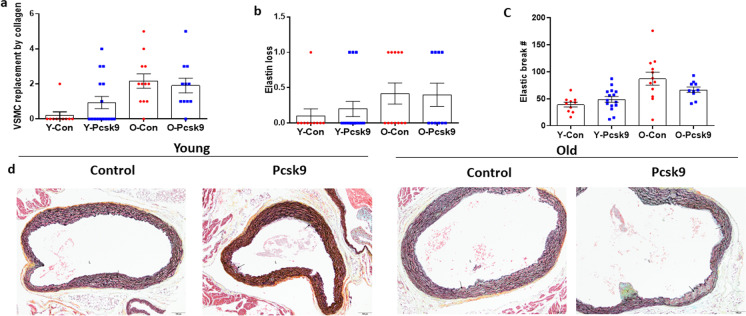
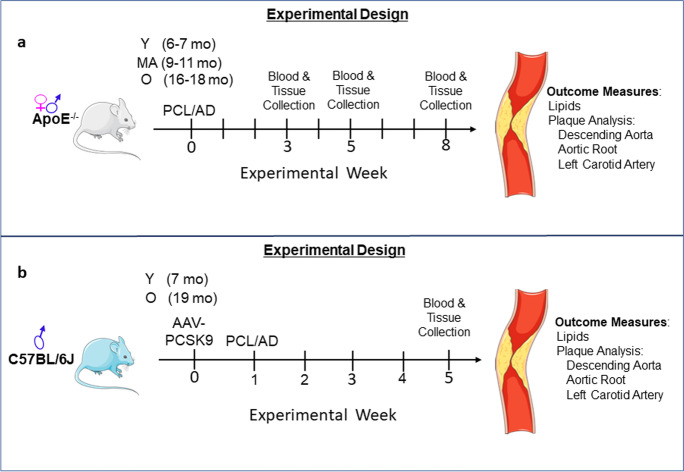
Using multiple mouse models, we explored the impact of aging on the size and severity of atherosclerotic lesions. In young, middle-aged and old apolipoprotein E knockout mice (ApoE-/-) fed an atherogenic diet (AD) for 3-8 weeks, plaque/atheroma formation in the descending aorta and aortic root, and atheroma development in the carotid in response to partial carotid ligation (PCL) were assessed. Total and LDL cholesterol, and triglycerides were higher in old compared to both other age groups, regardless of AD duration. Aortic plaque burden increased with AD duration in all ages. The size and plaque morphology grade of aortic root atheromas was higher with age; however, there was no effect of age on the size or severity of carotid atheromas after PCL. We additionally induced hyperlipidemia in young and old C57BL/6 mice by adeno-associated virus mediated upregulation of LDL receptor regulator, Pcsk9, and 5 weeks of AD. Despite lower cholesterol in old compared to young Pcsk9 mice, there was a greater size and severity of aortic root atheromas in old mice. However, like the ApoE-/- mice, there was no effect of age on size or severity of PCL-induced carotid artery atheromas in Pcsk9 mice. Together, these results suggest that aging increases the size and severity of spontaneous aortic atheromas.

Keywords: Aging; Animal models of human disease; ApoE; Atherosclerosis; Pathophysiology; Pcsk9; Vascular biology.


Conflict of interest statement

The authors declare no competing interests.

Figures

Fig. 1
Fig. 1
Circulating lipids in young (6.6 ± 0.1 mo, N = 20), middle-aged (10.1 ± 0.2 mo, N = 14) or old (16.9 ± 0.1 mo, N = 28) apolipoprotein E knockout (ApoE−/−) mice fed an atherogenic diet (AD) for 3, 5, or 8 weeks. Total cholesterol (a), LDL cholesterol (b), triglycerides (c), and HDL cholesterol (d) were assessed by an Architect ci8200 biochemical analyzer. Data presented are combined over weeks and raw values for young, middle-aged, and old mice after 3 (black circles), 5 (blue squares), and 8 (red triangles) wk AD. Summary data are mean ± SEM,* denotes P < 0.05 compared to young when data is combined over weeks on AD, † denotes P < 0.05 compared to middle-aged when data is combined over weeks on AD. To assess the difference between age groups and when these data were combined over weeks on AD, a one-way ANOVA with least square difference (LSD) post hoc testing was performed
Fig. 2
Fig. 2
Aortic plaque burden in the descending aorta of young (Y: N = 31), middle-aged (MA: N = 19) and old (O: N = 33) apolipoprotein E knockout (ApoE-/-) mice fed an atherogenic diet (AD) for 3, 5, or 8 weeks (wk). Aortic plaque burden was assessed by quantifying percent plaque area in digital images of Sudan IV stained aortas using imageJ software. (a) Aortic percent plaque area in young, middle-aged and old ApoE−/− mice after 3, 5 or 8 weeks on AD. * denotes p < 0.05 compared to young within AD group, † denotes p < 0.05 compared to middle-aged within AD group, ‡ denotes difference from 3 wks within age group, § denotes difference from 5 wks within age group. (b) Aortic percent plaque area in young, middle-aged, and old mice when data is combined over weeks on AD. Individual data presented are raw values for young, middle-aged, and old mice after 3 (black circles), 5 (grey squares), and 8 (red triangles) wk AD. Summary data are mean ± SEM, * denotes p < 0.05 compared to young when data is combined over weeks on AD, † denotes p < 0.05 compared to middle-aged when data is combined over weeks on AD. (c) Representative images of Sudan IV stained descending aortas. To assess the difference between age groups and diet duration for measures, a two-way ANOVA was performed and LSD post hoc testing. When these data were combined over weeks on AD, a one-way ANOVA with LSD post hoc testing was performed
Fig. 3
Fig. 3
Size and severity of atheromas in the aortic root of young (Y: N = 12–24), middle-aged (MA: N = 5–16) and old (O: N = 29) apolipoprotein E knockout (ApoE−/−) mice fed an atherogenic diet (AD) for 3, 5, or 8 weeks. (a) Atheroma area was measured in Maisson’s trichrome stained histological sections of aortic roots from young, middle-aged and old ApoE−/− mice after 3, 5 or 8 weeks on AD. * denotes p < 0.05 compared to young within AD group, † denotes p < 0.05 compared to middle-aged within AD group, ‡ denotes difference from 3 wks within age group, § denotes difference from 5 wks within age group. (b) Aortic root atheroma area in young, middle-aged, and old mice when data is combined over weeks on AD. (c) Area of necrotic cores, when present, in aortic root atheromas from young, middle-aged, and old mice when data is combined over weeks on AD. (d) Plaque morphology grade and severity score. (e) Intraplaque hemorrhage in aortic root atheromas from young, middle-aged and old mice when data is combined over weeks on AD. (f) Lumenal occlusion expressed as the percent reduction by atheroma within the aortic root intimal area, measured with Masson’s trichrome-stained slides. Individual data presented are raw values for young, middle-aged, and old mice after 3 (black circles), 5 (grey squares), and 8 (red triangles) wk AD. Summary data are presented as mean ± SEM. * Denotes P < 0.05 compared to young when data is combined over weeks on AD, † denotes  P< 0.05 compared to middle-aged when data is combined over weeks on AD. Representative images of Masson’s trichrome stained images of aortic roots from (g) young, (h) middle-aged, and (i) old ApoE−/− mice after 8wk AD. Lumen (L), atheroma (A), necrotic core (black arrowheads), and tunica media (TM) are indicated. Scale bar indicates 100 μm. To assess differences in plaque size and severity scores for plaque characteristics, nonparametric Mann–Whitney Wilcoxon signed rank tests were used
Fig. 4
Fig. 4
Measures of VSMC replacement by collagen or proteoglycan matrix and elastin loss in the aortic root of young (Y: N = 19–20), middle-aged (MA: N = 11–12) and old (O: N = 28) apolipoprotein E knockout (ApoE−/−) mice fed an atherogenic diet (AD) for 3, 5, or 8 weeks. (a) Area of tunica media VSMC replaced by proteoglycan (aqua color) or collagen (yellow color) matrix was assessed in Movat’s pentachrome-stained histological sections of aortic roots from young, middle-aged and old ApoE−/− mice after 3, 5 or 8 weeks on AD. * denotes p < 0.05 compared to young within AD group. For samples with multiple aortic root atheroma samples available, maximal area was used in the analyses. (b) Elastin loss score (area of complete loss of elastin), as well as (c) elastin break counts were assessed using Movat’s pentachrome-stained sections. Individual data presented are raw values for young, middle-aged, and old mice after 3 (black circles), 5 (grey squares), and 8 (red triangles) wk AD. Representative images of Movat’s pentachrome-stained images of aortic roots from (d) young, (e) middle-aged, and (f) old ApoE−/− mice after 8wk AD. Lumen (L), tunica media (TM), valve base (V), VSMC (stained red–orange), proteoglycan (stained aqua blue), collagen (stained yellow) matrix, elastin (laminae stained black), and areas of elastin loss and collagen/proteoglycan deposition (black arrows) are indicated. Scale bar indicates 100 μm. To assess differences in root morphology for plaque characteristics, nonparametric or Mann–Whitney Wilcoxon signed rank tests were used. Summary data is presented as mean±SEM
Fig. 5
Fig. 5
Size and severity of atheromas in the left carotid arteries of young (Y: N = 8), middle-aged (MA: N = 4) and old (O: N = 6) apolipoprotein E knockout (ApoE−/−) mice after partial carotid ligation (PCL) and 5 weeks of atherogenic diet (AD). (a) Atheroma area was measured in Masson’s trichrome stained histological sections of the left carotid artery from young, middle-aged and old ApoE−/− mice 5 weeks after PCL and initiation of AD. (b) Area of the necrotic core, when present, in aortic root atheromas from young (N = 4), middle-aged (N = 1), and old (N = 2) mice. (c) Lumenal occlusion expressed as the percent reduction in lumen area, (d) plaque morphology grade and severity score for (e) necrosis in atheromas from the left carotid artery after PCL and 5 wks of AD. Individual data presented are raw values for young, middle-aged, and old mice. Summary data is presented as mean ± SEM. Summary data in panels d and e are median scores. Representative images of Masson Trichrome stained sections of left carotid arteries from young (f), middle-aged (g), and old (h) ApoE−/− mice 5 weeks after PCL and initiation of AD. Lumen (L), atheroma (A), necrotic core (black arrowheads), and tunica media (TM) are indicated. Scale bar indicates 100 μm. To assess differences in plaque grade morphology and severity scores for plaque characteristics, nonparametric or Mann–Whitney Wilcoxon signed rank tests were used
Fig. 6
Fig. 6
Circulating lipids in young (7 mo, Con N = 6, Pcsk9 N = 13), or old (19 mo, Con N = 9, Pcsk9 = 7) C57BL/6 mice treated with a control or proprotein convertase subtilisin/kexin type 9 (Pcsk9) mutant-containing adenoassociated virus (AAV) and fed atherogenic diet for 5 weeks. Total cholesterol (a), LDL cholesterol (b), triglycerides (c), and HDL cholesterol (d) were assessed by Architect ci8200 biochemical analyzer. Individual data presented are raw values for young (Y) and old (O) control (Con)-AAV and Pcsk9-AAV treated mice. Summary data is mean ± SEM, * denotes p < 0.05 compared to age-matched Con treated mice, † denotes p < 0.05 compared to treatment matched young mice. Data were combined over weeks on AD, a one-way ANOVA with LSD post hoc testing was performed
Fig. 7
Fig. 7
Size and severity of atheromas in the aortic root from young (Y: Con N = 9, Pcsk9 N = 13–16) and old (O: Con N = 8, Pcsk9 N = 4–8) C57BL/6 mice treated with either a control (Con) or mutant Pcsk9 containing adeno-associated virus. (a) Plaque grade was measured in Masson’s trichrome stained histological sections of aortic roots from young and old Con and Pcsk9 treated mice fed an atherogenic diet (AD) for 5 weeks after AAV injections (b) Atheroma area was measured from Masson’s trichrome stained slides with multiple aortic root atheroma samples available, maximal area was used in the analyses. (c) Lumenal occlusion, expressed as the percent reduction by atheroma within the aortic root intimal area, measured with Masson’s trichrome-stained slides as well as and (d) severity score for inflammation in aortic root atheromas. Individual data presented are raw values and summary data are mean ± SEM. * denotes p < 0.05 compared to age-matched Con treated mice, † denotes p < 0.05 compared to treatment matched young mice. (e) Representative images of aortic roots stained with Masson’s trichrome. Lumen (L), valve base (V), tunica media (TM), and intimal lesions (atheromas; black arrowheads) are indicated. Scale bar indicates 100 μm. To assess differences in plaque size and severity scores for plaque characteristics, nonparametric or Mann–Whitney Wilcoxon signed rank tests were used where appropriate
Fig. 8
Fig. 8
Size and severity of atheromas in the left carotid artery of young (Y: Con N = 8–9, Pcsk9 N = 11–17) and old (O: Con N = 9, Pcsk9 N = 5) C57BL/6 mice treated with either a control (Con) or mutant Pcsk9 containing adeno-associated virus after partial carotid ligation (PCL). (a) Plaque morphology grade was scored in Masson’s trichrome stained histological sections of carotid arteries from young and old Con and Pcsk9 overexpressing mice fed 5 weeks after PCL and initiation of atherogenic diet. (b) Atheroma area in the left carotid artery. Maximal area was used in the analysis if multiple sections were available. (c) Lumenal occlusion expressed as a percent of lumen area. Individual data presented are raw values and summary data in panels b and c are mean ± SEM and are median scores in panel a. * denotes p < 0.05 compared to age-matched Con mice. (d) Representative images of left carotid arteries stained with Masson’s trichrome (MT). Lumen (L), tunica media (TM), and intimal lesions (atheromas; black arrowheads) are indicated. Scale bar indicates 100 μm. To assess differences in plaque size and severity scores for plaque characteristics, nonparametric or Mann–Whitney Wilcoxon signed rank tests were used where appropriate
Fig. 9
Fig. 9
Measures of VSMC replacement by collagen or proteoglycan matrix and elastin loss in the aortic root from young (Y: Con N = 10, Pcsk9 N = 15–16) and old (O: Con N = 12, Pcsk9 N = 10–11) C57BL/6 mice treated with either a control (Con) or mutant Pcsk9 containing adeno-associated virus. (a) Area of tunica media VSMC replaced by collagen or proteoglycan matrix was assessed in Movat’s pentachrome-stained histological sections of aortic roots from young and old Con and Pcsk9 treated mice fed an atherogenic diet (AD) for 5 weeks after AAV injections. For samples with multiple aortic root atheroma samples available, maximal area was used in the analyses. (b) Elastin loss score (area of complete loss of elastin), as well as (c) elastin break counts were assessed using Movat’s pentachrome-stained sections. Individual data presented are raw values and summary data is mean ± SEM. (d) Representative images of aortic roots stained with Movat’s pentachrome. Lumen (L), tunica media (TM), valve base (v), VSMC (stained red–orange), proteoglycan (stained aqua blue), collagen (stained yellow) matrix, elastin (laminae stained black), and areas of elastin loss and collagen/proteoglycan deposition (black arrows) are indicated. Scale bar indicates 100 μm. To assess differences in root morphology for plaque characteristics, nonparametric or Mann–Whitney Wilcoxon signed rank tests were used
Fig. 10
Fig. 10
Schematic representation of study design. (a) Experimental design in ApoE−/− mouse model (b) Experimental design for C57BL/6 J mouse model. Y: young, MA: middle age, O: old; PCL: partial carotid ligation, AD: atherogenic diet, 3, 5 and 8 wks: weeks, AAV-Pcsk9: adeno-associated virus—proprotein convertase subtilisin/kexin type 9

References

    1. Heron M. Deaths: leading causes for 2017. Natl Vital Stat Rep. 2019;68(6):1–77. - PubMed
    1. Benjamin EJ, et al. Heart disease and stroke statistics-2019 update: a report from the American Heart Association. Circulation. 2019;139(10):e56–e528. doi: 10.1161/CIR.0000000000000659. - DOI - PubMed
    1. Virani SS, et al. Heart disease and stroke statistics-2020 update: a report from the American Heart Association. Circulation. 2020;141(9):e139–e596. doi: 10.1161/CIR.0000000000000757. - DOI - PubMed
    1. Lakatta EG, Levy D. Arterial and cardiac aging: major shareholders in cardiovascular disease enterprises: part I: aging arteries: a "set up" for vascular disease. Circulation. 2003;107(1):139–146. doi: 10.1161/01.CIR.0000048892.83521.58. - DOI - PubMed
    1. Go AS, et al. Heart disease and stroke statistics–2014 update: a report from the American Heart Association. Circulation. 2014;129(3):e28–e292. - PMC - PubMed

Publication types